

Self-luminescing BRET-FRET near-infrared dots for in vivo lymph-node mapping and tumour imaging
- PMID: 23149738
- PMCID: PMC3527090
- DOI: 10.1038/ncomms2197
Self-luminescing BRET-FRET near-infrared dots for in vivo lymph-node mapping and tumour imaging
Abstract
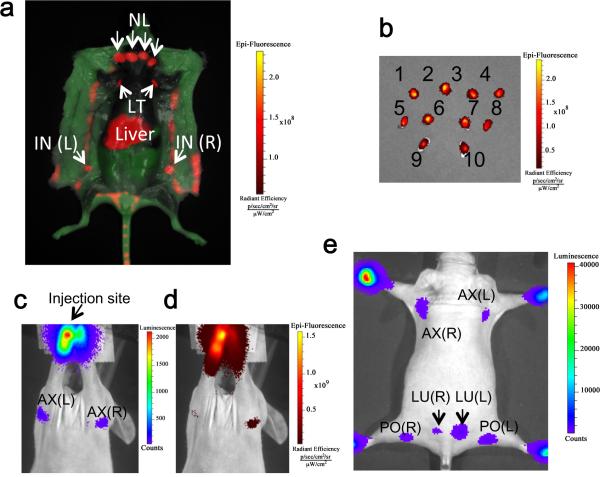
Strong autofluorescence from living tissues, and the scattering and absorption of short-wavelength light in living tissues, significantly reduce sensitivity of in vivo fluorescence imaging. These issues can be tackled by using imaging probes that emit in the near-infrared wavelength range. Here we describe self-luminescing near-infrared-emitting nanoparticles employing an energy transfer relay that integrates bioluminescence resonance energy transfer and fluorescence resonance energy transfer, enabling in vivo near-infrared imaging without external light excitation. Nanoparticles were 30-40 nm in diameter, contained no toxic metals, exhibited long circulation time and high serum stability, and produced strong near-infrared emission. Using these nanoparticles, we successfully imaged lymphatic networks and vasculature of xenografted tumours in living mice. The self-luminescing feature provided excellent tumour-to-background ratio (>100) for imaging very small tumours (2-3 mm in diameter). Our results demonstrate that these new nanoparticles are well suited to in vivo imaging applications such as lymph-node mapping and cancer imaging.
Figures


Similar articles
-
Self-illuminating in vivo lymphatic imaging using a bioluminescence resonance energy transfer quantum dot nano-particle.Contrast Media Mol Imaging. 2011 Jan-Feb;6(1):55-9. doi: 10.1002/cmmi.395. Epub 2010 May 28. Contrast Media Mol Imaging. 2011. PMID: 21351373 Free PMC article.
-
Quantum dot-NanoLuc bioluminescence resonance energy transfer enables tumor imaging and lymph node mapping in vivo.Chem Commun (Camb). 2016 May 19;52(43):6997-7000. doi: 10.1039/c6cc02764d. Chem Commun (Camb). 2016. PMID: 27157466 Free PMC article.
-
Bioluminescence Resonance Energy Transfer (BRET)-coupled Annexin V-functionalized Quantum Dots for Near-Infrared Optical Detection of Apoptotic Cells.Chembiochem. 2017 Nov 16;18(22):2231-2235. doi: 10.1002/cbic.201700486. Epub 2017 Oct 18. Chembiochem. 2017. PMID: 28901721
-
Image-guided sentinel lymph node mapping and nanotechnology-based nodal treatment in lung cancer using invisible near-infrared fluorescent light.Semin Thorac Cardiovasc Surg. 2009 Winter;21(4):309-15. doi: 10.1053/j.semtcvs.2009.11.009. Semin Thorac Cardiovasc Surg. 2009. PMID: 20226343 Free PMC article. Review.
-
Advanced Bioluminescence System for In Vivo Imaging with Brighter and Red-Shifted Light Emission.Int J Mol Sci. 2020 Sep 7;21(18):6538. doi: 10.3390/ijms21186538. Int J Mol Sci. 2020. PMID: 32906768 Free PMC article. Review.
Cited by
-
Different PEG-PLGA Matrices Influence In Vivo Optical/Photoacoustic Imaging Performance and Biodistribution of NIR-Emitting π-Conjugated Polymer Contrast Agents.Adv Healthc Mater. 2021 Feb;10(4):e2001089. doi: 10.1002/adhm.202001089. Epub 2020 Aug 31. Adv Healthc Mater. 2021. PMID: 32864903 Free PMC article.
-
High resolution tracking of macrophage cells in deep organs and lymphatics using fluorescent polymer dots.RSC Adv. 2019 Apr 9;9(19):10966-10975. doi: 10.1039/c9ra00954j. eCollection 2019 Apr 3. RSC Adv. 2019. PMID: 35515275 Free PMC article.
-
Multilayered semiconducting polymer nanoparticles with enhanced NIR fluorescence for molecular imaging in cells, zebrafish and mice.Chem Sci. 2016 Aug 1;7(8):5118-5125. doi: 10.1039/c6sc01251e. Epub 2016 Apr 14. Chem Sci. 2016. PMID: 30155162 Free PMC article.
-
Conjugated Polymeric Materials in Biological Imaging and Cancer Therapy.Molecules. 2023 Jun 29;28(13):5091. doi: 10.3390/molecules28135091. Molecules. 2023. PMID: 37446753 Free PMC article. Review.
-
Recent Advances in the Development of Highly Luminescent Semiconducting Polymer Dots and Nanoparticles for Biological Imaging and Medicine.Anal Chem. 2017 Jan 3;89(1):42-56. doi: 10.1021/acs.analchem.6b04672. Epub 2016 Dec 8. Anal Chem. 2017. PMID: 28105818 Free PMC article. Review. No abstract available.
References
-
- Ntziachristos V, Ripoll J, Wang LHV, Weissleder R. Looking and listening to light: the evolution of whole-body photonic imaging. Nat. Biotechnol. 2005;23:313–320. - PubMed
-
- McDonald DM, Choyke PL. Imaging of angiogenesis: from microscope to clinic. Nat. Med. 2003;9:713–725. - PubMed
-
- Contag CH, Bachmann MH. Advances in vivo bioluminescence imaging of gene expression. Annu. Rev. Biomed. Eng. 2002;4:235–260. - PubMed
-
- Wagnieres GA, Star WM, Wilson BC. In vivo fluorescence spectroscopy and imaging for oncological applications. Photochem. & Photobiol. 1998;68:603–632. - PubMed
-
- van Dam GM, et al. Intraoperative tumor-specific fluorescence imaging in ovarian cancer by folate receptor-alpha targeting: first in-human results. Nat. Med. 2011;17:1315–1319. - PubMed
Publication types
MeSH terms
Substances
Grants and funding
LinkOut - more resources
Full Text Sources
Other Literature Sources
Medical
