

Genome sequences of wild and domestic bactrian camels
- PMID: 23149746
- PMCID: PMC3514880
- DOI: 10.1038/ncomms2192
Genome sequences of wild and domestic bactrian camels
Erratum in
- Nat Commun. 2013;4. doi: 10.1038/ncomms3089
Abstract
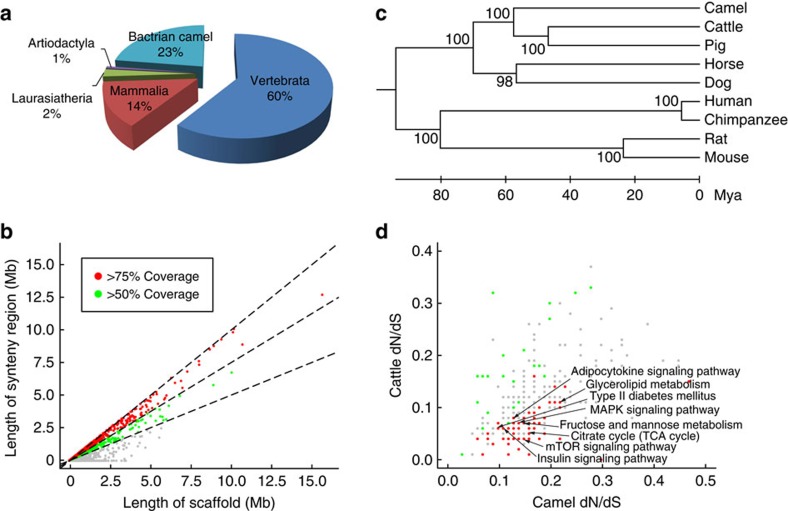
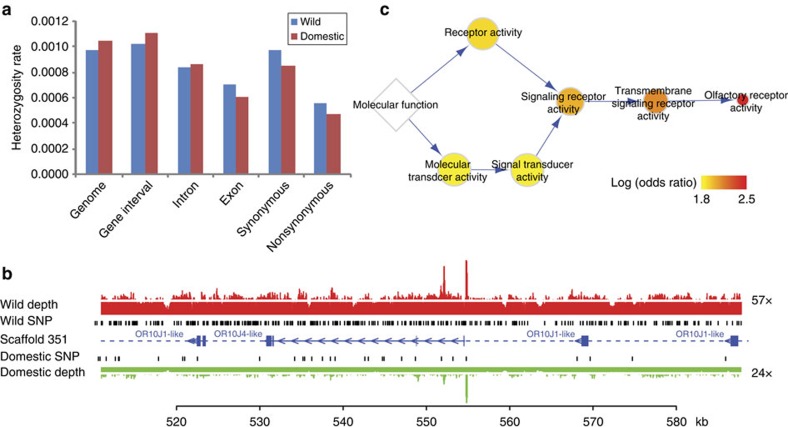
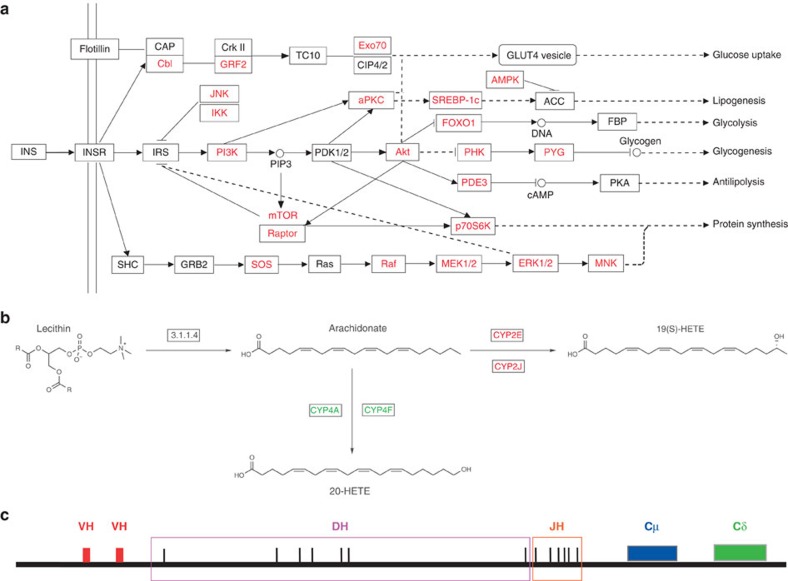
Bactrian camels serve as an important means of transportation in the cold desert regions of China and Mongolia. Here we present a 2.01 Gb draft genome sequence from both a wild and a domestic bactrian camel. We estimate the camel genome to be 2.38 Gb, containing 20,821 protein-coding genes. Our phylogenomics analysis reveals that camels shared common ancestors with other even-toed ungulates about 55-60 million years ago. Rapidly evolving genes in the camel lineage are significantly enriched in metabolic pathways, and these changes may underlie the insulin resistance typically observed in these animals. We estimate the genome-wide heterozygosity rates in both wild and domestic camels to be 1.0 × 10(-3). However, genomic regions with significantly lower heterozygosity are found in the domestic camel, and olfactory receptors are enriched in these regions. Our comparative genomics analyses may also shed light on the genetic basis of the camel's remarkable salt tolerance and unusual immune system.
Figures
Similar articles
-
Molecular phylogeny of the Bactrian camel based on mitochondrial Cytochrome b gene sequences.Genet Mol Res. 2016 Sep 19;15(3). doi: 10.4238/gmr.15038983. Genet Mol Res. 2016. PMID: 27706756
-
Exploring the genomic resources of seven domestic Bactrian camel populations in China through restriction site-associated DNA sequencing.PLoS One. 2021 Apr 29;16(4):e0250168. doi: 10.1371/journal.pone.0250168. eCollection 2021. PLoS One. 2021. PMID: 33914766 Free PMC article.
-
Genetic diversity and phylogeographic structure of Bactrian camels shown by mitochondrial sequence variations.Anim Genet. 2017 Apr;48(2):217-220. doi: 10.1111/age.12511. Epub 2016 Oct 24. Anim Genet. 2017. PMID: 27775167 Free PMC article.
-
Emergence and evolution of functional heavy-chain antibodies in Camelidae.Dev Comp Immunol. 2003 Feb;27(2):87-103. doi: 10.1016/s0145-305x(02)00071-x. Dev Comp Immunol. 2003. PMID: 12543123 Review.
-
An update on sarcocystosis in one-humped camels (Camelus dromedarius).Parasitology. 2018 Sep;145(11):1367-1377. doi: 10.1017/S0031182018000239. Epub 2018 Jun 5. Parasitology. 2018. PMID: 29866208 Review.
Cited by
-
Beyond drugs: the evolution of genes involved in human response to medications.Proc Biol Sci. 2019 Oct 23;286(1913):20191716. doi: 10.1098/rspb.2019.1716. Epub 2019 Oct 23. Proc Biol Sci. 2019. PMID: 31640517 Free PMC article.
-
Pseudo-chromosome-length genome assembly for a deep-sea eel Ilyophis brunneus sheds light on the deep-sea adaptation.Sci China Life Sci. 2023 Jun;66(6):1379-1391. doi: 10.1007/s11427-022-2251-8. Epub 2023 Jan 12. Sci China Life Sci. 2023. PMID: 36648612
-
Studying immunity to zoonotic diseases in the natural host - keeping it real.Nat Rev Immunol. 2013 Dec;13(12):851-61. doi: 10.1038/nri3551. Epub 2013 Oct 25. Nat Rev Immunol. 2013. PMID: 24157573 Free PMC article. Review.
-
Assembly: a resource for assembled genomes at NCBI.Nucleic Acids Res. 2016 Jan 4;44(D1):D73-80. doi: 10.1093/nar/gkv1226. Epub 2015 Nov 17. Nucleic Acids Res. 2016. PMID: 26578580 Free PMC article.
-
The genome of the miiuy croaker reveals well-developed innate immune and sensory systems.Sci Rep. 2016 Feb 23;6:21902. doi: 10.1038/srep21902. Sci Rep. 2016. PMID: 26902509 Free PMC article.
References
-
- Bannikov A. Wild camels of the Gobi. Wildlife 18, 398–403 (1976).
-
- Yuan G.e.a. Ecology and Conservation of Wild Bactrian Camels (Camelus bactrianus ferus) (Mongolian Conservation Coalition & Admon Printing (2002)).
-
- Peters J., Driesch A. The two-humped camel (Camelus bactrianus): new light on its distribution, management and medical treatment in the past. J. Zool. 242, 651–679 (1997).
-
- Emmanuel B., Nahapetian A. Fatty acid composition of depot fats, and rumen wall of the camel (Camelus dromedarius). Comp. Biochem. Physiol. Part B: Comp. Biochem. 67, 701–704 (1980).
-
- Schmidt-Nielsen K. Desert Animals. Physiological Problems of Heat and Water (Oxford University Press (1964)).
Publication types
MeSH terms
Substances
Associated data
- Actions
LinkOut - more resources
Full Text Sources
Other Literature Sources
Medical
