. 2012 Nov 8;13(6):3868.
doi: 10.1120/jacmp.v13i6.3868.

Accuracy of lung nodule density on HRCT: analysis by PSF-based image simulation

Affiliations

Accuracy of lung nodule density on HRCT: analysis by PSF-based image simulation

Ken Ohno et al. J Appl Clin Med Phys. .

Abstract

A computed tomography (CT) image simulation technique based on the point spread function (PSF) was applied to analyze the accuracy of CT-based clinical evaluations of lung nodule density. The PSF of the CT system was measured and used to perform the lung nodule image simulation. Then, the simulated image was resampled at intervals equal to the pixel size and the slice interval found in clinical high-resolution CT (HRCT) images. On those images, the nodule density was measured by placing a region of interest (ROI) commonly used for routine clinical practice, and comparing the measured value with the true value (a known density of object function used in the image simulation). It was quantitatively determined that the measured nodule density depended on the nodule diameter and the image reconstruction parameters (kernel and slice thickness). In addition, the measured density fluctuated, depending on the offset between the nodule center and the image voxel center. This fluctuation was reduced by decreasing the slice interval (i.e., with the use of overlapping reconstruction), leading to a stable density evaluation. Our proposed method of PSF-based image simulation accompanied with resampling enables a quantitative analysis of the accuracy of CT-based evaluations of lung nodule density. These results could potentially reveal clinical misreadings in diagnosis, and lead to more accurate and precise density evaluations. They would also be of value for determining the optimum scan and reconstruction parameters, such as image reconstruction kernels and slice thicknesses/intervals.


Figures

Figure 1
Figure 1. Generation of a simulated nodule: (a) object function obtained by assuming a pulmonary nodule; (b) the simulated blurred image obtained from image (a); (c) the image obtained by the resampling of image (b).
Figure 2
Figure 2. The offset (Δx, Δy and Δz) between nodule center and image voxel center are represented schematically. The voxel is the 3D region defined by the slice and pixel bounds.
Figure 3
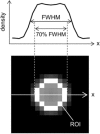
Figure 3. The region of interest (ROI) used for measurement of nodule density: (lower) the full width at half maximum (FWHM) was estimated from the density profile (upper) along a horizontal line (indicated by a line in the image) through the sphere center. The 70% of FWHM was applied to the diameter of the circular ROI.
Figure 4
Figure 4. Addition of a simulated nodule image to the phantom lung image. The simulated nodule image Id (right) was added by the constant of 900 HU; then, it was added to the lung field in the phantom image (left).
Figure 5
Figure 5. The point spread functions (PSF) measured for three types of reconstruction kernels, FC10 (a), FC50 (b), and FC52 (c). SSPs measured for two reconstruction slice thicknesses 1.0 and 2.0 mm (d).
Figure 6
Figure 6. Two cases of the 3D offset between nodule center and voxel center. The images (a) (left; axial image, right; sagittal image) were obtained with the minimum offset, while the images (b) were obtained with the maximum offset. Dots show the spatial location of the nodule center. One pixel and one slice that were centered at a location nearest to the nodule center are indicated by square and double arrow, respectively.
Figure 7
Figure 7. Comparison of resampled image and measured image, for the spherical object with diameter of 2 mm: (a) image obtained from the 50 mm FOV image by the resampling with the minimum values of Δx, Δy and Δz; (b) image with the 200 mm FOV; (c) CT value profile for 7(a) (dashed‐line) and for 7(b) (gray‐line). These results were for the slice thickness of 2.0 mm and reconstruction kernel of FC50. Similar results (d–f) for the maximum values of Δx, Δy and Δz.
Figure 8
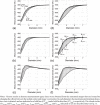
Figure 8. The measured densities in simulated nodule images, for diameters from 1.0 to 8.0 mm for: slice thicknesses of 1.0 mm (a–c) and for 2.0 mm (d–f), and reconstruction kernels of FC10 (a, d), FC50 (b, e) and FC52 (c, f).
Figure 11
Figure 11. Phantom sphere images (from left to right, diameters of 2, 3, 5, and 7 mm) obtained experimentally (200 mm FOV): (a–d) in the case of the minimum offset between sphere center and voxel center; (e–h) in the case of the maximum offset. All images are displayed with the same window and level settings.
Figure 9
Figure 9. The results of the CTmax and CTmin (defined in obtained by changing the slice interval for: slice thickness of 1.0 mm (a–c), and for slice thickness of 2.0 mm (d–f), and reconstruction kernels of FC10 (a, d), FC50 (b, e), and FC52 (c, f).
Figure 10
Figure 10. Simulated nodules that were used to obtain the results indicated as A–C for 2, 3, and 4 mm diameters in were added to the phantom lung image. The object functions are also shown. The density value of each nodule A–C is shown, which are measured with the ROI described in Fig. 3.

References

    1. National Lung Screening Trial Research Team, Aberle DR, Adams AM, et al. Reduced lung‐cancer mortality with low‐dose computed tomographic screening. N Engl J Med. 2011;365(5):395–409. - PMC - PubMed
    1. Sone S, Matsumoto T, Honda T, et al. HRCT features of small peripheral lung carcinomas detected in a low‐dose CT screening program. Acad Radiol. 2010;17(1):75–83. - PubMed
    1. Sone S, Tsushima K, Yoshida K, Hamanaka K, Hanaoka T, Kondo R. Pulmonary nodules: preliminary experience with semiautomated volumetric evaluation by CT stratum. Acad Radiol. 2010;17(7):900–11. - PubMed
    1. Iwano S, Nakamura T, Kamioka Y, Ikeda M, Ishigaki T. Computer‐aided differentiation of malignant from benign solitary pulmonary nodules imaged by high‐resolution CT. Comput Med Imaging Graph. 2008;32(5):416–22. - PubMed
    1. Iwano S, Makino N, Ikeda M, et al. Solitary pulmonary nodules: optimal slice thickness of high‐resolution CT in differentiating malignant from benign. Clin Imaging. 2004;28(5):322–28. - PubMed

Publication types

MeSH terms