

MAGAT gel and EBT2 film-based dosimetry for evaluating source plugging-based treatment plan in Gamma Knife stereotactic radiosurgery
- PMID: 23149780
- PMCID: PMC5718525
- DOI: 10.1120/jacmp.v13i6.3877
MAGAT gel and EBT2 film-based dosimetry for evaluating source plugging-based treatment plan in Gamma Knife stereotactic radiosurgery
Abstract
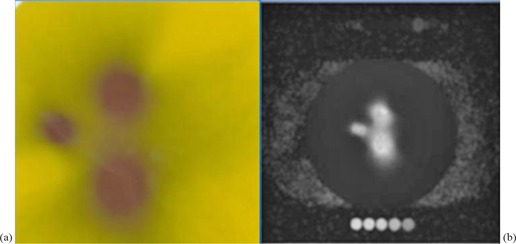
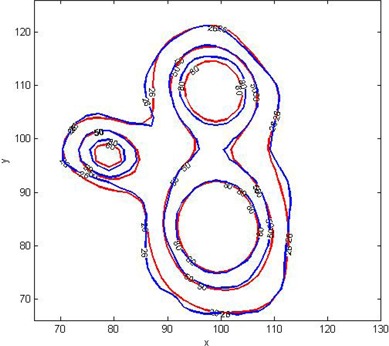
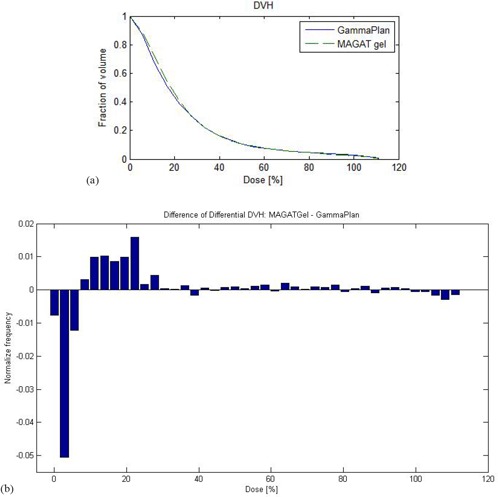
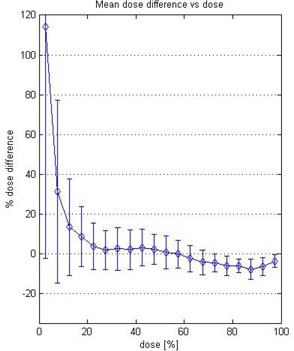
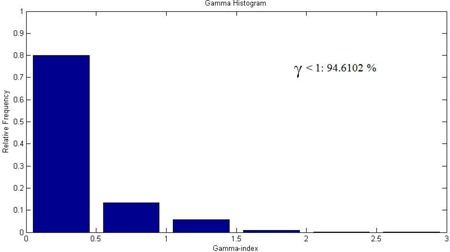
This work illustrates a procedure to assess the overall accuracy associated with Gamma Knife treatment planning using plugging. The main role of source plugging or blocking is to create dose falloff in the junction between a target and a critical structure. We report the use of MAGAT gel dosimeter for verification of an experimental treatment plan based on plugging. The polymer gel contained in a head-sized glass container simulated all major aspects of the treatment process of Gamma Knife radiosurgery. The 3D dose distribution recorded in the gel dosimeter was read using a 1.5T MRI scanner. Scanning protocol was: CPMG pulse sequence with 8 equidistant echoes, TR = 7 s, echo step = 14 ms, pixel size = 0.5mm × 0.5mm, and slice thickness of 2 mm. Using a calibration relationship between absorbed dose and spin-spin relaxation rate (R2), we converted R2 images to dose images. Volumetric dose comparison between treatment planning system (TPS) and gel measurement was accomplished using an in-house MATLAB-based program. The isodose overlay of the measured and computed dose distribution on axial planes was in close agreement. Gamma index analysis of 3D data showed more than 94% voxel pass rate for different tolerance criteria of 3%/2 mm, 3%/1 mm and 2%/2 mm. Film dosimetry with GAFCHROMIC EBT 2 film was also performed to compare the results with the calculated TPS dose. Gamma index analysis of film measurement for the same tolerance criteria used for gel measurement evaluation showed more than 95% voxel pass rate. Verification of gamma plan calculated dose on account of shield is not part of acceptance testing of Leksell Gamma Knife (LGK). Through this study we accomplished a volumetric comparison of dose distributions measured with a polymer gel dosimeter and Leksell GammaPlan (LGP) calculations for plans using plugging. We propose gel dosimeter as a quality assurance (QA) tool for verification of plug-based planning.
Figures


Similar articles
-
Indigenously developed multipurpose acrylic head phantom for verification of IMRT using film and gel dosimetry.J Appl Clin Med Phys. 2013 Mar 4;14(2):4041. doi: 10.1120/jacmp.v14i2.4041. J Appl Clin Med Phys. 2013. PMID: 23470932 Free PMC article.
-
MRI-based polymer gel dosimetry for validating plans with multiple matrices in Gamma Knife stereotactic radiosurgery.J Appl Clin Med Phys. 2011 Jan 31;12(2):3333. doi: 10.1120/jacmp.v12i2.3333. J Appl Clin Med Phys. 2011. PMID: 21587176 Free PMC article.
-
Verification of Gamma Knife extend system based fractionated treatment planning using EBT2 film.Med Phys. 2013 Dec;40(12):122104. doi: 10.1118/1.4832138. Med Phys. 2013. PMID: 24320531
-
3-D treatment planning system-Leksell Gamma Knife treatment planning system.Med Dosim. 2018 Summer;43(2):177-183. doi: 10.1016/j.meddos.2018.03.001. Epub 2018 Apr 12. Med Dosim. 2018. PMID: 29656889 Review.
-
Research Progress of Intelligent Polymer Plugging Materials.Molecules. 2023 Mar 27;28(7):2975. doi: 10.3390/molecules28072975. Molecules. 2023. PMID: 37049737 Free PMC article. Review.
Cited by
-
Radiation Dosimetry by Use of Radiosensitive Hydrogels and Polymers: Mechanisms, State-of-the-Art and Perspective from 3D to 4D.Gels. 2022 Sep 19;8(9):599. doi: 10.3390/gels8090599. Gels. 2022. PMID: 36135311 Free PMC article. Review.
-
Indigenously developed multipurpose acrylic head phantom for verification of IMRT using film and gel dosimetry.J Appl Clin Med Phys. 2013 Mar 4;14(2):4041. doi: 10.1120/jacmp.v14i2.4041. J Appl Clin Med Phys. 2013. PMID: 23470932 Free PMC article.
-
Improved Dose Response of N-(hydroxymethyl)acrylamide Gel Dosimeter with Calcium Chloride for Radiotherapy.Gels. 2022 Jan 26;8(2):78. doi: 10.3390/gels8020078. Gels. 2022. PMID: 35200459 Free PMC article.
References
-
- Elekta Education & Training Department . Leksell Gamma Knife Model B Training Manual Rev 000. Stockholm, Sweden: Elekta Instrument AB; 1997.
-
- Moskvin V, Timmerman R, DesRosiers C, et al. Monte Carlo simulation of the Leksell gamma knife: II. Effects of heterogeneous versus homogeneous media for stereotactic radiosurgery. Phys Med Biol. 2004;49(21):4879–95. - PubMed
-
- Isbakan F, Ulgen Y, Bilge H, Ozen Z, Agus O, Buyuksarac B. Gamma Knife 3‐D dose distribution near the area of tissue inhomogeneities by normoxi gel dosimetry. Med Phys. 2007;34(5)1623–30. - PubMed
-
- Fraass B, Doppke K, Hunt M, et al. American Association of Physics in Medicine Radiation Therapy Committee Task Group 53: quality assurance for clinical radiotherapy treatment planning. Med Phys. 1998;25(10):1773–829. - PubMed
-
- Hartmann GH, editor. Quality assurance program on stereotactic radiosurgery: report from a quality assurance task group. New York: Springer; 1995.
Publication types
MeSH terms
Substances
LinkOut - more resources
Full Text Sources
