. 2013 Jan;33(2):396-405.
doi: 10.1128/MCB.01174-12. Epub 2012 Nov 12.

RBFOX2 is an important regulator of mesenchymal tissue-specific splicing in both normal and cancer tissues

Affiliations

RBFOX2 is an important regulator of mesenchymal tissue-specific splicing in both normal and cancer tissues

Julian P Venables et al. Mol Cell Biol. 2013 Jan.

Abstract

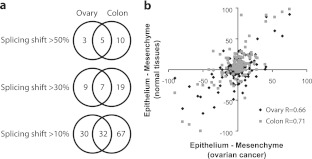
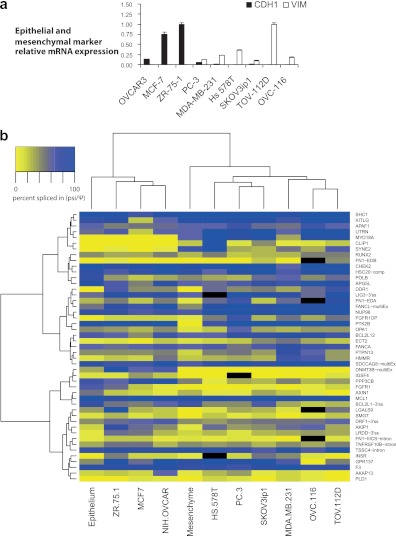
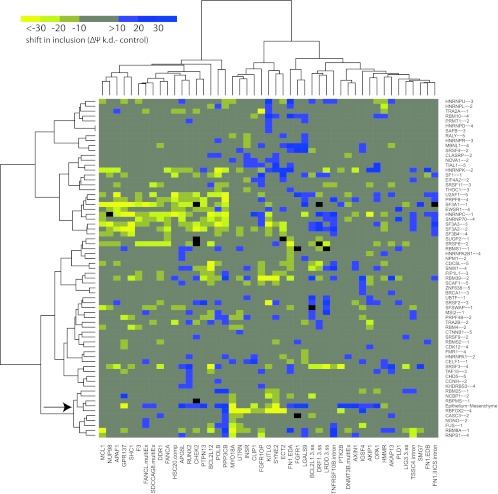
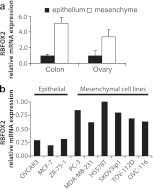
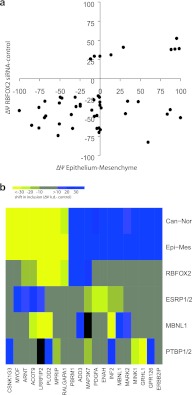
Alternative splicing provides a critical and flexible layer of regulation intervening in many biological processes to regulate the diversity of proteins and impact cell phenotype. To identify alternative splicing differences that distinguish epithelial from mesenchymal tissues, we have investigated hundreds of cassette exons using a high-throughput reverse transcription-PCR (RT-PCR) platform. Extensive changes in splicing were noted between epithelial and mesenchymal tissues in both human colon and ovarian tissues, with many changes from mostly one splice variant to predominantly the other. Remarkably, many of the splicing differences that distinguish normal mesenchymal from normal epithelial tissues matched those that differentiate normal ovarian tissues from ovarian cancer. Furthermore, because splicing profiling could classify cancer cell lines according to their epithelial/mesenchymal characteristics, we used these cancer cell lines to identify regulators for these specific splicing signatures. By knocking down 78 potential splicing factors in five cell lines, we provide an extensive view of the complex regulatory landscape associated with the epithelial and mesenchymal states, thus revealing that RBFOX2 is an important driver of mesenchymal tissue-specific splicing.


Figures

Fig 1
Fig 1
A majority of ovarian cancer-associated splicing changes correspond to changes between normal epithelial and mesenchymal tissues. (a) Common epithelial/mesenchymal tissue-specific alternative exons between the colon and the ovary systems. A total of 178 alternative exons were used for comparison between the colon and ovary systems. The Venn diagram illustrates the tissue distribution of the epithelial/mesenchymal alternative exons obtained for differences in percentage points that go in the same direction and for various cutoff values. (b) Scatter plot of differences in the alternative splicing of 178 alternative exons in normal epithelial versus mesenchymal fetal colon tissues as measured by endpoint RT-PCR (y axis, in gray). RT-PCR assays were also carried out for 178 alternative exons in dissected normal ovarian stroma and fallopian epithelial tissues (y axis, in black). The values are plotted as Δψ (ψepithelium − ψmesenchyme) relative to values obtained by comparing 21 normal ovaries versus 25 ovarian serous high-grade tumors (x axis; ovarian cancer) (33). The Pearson correlation between the splicing shift in normal ovarian and colon systems and the splicing shift in ovarian cancer is indicated on the bottom right of the graph.
Fig 2
Fig 2
The epithelial-mesenchymal splicing signature of cancer cell lines matches their vimentin/E-cadherin signatures. (a) The relative expression levels of the epithelial marker CDH1 and the stromal mesenchymal marker VIM were monitored in nine cancer cell lines by quantitative RT-PCR. The geometrical mean of three housekeeping genes was used to calculate the normalization factor (see Materials and Methods). Bar graphs represent the means of three technical replicates, and error bars represent standard deviations. (b) Heat map showing the unsupervised hierarchical clustering of fetal colon epithelial and mesenchymal tissues along with 9 cancer cell lines using the 47 alternative splice events shown (see Table S2b in the supplemental material). Splicing (ψ) values are represented in shades of yellow (exon skipping) to blue (exon inclusion), as indicated in the color key histogram.
Fig 3
Fig 3
The impact of knocking down RBFOX2 most closely matches the differences between epithelium and mesenchyme. Unsupervised hierarchical clustering of the median change in splicing (Δψ knockdown [k.d.] − control) for 47 alternative splicing events in each of the 68 splicing factor knockdowns for which the median splicing value changed by at least 10 percentage point for at least one alternative splice event. The number next to the protein indicates the number of cell lines in which the RBP was successfully knocked down (the criterion being >50% downregulation for both siRNAs as assessed by qPCR). The results are clustered along with the splicing differences between epithelium and mesenchyme colon tissues. Splicing shifts are in bins of 10 percentage points from less than −30 percentage points (bright yellow) to greater than +30 percentage points (darkest blue). The RBFOX2 (siRNA control) (below) and the epithelial-mesenchymal (above) splicing differences are indicated by the arrow.
Fig 4
Fig 4
Rbfox2 expression data in normal epithelium and mesenchyme. (a) Rbfox2 expression in the epithelium and mesenchyme samples isolated from human fetal colon and ovary/fallopian tissues. The expression of Rbfox2 was monitored by quantitative RT-PCR in colon (technical triplicate) and ovarian (biological quadruplicate) tissues. Values were normalized to the geometrical means of three housekeeping genes. The results were plotted in the form of bar graphs. (b) Quantitative RT-PCR measurement of Rbfox2 in cancer cell lines. Cell lines are organized according to their epithelial/mesenchymal characteristics.
Fig 5
Fig 5
RBFOX2 contributes to complex regulation of splicing in mesenchymal cells. (a) Scatter plot comparing the changes of percent-spliced-in values (Δψ) for 48 RBFOX2 targets (33) with their Δψ from the epithelial and mesenchymal colon comparison. Eighteen switch-like alternative exons (Δψ, >50 percentage points) can be identified from the epithelium and mesenchymal colon comparison. (b) Twenty-six switch-like exons from Table S2a in the supplemental material were subjected to further analysis in cells knocked down for four RNA-binding proteins implicated in EMT (see the text). The heat map shows data for 20 exons that shifted between cancer and normal tissue and gave good data for ESRP1 and RBFOX knockdowns. Splicing shifts are shown in bins of 10 percentage points, in increasingly strong shades of blue (inclusion) or yellow (skipping) for changes greater than 10, 20, or 30 percentage points, respectively.

References

    1. Thiery JP, Acloque H, Huang RY, Nieto MA. 2009. Epithelial-mesenchymal transitions in development and disease. Cell 139:871–890 - PubMed
    1. Barrallo-Gimeno A, Nieto MA. 2005. The Snail genes as inducers of cell movement and survival: implications in development and cancer. Development 132:3151–3161 - PubMed
    1. Klymkowsky MW, Savagner P. 2009. Epithelial-mesenchymal transition: a cancer researcher's conceptual friend and foe. Am. J. Pathol. 174:1588–1593 - PMC - PubMed
    1. Polyak K, Weinberg RA. 2009. Transitions between epithelial and mesenchymal states: acquisition of malignant and stem cell traits. Nat. Rev. Cancer 9:265–273 - PubMed
    1. Yilmaz M, Christofori G. 2009. EMT, the cytoskeleton, and cancer cell invasion. Cancer Metastasis Rev. 28:15–33 - PubMed

Publication types

MeSH terms

LinkOut - more resources