

MRI reveals differential effects of amphetamine exposure on neuroglia in vivo
- PMID: 23150521
- PMCID: PMC3545538
- DOI: 10.1096/fj.12-220061
MRI reveals differential effects of amphetamine exposure on neuroglia in vivo
Abstract
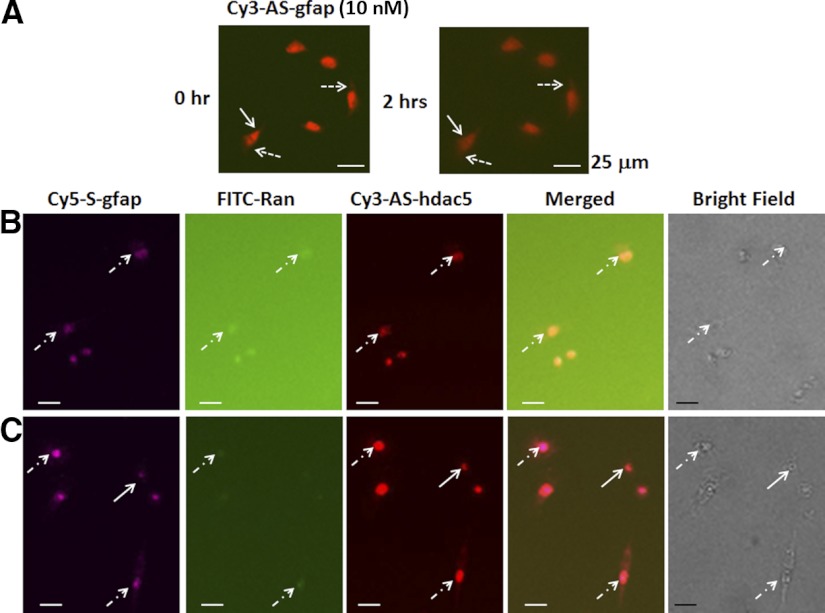
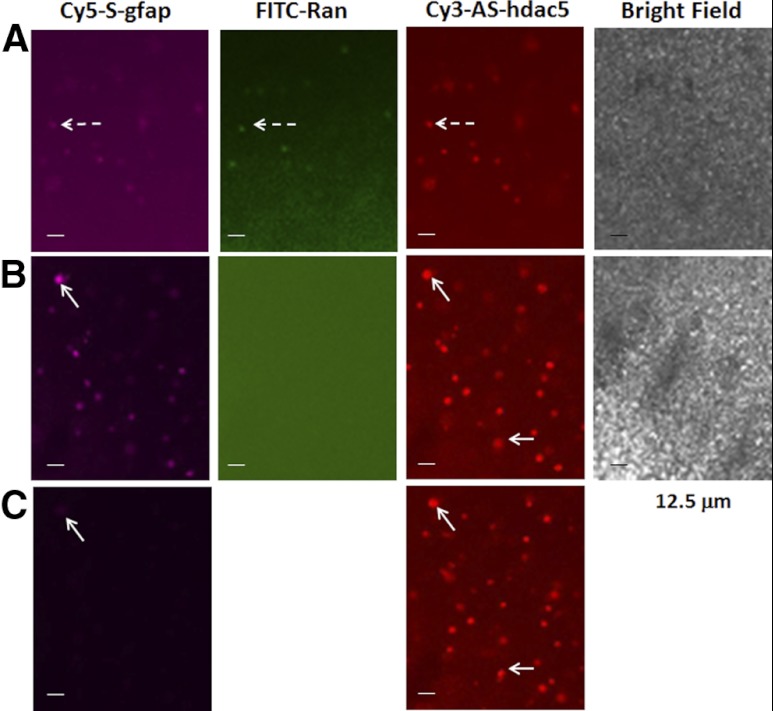
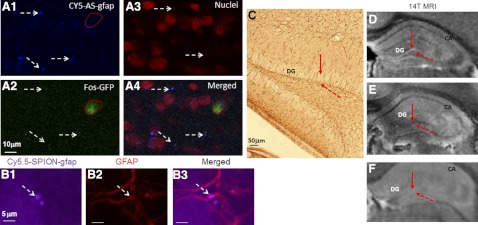
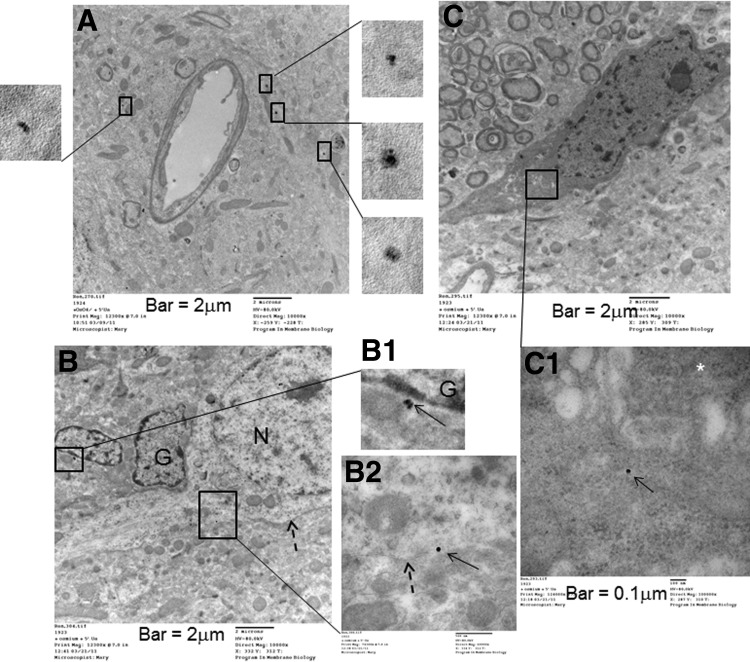
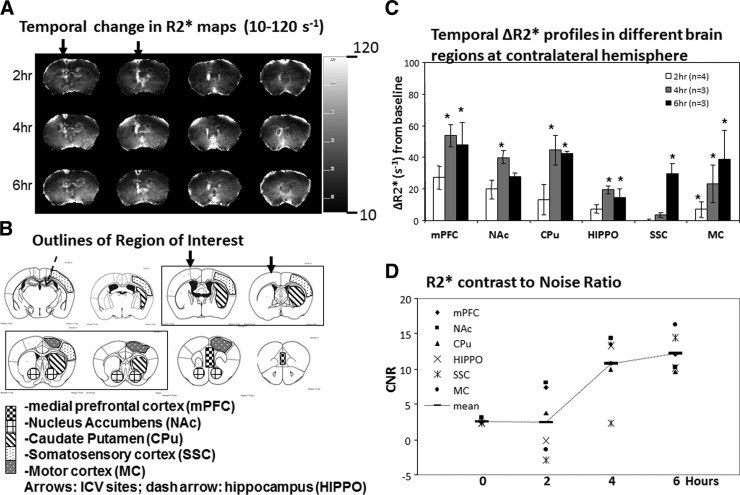
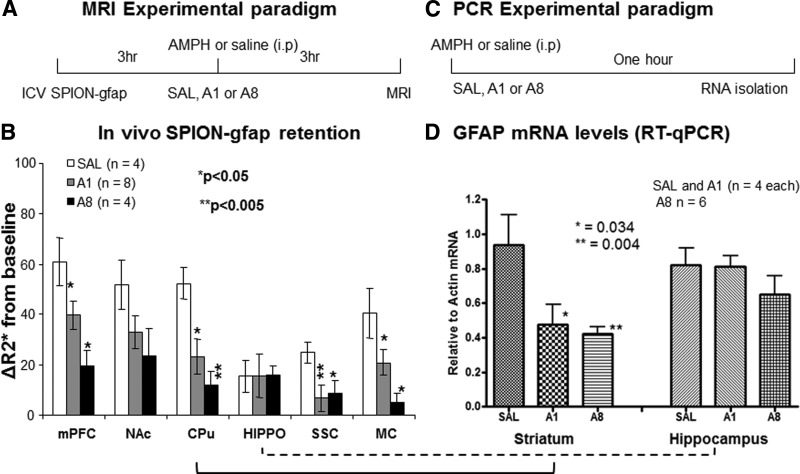
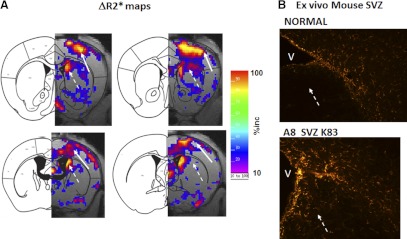
How amphetamine affects the neuroglia in living brains is not well understood. In an effort to elucidate this effect, we investigated neuroglia in response to amphetamine exposure using antisense (AS) or sense (S) phosphorothioate-modified oligodeoxynucleotide (sODN) sequences that correspond to glial fibrillary acidic protein (GFAP) mRNA (AS-gfap or S-gfap, respectively) expression. The control is a random-sequence sODN (Ran). Using cyanine 5.5-superparamagnetic iron oxide nanoparticle (Cy5.5-SPION) labeling and fluorescent microscopy, we demonstrated that living neural progenitor cells (PC-12.1), as well as the cells in fresh brain slices and intact brains of male C57BL6 mice, exhibited universal uptake of all of the sODNs but rapidly excluded all sODN-Ran and most S-gfap. Moreover, transmission electron microscopy revealed electron-dense nanoparticles only in the neuroglia of normal or transgenic mice [B6;DBA-Tg(Fos-tTA, Fos-EGFP*)1MmayTg(tetO-lacZ,tTA*)1Mmay/J] that had been administered AS-gfap or Cy5.5-SPION-gfap. Subtraction R2* maps from mice with acute and chronic amphetamine exposure demonstrated, validated by postmortem immunohistochemistry, a reduction in striatal neuroglia, with gliogenesis in the subventricular zone and the somatosensory cortex in vivo. The sensitivity of our unique gene transcript targeted MRI was illustrated by a positive linear correlation (r(2)=1.0) between in vivo MRI signal changes and GFAP mRNA copy numbers determined by ex vivo quantitative RT-PCR. The study provides direct evidence for targeting neuroglia by antisense DNA-based SPION-gfap that enables in vivo MRI of inaccessible tissue with PCR sensitivity. The results enable us to conclude that amphetamine induces toxicity to neuroglia in vivo, which may cause remodeling or reconnectivity of neuroglia.
Figures
Similar articles
-
Epigenetics of amphetamine-induced sensitization: HDAC5 expression and microRNA in neural remodeling.J Biomed Sci. 2016 Dec 8;23(1):90. doi: 10.1186/s12929-016-0294-8. J Biomed Sci. 2016. PMID: 27931227 Free PMC article.
-
Imaging cerebral gene transcripts in live animals.J Neurosci. 2007 Jan 17;27(3):713-22. doi: 10.1523/JNEUROSCI.4660-06.2007. J Neurosci. 2007. PMID: 17234603 Free PMC article.
-
DNA-based MRI probes for specific detection of chronic exposure to amphetamine in living brains.J Neurosci. 2009 Aug 26;29(34):10663-70. doi: 10.1523/JNEUROSCI.2167-09.2009. J Neurosci. 2009. PMID: 19710318 Free PMC article.
-
Noninvasive delivery of gene targeting probes to live brains for transcription MRI.FASEB J. 2008 Apr;22(4):1193-203. doi: 10.1096/fj.07-9557com. Epub 2007 Nov 20. FASEB J. 2008. PMID: 18029447 Free PMC article.
-
Transcription MRI: a new view of the living brain.Neuroscientist. 2008 Oct;14(5):503-20. doi: 10.1177/1073858407309746. Epub 2007 Nov 16. Neuroscientist. 2008. PMID: 18024855 Review.
Cited by
-
Intracellular gene transcription factor protein-guided MRI by DNA aptamers in vivo.FASEB J. 2014 Jan;28(1):464-73. doi: 10.1096/fj.13-234229. Epub 2013 Oct 10. FASEB J. 2014. PMID: 24115049 Free PMC article.
-
Imaging rhodopsin degeneration in vivo in a new model of ocular ischemia in living mice.FASEB J. 2016 Feb;30(2):612-23. doi: 10.1096/fj.15-280677. Epub 2015 Oct 6. FASEB J. 2016. PMID: 26443823 Free PMC article.
-
Protective effect of melatonin on methamphetamine-induced apoptosis in glioma cell line.Neurotox Res. 2014 Apr;25(3):286-94. doi: 10.1007/s12640-013-9419-y. Epub 2013 Aug 23. Neurotox Res. 2014. PMID: 23975636
-
Noninvasive tracking of gene transcript and neuroprotection after gene therapy.Gene Ther. 2016 Jan;23(1):1-9. doi: 10.1038/gt.2015.81. Epub 2015 Jul 24. Gene Ther. 2016. PMID: 26207935 Free PMC article.
-
Anatomical, functional and molecular biomarker applications of magnetic resonance neuroimaging.Future Neurol. 2015 Jan 1;10(1):49-65. doi: 10.2217/fnl.14.60. Future Neurol. 2015. PMID: 25774094 Free PMC article.
References
-
- Tanibuchi Y., Shimagami M., Fukami G., Sekine Y., Iyo M., Hashimoto K. (2010) A case of methamphetamine use disorder treated with the antibiotic drug minocycline. Gen. Hosp. Psych. 32, 559.e1–559.e3 - PubMed
-
- Kita T., Miyazaki I., Asanuma M., Takeshima M., Wagner G. C. (2009) Dopamine-induced behavioral changes and oxidative stress in methamphetamine-induced neurotoxicity. Int. Rev. Neurobiol. 88, 43–64 - PubMed
-
- Krasnova I. N., Ladenheim B., Cadet J. L. (2005) Amphetamine induces apoptosis of medium spiny striatal projection neurons via the mitochondria-dependent pathway. FASEB J. 19, 851–853 - PubMed
-
- Ladenheim B., Krasnova I. N., Deng X., Oyler J. M., Polettini A., Moran T. H., Huestis M. A., Cadet J. L. (2000) Methamphetamine-induced neurotoxicity is attenuated in transgenic mice with a null mutation for interleukin-6. Mol. Pharmacol. 58, 1247–1256 - PubMed
-
- Bowyer J. F., Ali S. (2006) High doses of methamphetamine that cause disruption of the blood-brain barrier in limbic regions produce extensive neuronal degeneration in mouse hippocampus. Synapse 60, 521–532 - PubMed
Publication types
MeSH terms
Substances
Grants and funding
- DA029889/DA/NIDA NIH HHS/United States
- P30 DK043351/DK/NIDDK NIH HHS/United States
- P30 NS045776/NS/NINDS NIH HHS/United States
- DK43351/DK/NIDDK NIH HHS/United States
- P30 DK057521/DK/NIDDK NIH HHS/United States
- R01 DA029889/DA/NIDA NIH HHS/United States
- AT004974/AT/NCCIH NIH HHS/United States
- DK57521/DK/NIDDK NIH HHS/United States
- R01 EB013768/EB/NIBIB NIH HHS/United States
- NS045776/NS/NINDS NIH HHS/United States
- R01 DA026108/DA/NIDA NIH HHS/United States
- DA026108/DA/NIDA NIH HHS/United States
- EB013768/EB/NIBIB NIH HHS/United States
- R21 AT004974/AT/NCCIH NIH HHS/United States
LinkOut - more resources
Full Text Sources
Research Materials
Miscellaneous
