

Generalized reproduction numbers and the prediction of patterns in waterborne disease
- PMID: 23150538
- PMCID: PMC3511721
- DOI: 10.1073/pnas.1217567109
Generalized reproduction numbers and the prediction of patterns in waterborne disease
Abstract
Understanding, predicting, and controlling outbreaks of waterborne diseases are crucial goals of public health policies, but pose challenging problems because infection patterns are influenced by spatial structure and temporal asynchrony. Although explicit spatial modeling is made possible by widespread data mapping of hydrology, transportation infrastructure, population distribution, and sanitation, the precise condition under which a waterborne disease epidemic can start in a spatially explicit setting is still lacking. Here we show that the requirement that all the local reproduction numbers R0 be larger than unity is neither necessary nor sufficient for outbreaks to occur when local settlements are connected by networks of primary and secondary infection mechanisms. To determine onset conditions, we derive general analytical expressions for a reproduction matrix G0, explicitly accounting for spatial distributions of human settlements and pathogen transmission via hydrological and human mobility networks. At disease onset, a generalized reproduction number Λ0 (the dominant eigenvalue of G0) must be larger than unity. We also show that geographical outbreak patterns in complex environments are linked to the dominant eigenvector and to spectral properties of G0. Tests against data and computations for the 2010 Haiti and 2000 KwaZulu-Natal cholera outbreaks, as well as against computations for metapopulation networks, demonstrate that eigenvectors of G0 provide a synthetic and effective tool for predicting the disease course in space and time. Networked connectivity models, describing the interplay between hydrology, epidemiology, and social behavior sustaining human mobility, thus prove to be key tools for emergency management of waterborne infections.
Conflict of interest statement
The authors declare no conflict of interest.
Figures

 = coefficient of determination for the onset phase = 0.81,
  = coefficient of determination for the whole period = 0.90. (D) Sensitivity to parameter variations of the dominant eigenvalue of G0. The dotted horizontal line indicates the value below which the disease cannot start. (E) Fine-grained spatial distribution as predicted by dominant eigenvector (
 = 0.92,
  = 0.95. (F) Sensitivity to parameter variations of correlations between spatial distribution as predicted by dominant eigenvector and actual spatial distribution of cumulated cases (gray, onset phase; black, whole period). Parameter values and details are in
 (
( ). (E) Cholera cases (as in B). Red (blue) dots indicate communities with more (less) than 10 reported cases during disease onset. (F) Sensitivity to parameter variations of coefficients of determination
  and
and  (defined in Fig. 1). Parameter values and additional details are in
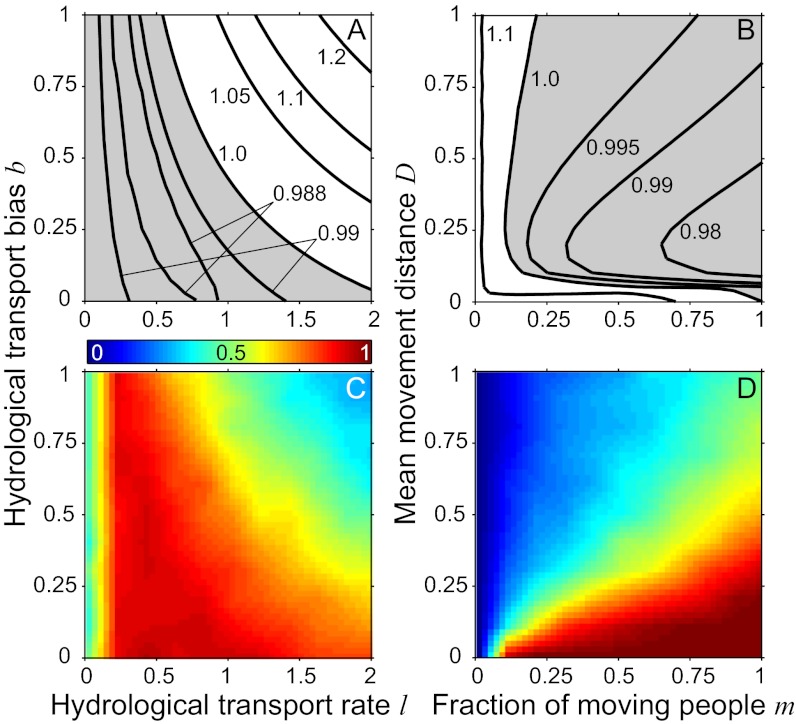
 , whereas subthreshold epidemics (gray shading) can be triggered for combinations lying in between the relevant isolines. (B) Same as A for human mobility parameters. Epidemics can start for combinations lying on the right of the isolines. (C) As in A, with
  and Zipf-like population distribution. Different colors code the fraction of realizations (different population distributions) for which onset conditions are met (
 ,
,  ,
,  ,
,  (A and C),
  (A and C),
  (B and D), and
  (B and D).
References
-
- World Health Organization . The Global Burden of Disease: 2004 Update. Geneva: WHO; 2008.
-
- Bertuzzo E, et al. Prediction of the spatial evolution and effects of control measures for the unfolding Haiti cholera outbreak. Geophys Res Lett. 2011;38:L06403.
-
- Tuite AR, et al. Cholera epidemic in Haiti, 2010: Using a transmission model to explain spatial spread of disease and identify optimal control interventions. Ann Intern Med. 2011;154(9):593–601. - PubMed
Publication types
MeSH terms
Grants and funding
LinkOut - more resources
Full Text Sources
