. 2012 Nov;24(11):4346-59.
doi: 10.1105/tpc.112.104232. Epub 2012 Nov 13.

Regulatory impact of RNA secondary structure across the Arabidopsis transcriptome

Affiliations

Regulatory impact of RNA secondary structure across the Arabidopsis transcriptome

Fan Li et al. Plant Cell. 2012 Nov.

Abstract

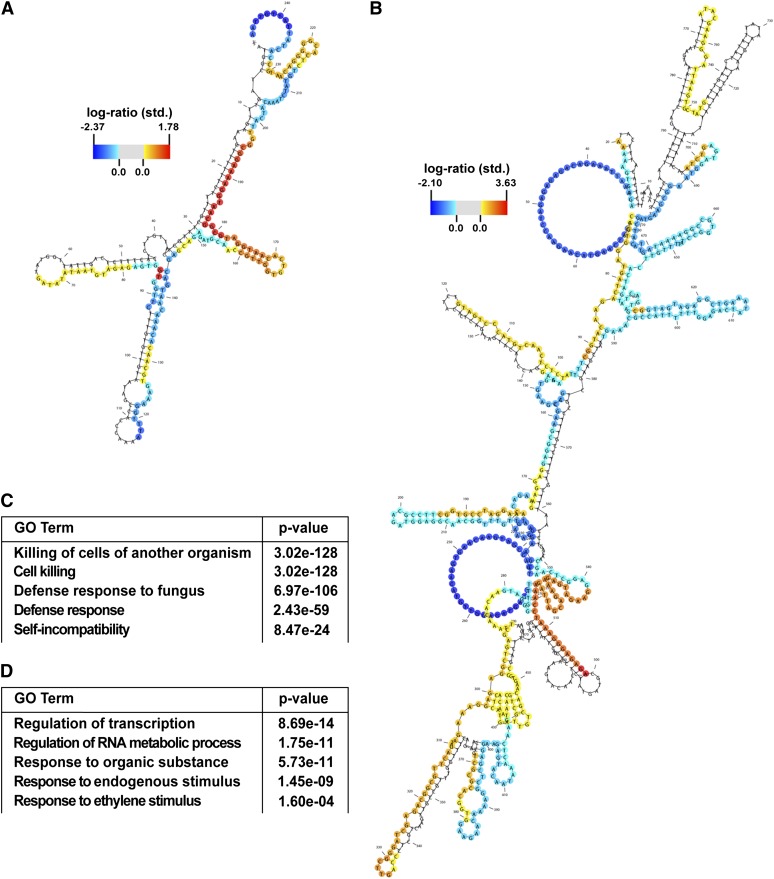
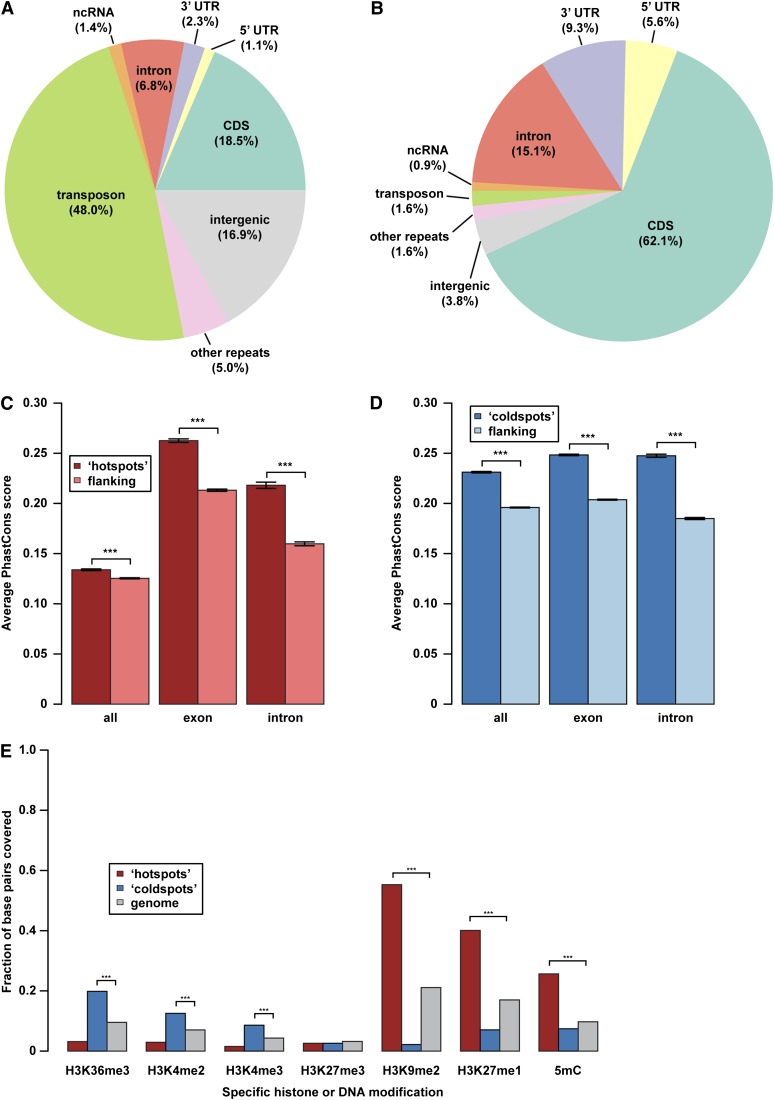
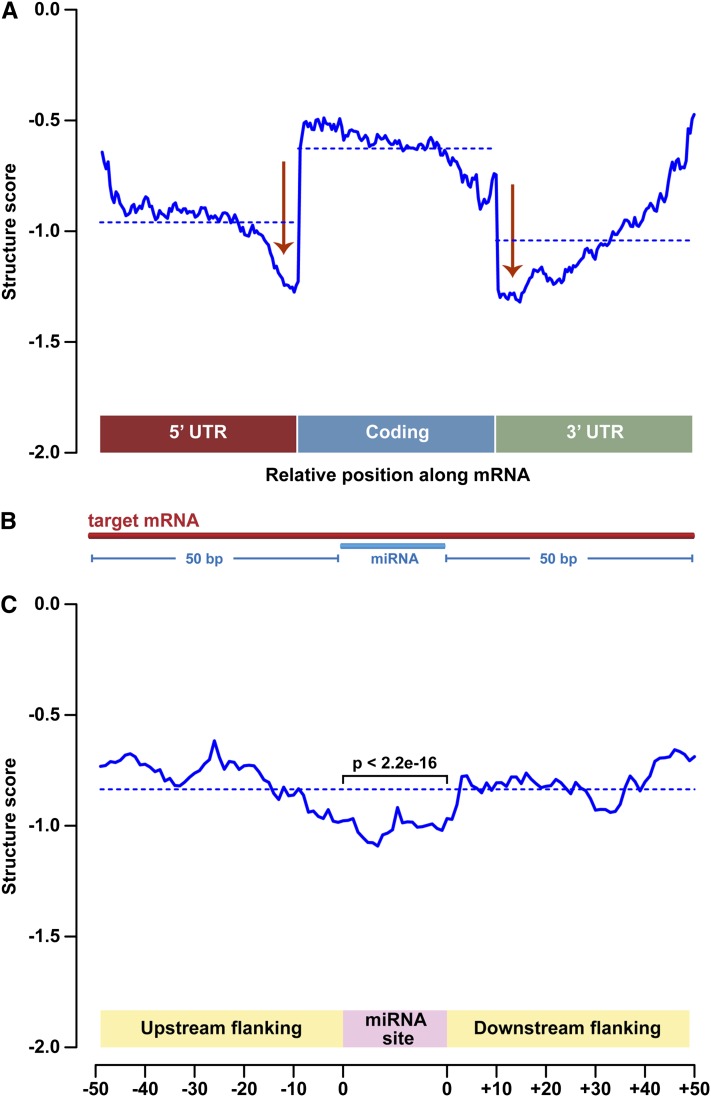
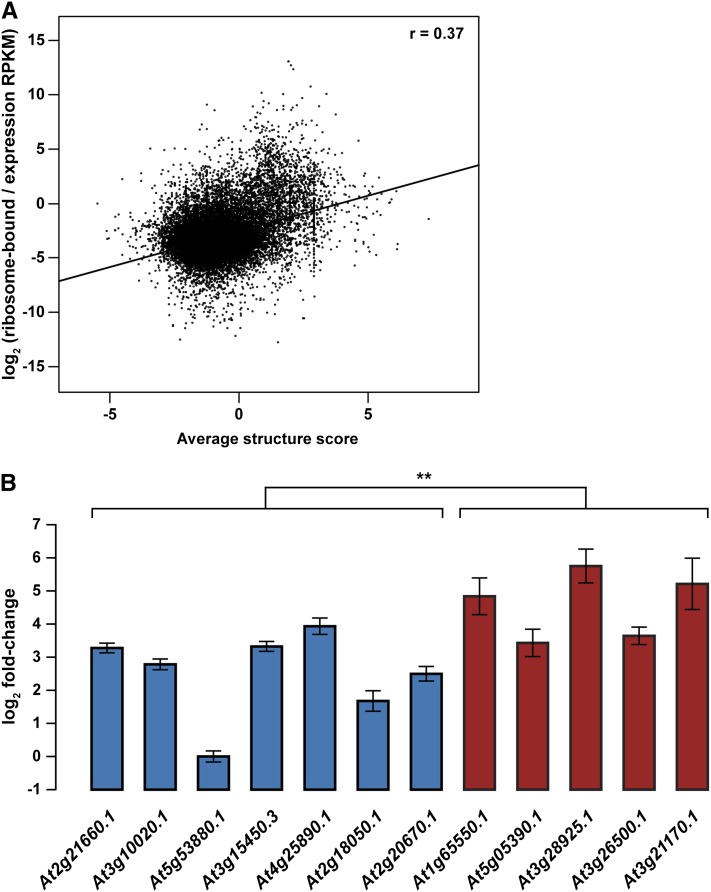
The secondary structure of an RNA molecule plays an integral role in its maturation, regulation, and function. However, the global influence of this feature on plant gene expression is still largely unclear. Here, we use a high-throughput, sequencing-based, structure-mapping approach in conjunction with transcriptome-wide sequencing of rRNA-depleted (RNA sequencing), small RNA, and ribosome-bound RNA populations to investigate the impact of RNA secondary structure on gene expression regulation in Arabidopsis thaliana. From this analysis, we find that highly unpaired and paired RNAs are strongly correlated with euchromatic and heterochromatic epigenetic histone modifications, respectively, providing evidence that secondary structure is necessary for these RNA-mediated posttranscriptional regulatory pathways. Additionally, we uncover key structural patterns across protein-coding transcripts that indicate RNA folding demarcates regions of protein translation and likely affects microRNA-mediated regulation of mRNAs in this model plant. We further reveal that RNA folding is significantly anticorrelated with overall transcript abundance, which is often due to the increased propensity of highly structured mRNAs to be degraded and/or processed into small RNAs. Finally, we find that secondary structure affects mRNA translation, suggesting that this feature regulates plant gene expression at multiple levels. These findings provide a global assessment of RNA folding and its significant regulatory effects in a plant transcriptome.


Figures

Figure 1.
Figure 1.
Experimentally Determined Models of RNA Secondary Structure for the Arabidopsis Transcriptome. (A) and (B) Models of secondary structure for the Arabidopsis At1g33607.1 (highly structured, encodes a DEFL family protein) (A) and HB40 (At4g36740.1) (lowly structured, encodes a HOMEOBOX protein) (B) transcripts determined by our high-throughput sequencing-based, structure-mapping approach. The heat scales indicate the standardized log2 ratio of dsRNA-seq to ssRNA-seq reads (see Methods) at each base position. (C) and (D) The most significantly enriched biological processes (and corresponding P values) for the top 10% most highly (C) and lowly (D) structured Arabidopsis mRNAs. GO, Gene Ontology.
Figure 2.
Figure 2.
Identification and Characterization of Structure Hot Spots and Cold Spots in the Arabidopsis Transcriptome. (A) and (B) Pie charts showing functional classification of structure hot spots (A) and cold spots (B). ncRNA, noncoding RNA. (C) and (D) Conservation scores for structure hot spots (C) or cold spots (D) (dark-red and blue, respectively) versus flanking regions. Higher values indicate more conservation within the seven plant species (see Methods). ***P value → 0. P values were calculated by a t test. (E) The fraction of base pairs within structure hot spots (red), cold spots (blue), and the entire genome (gray) that are marked by specific histone modifications (as indicated in the figure). Values are given as the fraction of all base positions for hot spots, cold spots, or the entire genome (control) that are associated with the given epigenetic mark. ***P value → 0. P values were calculated using a χ2 test.
Figure 3.
Figure 3.
Secondary Structure Marks Translation Initiation and Termination as well as miRNA Target Sites in Arabidopsis mRNAs. (A) The average structure score plotted over the 5′ UTR, CDS, and 3′ UTR of all detectable protein-coding transcripts for Arabidopsis. The overall average for each specific transcript region is shown as a dotted line. Red arrows highlight significant (P value → 0, t test) dips in secondary structure that occur at the junctions between the UTRs and the coding region. (B) Model depicting our analysis of RNA secondary structure at miRNA binding sites in target mRNAs. (C) The average structure score across miRNA binding sites and for 50 bp up- and downstream flanking regions in Arabidopsis target transcripts. The overall structure score average for the entire ∼121-bp region is shown as a dotted line. P value was calculated by a t test.
Figure 4.
Figure 4.
RNA Secondary Structure Regulates the Overall Abundance of Arabidopsis mRNAs. (A) The average structure score (x axis) is plotted against average expression values determined by RNA-seq (y axis) for all detectable Arabidopsis mRNAs. (B) Random hexamer-primed qRT-PCR analysis of seven lowly (blue bars) and five highly (red bars) structured Arabidopsis mRNAs. Error bars, ± se. **P value < 0.001. P value was calculated by a one-tailed t test.
Figure 5.
Figure 5.
RNA Secondary Structure Promotes the Degradation and Processing of Arabidopsis mRNAs into smRNAs. (A) The average structure score (x axis) is plotted against average degradation values determined by correcting degradome (Gregory et al., 2008) values by RNA-seq (y axis) for all detectable Arabidopsis mRNAs. (B) The average structure score (x axis) is plotted against the total abundance of smRNAs present per transcript in the sense orientation as determined by smRNA-seq (y axis) for all detectable Arabidopsis mRNAs. (C) The average structure score (y axis) of mRNA regions processed into smRNAs (left box, smRNA sites) compared with those that are not (right box, other positions). ***P value → 0. P value was calculated by t test.
Figure 6.
Figure 6.
RNA Secondary Structure Regulates the Ribosome Association of Arabidopsis mRNAs. (A) The average structure score (x axis) is plotted against average ribosome association values determined by normalizing ribo-seq values by RNA-seq (y axis) for all detectable Arabidopsis mRNAs. (B) Random hexamer-primed qRT-PCR analysis of seven lowly (blue bars) and five highly (red bars) structured Arabidopsis mRNAs using ribosome-bound RNA fractions with values corrected by total RNA abundance as also measured by qRT-PCR. Error bars indicate ±se. **P value < 0.001. P value was calculated by a one-tailed t test.

References

    1. Addo-Quaye C., Eshoo T.W., Bartel D.P., Axtell M.J. (2008). Endogenous siRNA and miRNA targets identified by sequencing of the Arabidopsis degradome. Curr. Biol. 18: 758–762 - PMC - PubMed
    1. Almeida R., Allshire R.C. (2005). RNA silencing and genome regulation. Trends Cell Biol. 15: 251–258 - PubMed
    1. Bartel D.P. (2004). MicroRNAs: Genomics, biogenesis, mechanism, and function. Cell 116: 281–297 - PubMed
    1. Baulcombe D. (2004). RNA silencing in plants. Nature 431: 356–363 - PubMed
    1. Bernatavichute Y.V., Zhang X., Cokus S., Pellegrini M., Jacobsen S.E. (2008). Genome-wide association of histone H3 lysine nine methylation with CHG DNA methylation in Arabidopsis thaliana. PLoS ONE 3: e3156. - PMC - PubMed

Publication types

Associated data