. 2013 Jan 11;288(2):1340-52.
doi: 10.1074/jbc.M112.415596. Epub 2012 Nov 13.

Altering hydrophobic sequence lengths shows that hydrophobic mismatch controls affinity for ordered lipid domains (rafts) in the multitransmembrane strand protein perfringolysin O

Affiliations

Altering hydrophobic sequence lengths shows that hydrophobic mismatch controls affinity for ordered lipid domains (rafts) in the multitransmembrane strand protein perfringolysin O

Qingqing Lin et al. J Biol Chem. .

Abstract

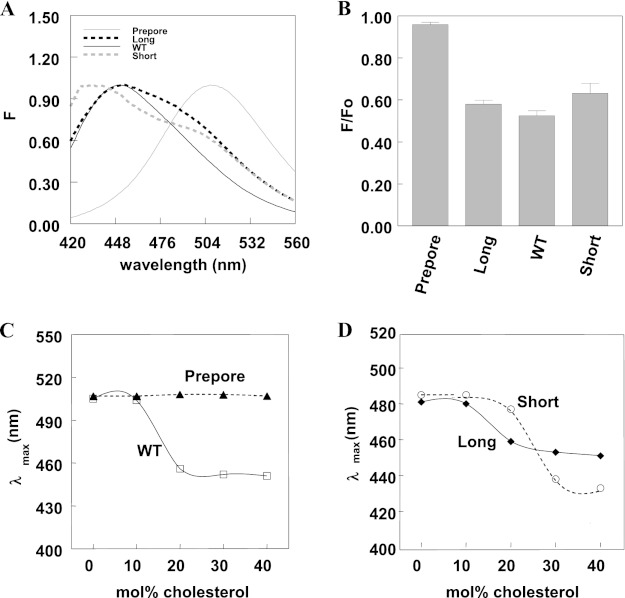
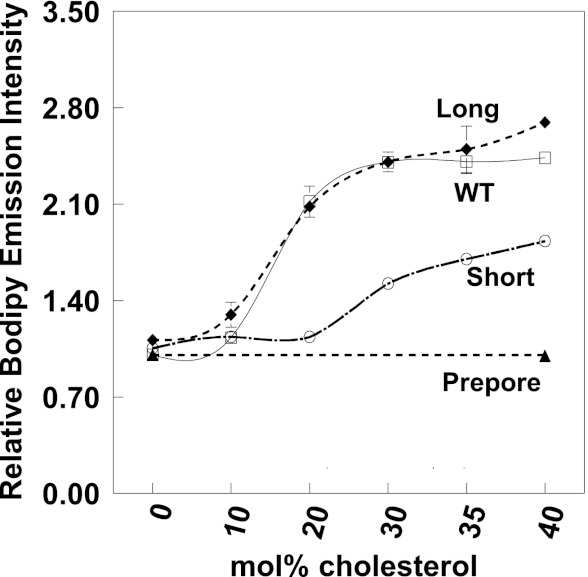
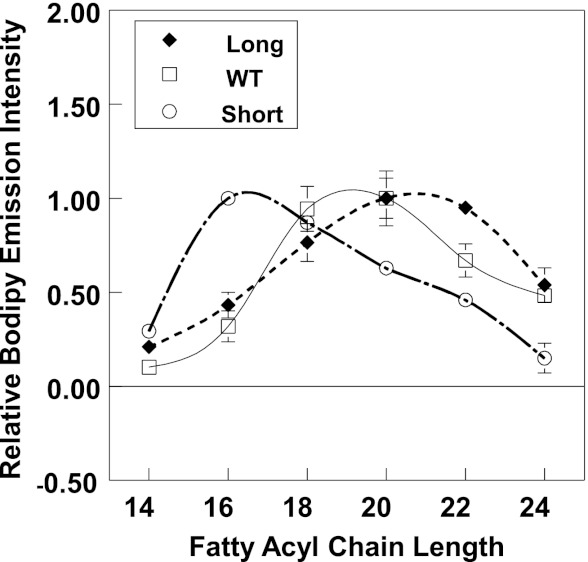
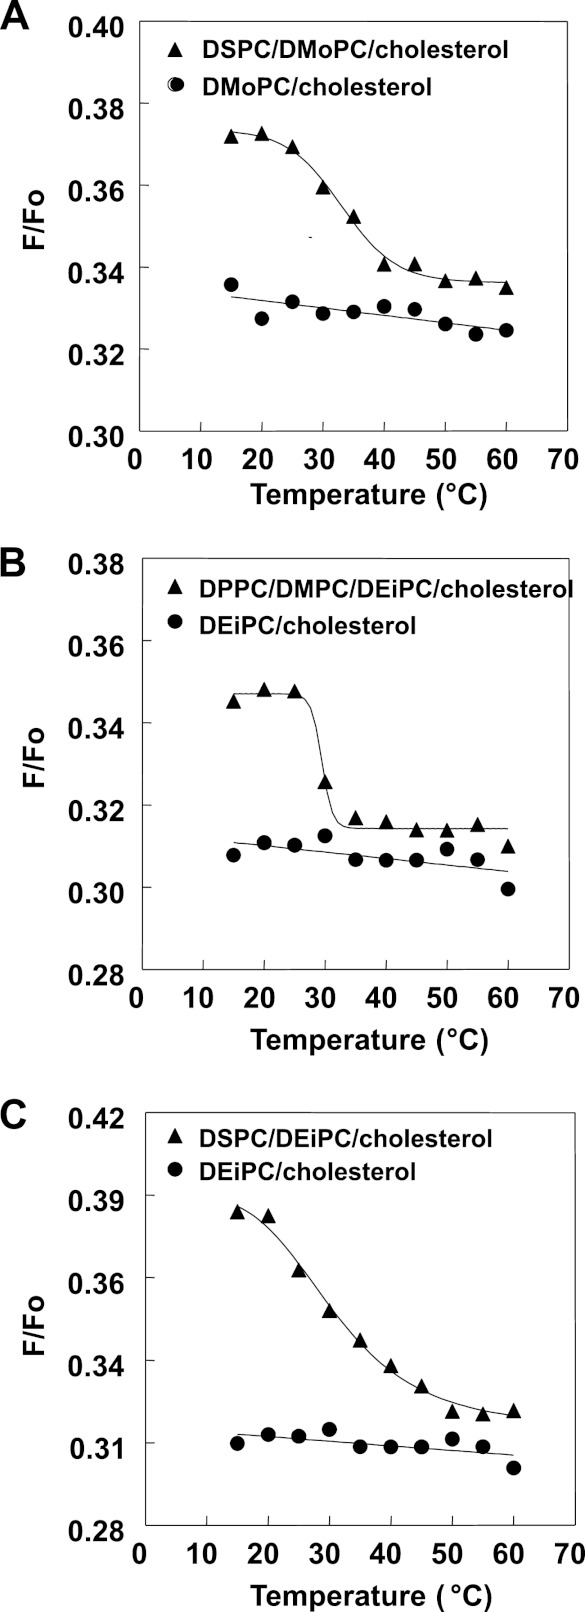
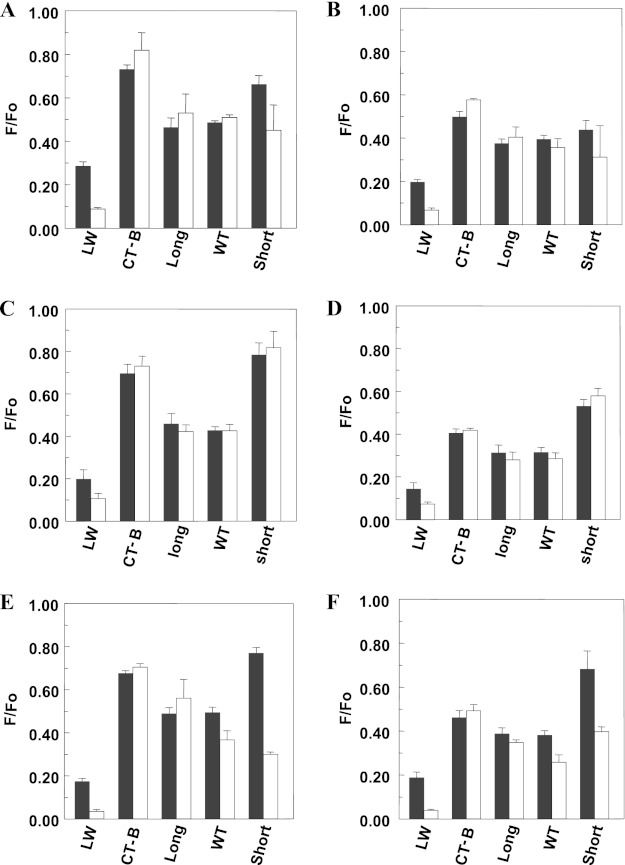
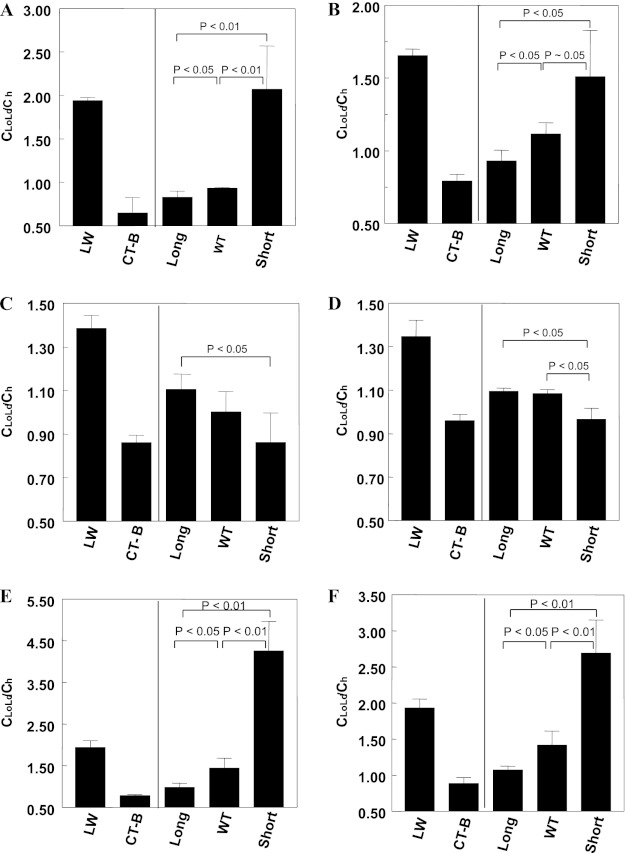
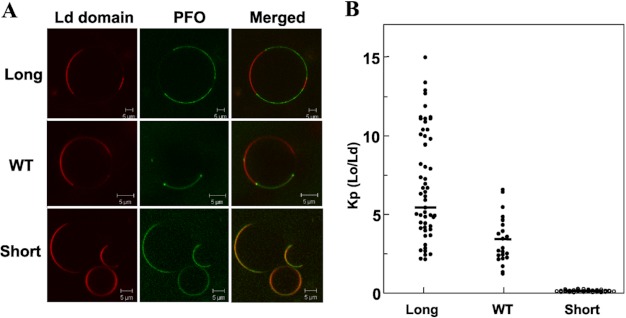
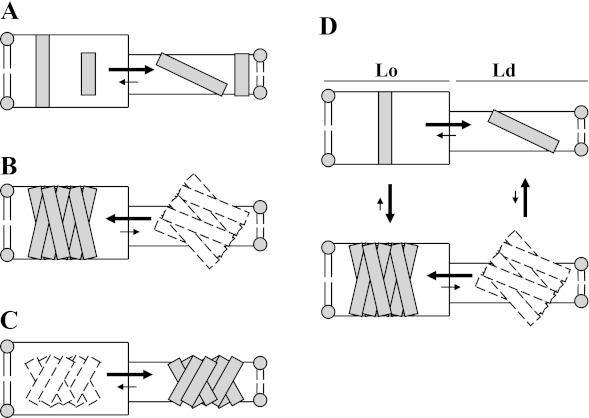
The hypothesis that mismatch between transmembrane (TM) length and bilayer width controls TM protein affinity for ordered lipid domains (rafts) was tested using perfringolysin O (PFO), a pore-forming cholesterol-dependent cytolysin. PFO forms a multimeric barrel with many TM segments. The properties of PFO mutants with lengthened or shortened TM segments were compared with that of PFO with wild type TM sequences. Both mutant and wild type length PFO exhibited cholesterol-dependent membrane insertion. Maximal PFO-induced pore formation occurred in vesicles with wider bilayers for lengthened TM segments and in thinner bilayers for shortened TM segments. In diC(18:0) phosphatidylcholine (PC)/diC(14:1) PC/cholesterol vesicles, which form ordered domains with a relatively thick bilayer and disordered domains with a relatively thin bilayer, affinity for ordered domains was greatest with lengthened TM segments and least with shortened TM segments as judged by FRET. Similar results were observed by microscopy in giant vesicles containing sphingomyelin in place of diC(18:0) PC. In contrast, in diC(16:0) PC/diC(14:0) PC/diC(20:1) PC/cholesterol vesicles, which should form ordered domains with a relatively thin bilayer and disordered domains with a relatively thick bilayer, relative affinity for ordered domains was greatest with shortened TM segments and least with lengthened TM segments. The inability of multi-TM segment proteins (unlike single TM segment proteins) to adapt to mismatch by tilting may explain the sensitivity of raft affinity to mismatch. The difference in width sensitivity for single and multi-TM helix proteins may link raft affinity to multimeric state and thus control the assembly of multimeric TM complexes in rafts.


Figures

FIGURE 1.
FIGURE 1.
Long, WT, and short PFO show cholesterol-dependent deep insertion into vesicles. A, emission spectra of acrylodan-labeled PFO in vesicles containing cholesterol. Samples contained 25 nm prepore; long, WT, or short PFO with acrylodan-labeled cysteine 215; and 6:4 (mol/mol) DOPC/cholesterol vesicles (500 μm total lipid) in PBS, pH 5.1. Solid black line, WT PFO; solid gray line, prepore PFO; dashed black line, long PFO; dashed gray line, short PFO. B, quenching of acrylodan fluorescence by 10-DN. Samples contained 50 nm acrylodan-labeled PFO and 65:35 (mol/mol) DOPC/cholesterol vesicles (500 μm total lipid) in PBS, pH 5.1. F/Fo is the ratio of acrylodan fluorescence at λmax in the presence of vesicles containing 5 mol % 10-DN (F) (replacing 5 mol % DOPC) to that in the presence of vesicles lacking 10-DN (Fo). Average (mean) values and S.D. values (error bars) were obtained from four samples. The F/Fo values in these experiments were uncorrected for incomplete binding to vesicles. C and D, samples contained 25 nm WT (open square), prepore (filled triangle), long (filled diamond), or short (open circle) PFO with acrylodan-labeled cysteine 215 and vesicles composed of DOPC and increasing amounts of cholesterol (500 μm total lipid) in PBS, pH 5.1. All measurements were made at room temperature in this and the following figures unless otherwise noted.
FIGURE 2.
FIGURE 2.
Formation of pores by PFO in LUV is cholesterol-dependent. The y axis shows the extent of increase of external BODIPY-streptavidin fluorescence after the addition of PFO relative to that before the PFO addition. Samples contained LUV composed of DOPC/cholesterol (100 μm total lipid) containing entrapped biocytin and 10 nm externally added BODIPY-tagged streptavidin. BODIPY fluorescence was measured 40 min after the addition of 5 μg/ml WT PFO (open squares), 7 μg/ml long PFO (filled diamonds), 20 μg/ml short PFO (open circles), or 5 μg/ml prepore PFO (filled triangles). Prepore PFO pore formation was only assayed in DOPC and 6:4 (mol/mol) DOPC/cholesterol vesicles. Average (mean) values and S.D. values (error bars) were obtained from four samples. Error bars in this and the following figures are not shown where they were small relative to symbol size.
FIGURE 3.
FIGURE 3.
Hydrophobic mismatch between PFO TM domain and lipid controls PFO pore formation activity. Samples contained LUV composed of 6:4 (mol/mol) PC/cholesterol (100 μm total lipid) with entrapped biocytin. Vesicles were dispersed in PBS, pH 5.1, plus 10 nm BODIPY-tagged streptavidin added externally. BODIPY fluorescence was measured 40 min after the addition of 5 μg/ml WT PFO (open squares), 7 μg/ml long PFO (filled diamonds), or 20 μg/ml short PFO (open circles). Normalized values are shown with maximal release (BODIPY fluorescence) assigned as 1. The x axis shows the acyl chain length (n) of the di-Cn:1 PCs used. Average (mean) values and S.D. values (error bars) were obtained from four samples.
FIGURE 4.
FIGURE 4.
Detection of domain formation by FRET. Samples were composed of MLVs containing 500 μm lipid composed of the following: 55:45 (mol/mol) DMoPC/cholesterol or 27.5:27.5:45 (mol/mol/mol) DSPC/DMoPC/cholesterol (A); 55:45 (mol/mol) DEiPC/cholesterol or 13.75:13.75:27.5:45 (mol/mol/mol/mol) DPPC/DMPC/DEiPC/cholesterol (B); and 55:45 (mol/mol) DEiPC/cholesterol or 27.5:27.5:45 (mol/mol/mol) DSPC/DEiPC/cholesterol (C). Samples were dispersed in PBS, pH 5.1. F samples contained both FRET donor (0.05 mol % pyrene-DPPE) and FRET acceptor (2 mol % Rho-DOPE). Fo samples only contained unlabeled lipids plus FRET donor (0.05 mol % pyrene-DPPE). The ratio of donor fluorescence in the presence of acceptor to that in its absence (F/Fo) is graphed. Average (mean) values were obtained from duplicate samples.
FIGURE 5.
FIGURE 5.
Raw F/Fo values for FRET detection of PFO raft affinity in vesicles containing co-existing Lo/Ld domains. A and B, the F/Fo for LW peptide, CT-B, and PFO in MLVs (500 μm total lipid) composed of 27.5:27.5:45 (mol/mol/mol) DSPC/DEiPC/cholesterol (white bar) or 55:45 (mol/mol) DMoPC/cholesterol (gray bar). C and D, F/Fo for LW peptide, CT-B, and PFO in MLVs (500 μm total lipid) composed of 13.75:13.75:27.5:45 (mol/mol/mol/mol) DPPC/DMPC/DEiPC/cholesterol (white bar) or 55:45 (mol/mol) DEiPC/cholesterol (gray bar). E and F, the F/Fo for LW peptide, CT-B, and PFO in MLVs (500 μm total lipid) composed of 27.5:27.5:45 (mol/mol/mol) DSPC/DEiPC/cholesterol (white bar) or 55:45 (mol/mol) DEiPC/cholesterol (gray bar). Samples were prepared in PBS, pH 5.1. F/Fo is the ratio of fluorescence in the presence of FRET acceptor to that in its absence. A, C, and E, 2 mol % NBD-DPhPE as FRET acceptor. B, D, and F, 1 mol % pyrene-DOPE as FRET acceptor. Average (mean) values and S.D. values (error bars) were obtained from four separate FRET experiments, each having triplicate samples. The F/Fo values shown have been corrected for incomplete binding of PFO to membranes.
FIGURE 6.
FIGURE 6.
FRET-detected raft affinity of PFO with different TM domain length in vesicles containing co-existing Lo and Ld domains. A and B, raft affinity of LW peptide, CT-B, and PFO in membranes composed of 1:1 (mol/mol) DSPC/DMoPC with 45 mol % cholesterol. C and D, raft affinity of LW peptide, CT-B, and PFO in membranes composed of 1:1:2 (mol/mol/mol) DPPC/DMPC/DEiPC with 45 mol % cholesterol. E and F, raft affinity of LW peptide, CT-B, and PFO in membranes composed of 1:1 (mol/mol) DSPC/DEiPC with 45 mol % cholesterol. A, C, and E, 2 mol % NBD-DPhPE as FRET acceptor. B, D, and F, 1 mol % pyrene-DOPE as FRET acceptor. The CLoLd/Ch ratio represents the average local concentration of acceptor around the donor (protein) in vesicles containing Lo and Ld domains (CLoLd) relative to that in a homogeneous bilayer lacking domains (Ch). CLoLd/Ch is high for a protein in Ld domains and low for a protein in Lo domains. Average (mean) values and S.D. values (error bars) were obtained from four separate FRET experiments, each having triplicate samples. The F/Fo values shown have been corrected for incomplete binding of PFO to membranes.
FIGURE 7.
FIGURE 7.
Fluorescence imaging of PFO with different TM domain length binding to GUVs. A, confocal image of the equatorial plane of a typical GUV composed of 1:1 (mol/mol) egg SM/DMoPC with 37 mol % cholesterol after PFO binding. The red channel shows the fluorescence signal originating from the Ld marker Rho-DPPE. The dark portion of the bilayer corresponds to Lo domains. The green channel shows the signal from BODIPY-labeled PFO. B, protein partition coefficient calculated from image intensity analysis for fluorescent PFO (see “Experimental Procedures”) (long PFO, n = 83; WT PFO, n = 33; short PFO, n = 55). K(Lo/Ld) equals the ratio of fluorescence intensity in Lo domains divided by that in Ld domains, not counting protein at domain boundaries. All microscopy experiments were carried out at room temperature. Horizontal bars show mean values. The differences between the long, WT, and short PFO were all significant to the level of p < 0.01.
FIGURE 8.
FIGURE 8.
Schematic illustration of how mismatch and TM protein dimensions affect affinity for domains of different widths and of the linkage between ordered domain affinity and TM protein multimerization. TM segments are shown as individual rectangles. Dashed rectangles indicate TM species unlikely to form to a significant extent. A, partitioning behavior of single short or long TM segments between thick Lo and thin Ld domains. B, partitioning behavior of protein or complex with multiple long TM segments between thick Lo domains and thin Ld domains. C, partitioning behavior of protein or complex with multiple short TM segments between thick Lo domains and thin Ld domains. D, linkage between multimerization and ordered domain affinity for proteins or complexes with long TM segments in membranes with thick Lo domains and thin Ld domains. For simplicity, the figure does not illustrate the likely local distortions in bilayer width adjacent to mismatched protein segments.

References

    1. Simons K., Ikonen E. (1997) Functional rafts in cell membranes. Nature 387, 569–572 - PubMed
    1. Lingwood D., Simons K. (2010) Lipid rafts as a membrane-organizing principle. Science 327, 46–50 - PubMed
    1. Simons K., Toomre D. (2000) Lipid rafts and signal transduction. Nat. Rev. Mol. Cell Biol. 1, 31–39 - PubMed
    1. Brown D. A., London E. (1998) Structure and origin of ordered lipid domains in biological membranes. J. Membr. Biol. 164, 103–114 - PubMed
    1. Phillips R., Ursell T., Wiggins P., Sens P. (2009) Emerging roles for lipids in shaping membrane-protein function. Nature 459, 379–385 - PMC - PubMed

Publication types

LinkOut - more resources