

Equilibrium radionuclide angiocardiography: Its usefulness in current practice and potential future applications
- PMID: 23150766
- PMCID: PMC3495989
- DOI: 10.4329/wjr.v4.i10.421
Equilibrium radionuclide angiocardiography: Its usefulness in current practice and potential future applications
Abstract
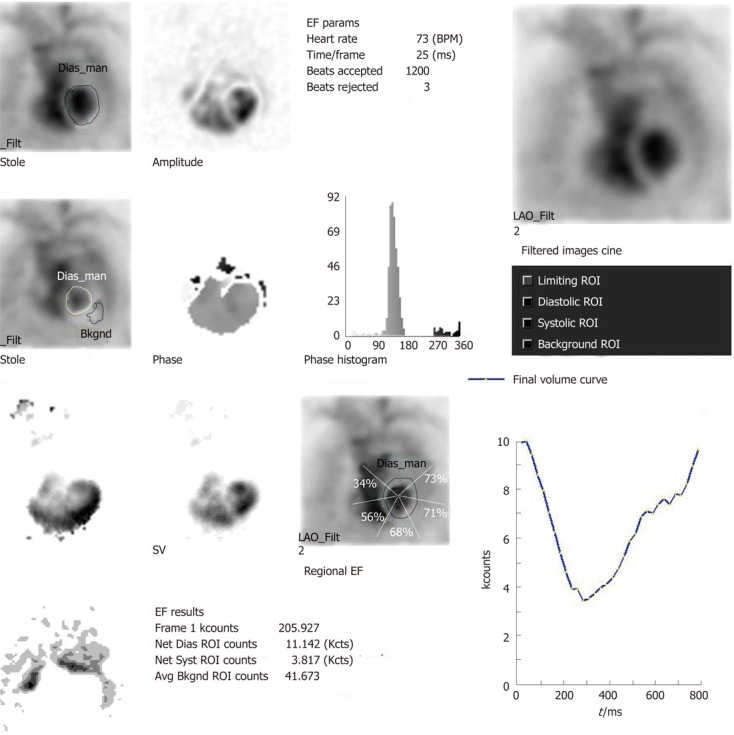
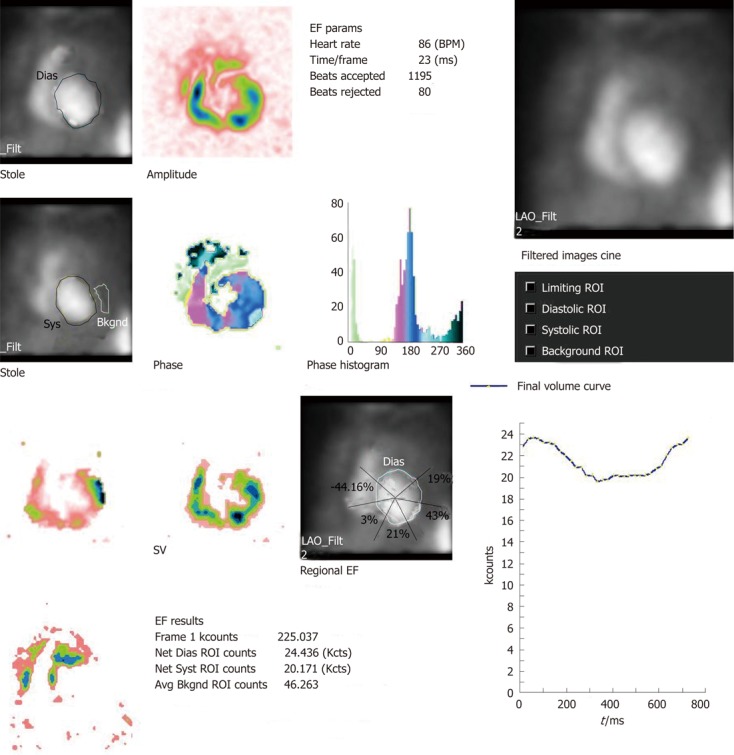
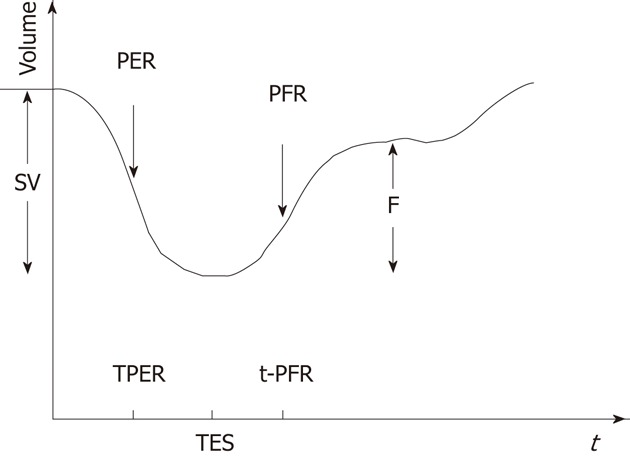
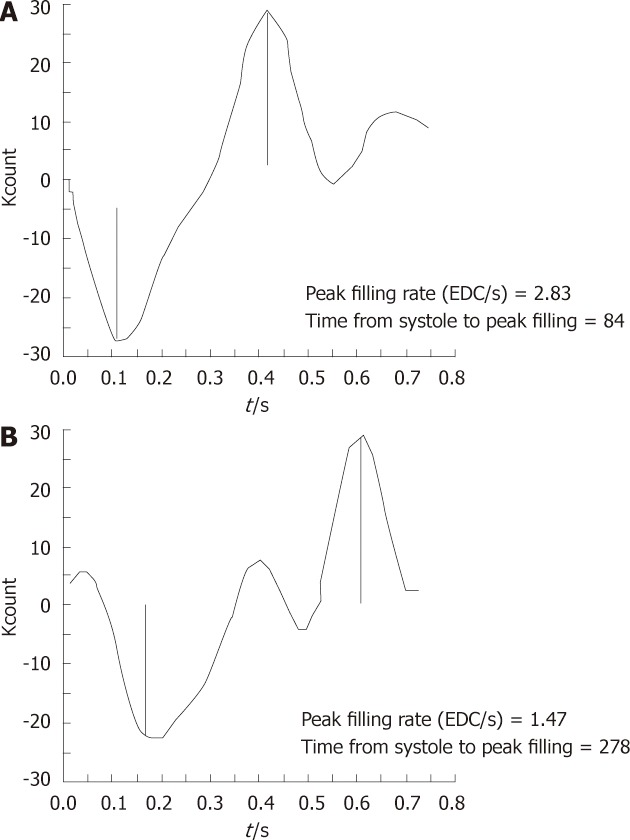
The routine and potential future applications of equilibrium radionuclide angiocardiography/multigated acquisition (MUGA) in clinical decision making are explored in this review. The non-invasive nature of the test, less operator dependence, lower radiation dose and ease of performing, even in ill patients, are important considerations in clinical cardiology practice. Two important routine uses of this modality in day-to-day clinical practice include the following: serial assessment of left ventricular ejection fraction (LVEF) in patients receiving cardiotoxic chemotherapy, and determination of accurate LVEF in patients with intractable heart failure. Other potential utilities of MUGA that could be translated into clinical practice include determination of regional LVEF, obtaining information about both right and left ventricle in suitable patients as a part of first pass angiocardiography, identification of diastolic dysfunction in patients with heart failure with preserved LVEF, and demonstration of dyssynchrony prior to cardiac resynchronisation, specifically by MUGA single photon emission tomography.The last two indications are particularly important and evolving at this point.
Keywords: Angiocardiography; Diastolic parameters; Dyssynchrony; Equilibrium radionuclide; Left ventricular ejection fraction; Multigated acquisition.
Figures
References
-
- van Royen N, Jaffe CC, Krumholz HM, Johnson KM, Lynch PJ, Natale D, Atkinson P, Deman P, Wackers FJ. Comparison and reproducibility of visual echocardiographic and quantitative radionuclide left ventricular ejection fractions. Am J Cardiol. 1996;77:843–850. - PubMed
-
- Nousiainen T, Vanninen E, Jantunen E, Puustinen J, Remes J, Rantala A, Hartikainen J. Comparison of echocardiography and radionuclide ventriculography in the follow-up of left ventricular systolic function in adult lymphoma patients during doxorubicin therapy. J Intern Med. 2001;249:297–303. - PubMed
-
- Corbett JR, Akinboboye OO, Bacharach SL, Borer JS, Botvinick EH, DePuey GE, Ficaro EP, Hansen CL, Henzlova MJ, Van Kriekinge S. ASNC imaging guidelines for nuclear cardiology procedure. Equilibrium radionuclide angiocardiography. USA: Amer Soc Nucl Card; 2008. - PubMed
-
- Murphy P, Port S. Radionuclide evaluation of left ventricular function. In: Sandler M, Coleman R, Patton J, Wackers F, Gottschalk A, et al., editors. Diagnostic Nuclear Medicine, 4th ed. Philadelphia: Lippincott Williams and Winkins; 2003. pp. 239–271.
-
- Gill JB, Moore RH, Tamaki N, Miller DD, Barlai-Kovach M, Yasuda T, Boucher CA, Strauss HW. Multigated blood-pool tomography: new method for the assessment of left ventricular function. J Nucl Med. 1986;27:1916–1924. - PubMed
LinkOut - more resources
Full Text Sources
