. 2012 Nov 15;3(11):e422.
doi: 10.1038/cddis.2012.156.

ZNF143 transcription factor mediates cell survival through upregulation of the GPX1 activity in the mitochondrial respiratory dysfunction

Affiliations

ZNF143 transcription factor mediates cell survival through upregulation of the GPX1 activity in the mitochondrial respiratory dysfunction

W Lu et al. Cell Death Dis. .

Abstract

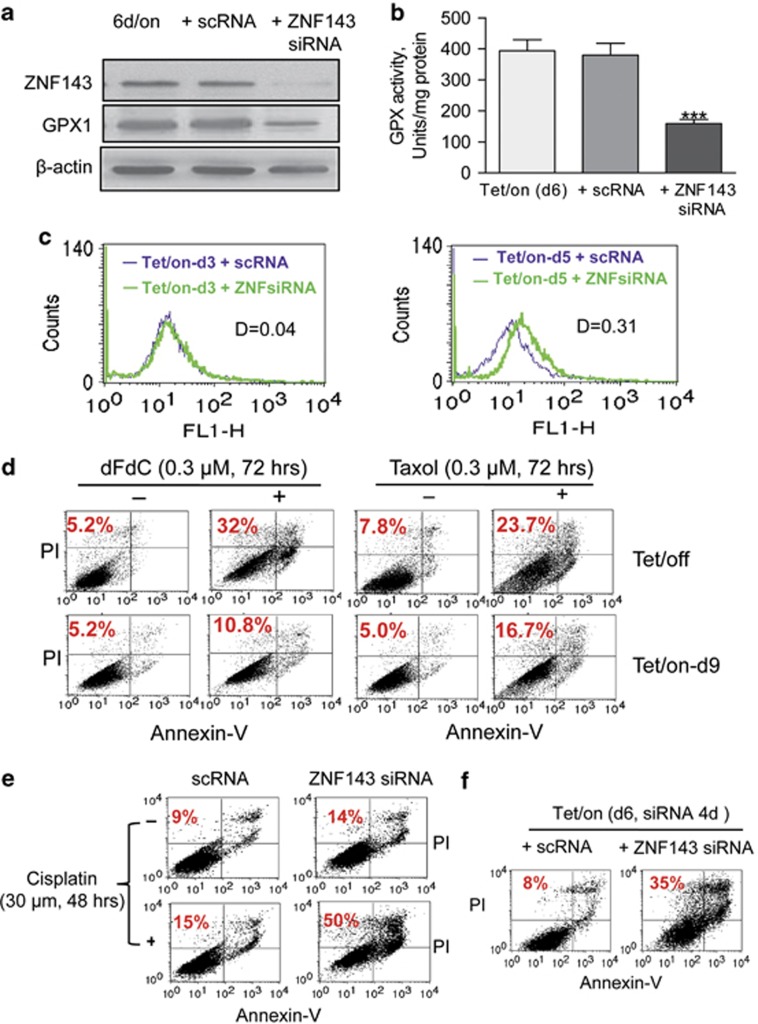
Mitochondrial respiratory dysfunction has intimate relationship with redox regulation. The key mechanism about how the mitochondrial respiration-defective cells survive oxidative stress is still elusive. Here, we report that transcription factor zinc-finger protein 143 (ZNF143) expression and glutathione peroxidase (GPX) activity are markedly increased in the mitochondrial respiratory-defective cells induced by dominant-negative DNA polymerase γ (POLGdn). In this work, investigation of the cellular antioxidant glutathione (GSH) and enzyme GPX activity in the mitochondrial dysfunction revealed the presence of an increased synthesis of GSH through the activation of GCLC (glutamate-cysteine ligase catalytic subunit) and GCLM (glutamate-cysteine ligase regulatory subunit) gene expression, and also a positive upregulation of glutathione peroxidase 1 (GPX1) activity by the transcription factor ZNF143. Significant increase in gene expression of SepSecS, the key enzyme responsible for selenocysteine transfer RNA (tRNA) synthesis, further confirmed the activation of the selenocysteine synthesis pathway. By using both GPX1 and ZNF143 knockdown, we provided insight into the involvement of ZNF143 in promoting GPX1 activity and protecting cells from oxidative damage and cisplatin treatment in the mitochondrial dysfunction. Furthermore, we reported the possible regulation of mitochondrial transcription factor A (TFAM) in the mitochondrial dysfunction. Our findings delineate an important antioxidant survival pathway that allows the mitochondrial-defective cells to survive oxidative stress and cisplatin treatment.


Figures

Figure 1
Figure 1
POLGdn expression led to impaired mitochondrial respiration and ROS generation. (a) ATPase 6 mRNA level decreased in a time-dependent manner after doxycycline-induced POLGdn gene expression. Real-time qRT-PCR was used to measure mRNA level of ATPase 6 and β-actin served as control (n=3). Values are shown as mean±S.D.; ***P<0.001. (b) ND1 mRNA level decreased in a time-dependent manner after doxycycline-induced POLGdn gene expression. Real-time qRT-PCR was used to measure mRNA level of ND1 and β-actin served as control (n=3). Values are shown as mean±S.D.; ***P<0.001. (c) Time-dependent reduction of oxygen consumption rate following POLGdn expression. Tet/off cells were used as control (n=3). Values are shown as mean±S.D.; ***P<0.001. (Inset) Time-dependent decrease of mtDNA-encoded COII protein following POLGdn expression. COII protein level was assessed by western blot assay. β-Actin was probed as a loading control. (d) Cellular ROS levels were significantly increased after profound mitochondrial respiration damage. Cellular H2O2 was measured by flow cytometry using 4 μm DCF-DA as a fluorescent dye
Figure 2
Figure 2
Changes in cellular GSH content and the expression of the genes responsible for GSH synthesis. (a) Comparison of cellular glutathione contents in Tet/off and Tet/on cells at the indicated time points using a GSH assay kit from Cayman Chemical Co. (n=3). Values are shown as mean±S.D.; ***P<0.001. (b) Real-time qRT-PCR analysis of GCLC in Tet/off and Tet/on cells at the indicated time point. β-Actin was used as the sample control (n=3). Values are shown as mean±S.D.; *P<0.05; **P<0.01, ***P<0.001. (c) Real-time qRT-PCR analysis of GCLM in Tet/off and Tet/on cells at the indicated time points. β-Actin was used as the sample control (n=3). Values are shown as mean±S.D.; *P<0.05. (d) Real-time qRT-PCR analysis of GSS in Tet/off and Tet/on cells at the indicated time points. β-Actin was used as the sample control (n=3). Values are shown as mean±S.D. No significant difference of GSS was found between the control and the POLGdn-expressing samples. (e) GCLC and GCLM protein level assessed by western blotting was increased after POLGdn expression. β-Actin was used as a loading control. Scanning and ImageJ software (a public domain Java image processing program developed at the National Institutes of Health) was used for the quantification of western blot results. Results are expressed as integrated optical density. Each sample was normalized to β-actin content
Figure 3
Figure 3
GPX activity and GPX1 protein level were constantly increased in the mitochondrial respiratory dysfunction induced by POLGdn expression. (a) Intracellular GPX activity increased within the duration of POLGdn induction. Intracellular GPX activity was expressed as units/mg protein. Data correspond to means±S.D. from at least three independent determinations of GPX. **P<0.01; ***P<0.001. (b) GPX1 mRNA level was unchanged within the indicated duration of POLGdn induction. Real-time qRT-PCR analysis was used to assess GPX1 gene expression. β-Actin was used as the sample control (n=3). Values are shown as mean±S.D. No significant change in gene expression was observed. (c) Time-dependent increase in the protein level of GPX1 following POLGdn expression. Left panels show representative GPX1 protein level with POLGdn induction assessed by western blotting. β-Actin was probed as a loading control. Right panels show quantification of western blot results using scanning and ImageJ software. Results are expressed as integrated optical density. Each sample was normalized to β-actin content. Each bar represents the mean±S.E.M. of three independent experiments. *P<0.05; **P<0.01; ***P<0.001. (d) Catalase protein level was unaltered within the indicated duration of POLGdn induction. Left panels show representative catalase protein levels assessed by western blotting. β-Actin was probed as a loading control. Right panels show quantification of western blot results using scanning and ImageJ software. Results are expressed as integrated optical density. Each sample was normalized to β-actin content. Each bar represents the mean±S.E.M. of three independent experiments. No significant change was observed
Figure 4
Figure 4
ZNF143 gene expression and protein level were significantly increased in the cells with mitochondrial respiratory dysfunction. (a) ZNF143 mRNA level, as determined by real-time qRT-PCR, was significantly increased after POLGdn induction by doxycycline. β-Actin was used as the sample control (n=3). Values are shown as mean±S.D.; **P<0.01; ***P<0.001. (b) ZNF143 protein level detected by western blot was increased upon POLGdn expression at indicated time points. β-Actin was probed as a loading control. Upper panels show representative ZNF143 protein levels assessed by western blot. Lower panels show quantification of western blot results using scanning and ImageJ software. Results are expressed as integrated optical density. Each sample was normalized to β-actin content. Each bar represents the mean±S.E.M. of three independent experiments. *P<0.05; ***P<0.001. (c) SepSecS gene expression, as determined by qRT-PCR, was significantly increased after 3 days of POLGdn induction by doxycycline. β-Actin was used as the sample control (n=3). Values are shown as mean±S.D.; **P<0.01; ***P<0.001. (d) tRNASec expression, as determined by qRT-PCR, was significantly increased after 3 days of POLGdn induction. β-Actin was used as the sample control (n=3). Values are shown as mean±S.D.; **P<0.01; ***P<0.001. (e) Western blot analysis of ZNF143 protein level in Tet/off cells were treated with mitochondrial respiratory chain inhibition agents, rotenone (100 nM), antimycin (5 μM) or sodium azide (500 μM), for 24 h, respectively. β-Actin was probed as a loading control. ZNF143 fold change was quantified by scanning and ImageJ software. Results are expressed as integrated optical density. Each sample was normalized to β-actin content. (f) ZNF143 and GPX1 protein levels were increased in mitochondrial respiration-defective p° cells. Left panels show representative ZNF143 and GPX1 protein levels in mitochondrial respiration-defective p° (C6F) cells as compared with their parental HL60 cells using western blot assay. β-Actin was probed as a loading control. Right panels show quantification of western blot results using scanning and ImageJ software. Results are expressed as integrated optical density. Each sample was normalized to β-actin content. Each bar represents the mean±S.E.M. of three independent experiments. *P<0.05; **P<0.01
Figure 5
Figure 5
ZNF143 protein level increase is important for the increase of GPX1 activity in the mitochondrial-defective cells to survive oxidative stress. (a) GPX1 protein level was decreased after ZNF143 siRNA knockdown on day 6 of Tet/on cells. At 2 days after POLGdn expression, cells were transiently transfected with nonspecific scramble siRNA (scRNA) or ZNF143 siRNA for 4 days in a doxycycline medium. Western blotting was conducted to confirm ZNF143 knockdown. β-Actin served as a loading control. (b) GPX activity significantly decreased after ZNF143 gene knockdown. Tet/on day 6 cells or Tet/on day 6 cells with scRNA transcient transfection were used as control (n=3). Values are shown as mean±S.D.; ***P<0.001. (c) ZNF143 gene knockdown at day 3 of Tet/on cells (1 day after ZNF143 siRNA transfection) has same H2O2 level as its counterpart with scRNA knockdown (left). ZNF143 gene knockdown at day 5 of Tet/on cells (3 days after ZNF143 siRNA transfection) has higher H2O2 level than its counterpart with scRNA knockdown (right). DCF-DA was used as a probe and detected by flow cytometry. (d) Comparison of drug sensitivity in Tet/off and Tet/on day 9 cells. Cells were incubated with the indicated concentrations of gemcitabine (dFdC) and taxol for 72 h, and cell death was analyzed by flow cytometry after double staining with Annexin V and PI. (e) Tet/on cells with ZNF143 knockdown were sensitive to cisplatin treatment. Tet/on day 6 cells were transfected with ZNF143 siRNA or scramble siRNA (scRNA) for 24 h followed by treatment with cisplatin at the indicated concentration for 48 h. Cell death was measured by flow cytometry after double staining with Annexin V and PI. (f) ZNF143 gene knockdown caused massive cell death on day 6 of Tet/on cells (4 days after ZNF143 siRNA transfection) when compared with its counterpart with scRNA knockdown. Cell death was detected by Annexin V/PI double stain and detected by flow cytometry
Figure 6
Figure 6
GPX1 is the major factor contributing to GPX activity for the survival of cells in mitochondrial respiratory dysfunction. (a) Cells with GPX1 stable knockdown by shRNA plasmid (GPX1-shRNA) showed no detectable GPX1 protein even with POLGdn induction, wheraas cells with scrambled plasmid knockdown (sc-shRNA) showed increased GPX1 protein level upon POLGdn expression. COII protein level was used as an indicator of effective POLGdn induction and β-actin was probed as a loading control. (b) GPX1 knockdown (GPX1-shRNA) significantly decreased cellular GPX activity in Tet/off cells and activity increase was not observed after POLGdn induction, whereas scramble knockdown (NS-shRNA) cells showed increased GPX activity in a time-dependent manner with POLGdn induction. Data correspond to means±S.D. from at least three independent determinations of GPX. ***P<0.001. (c) Tet/on cells with GPX1 knockdown were sensitive to cisplatin treatment. After 7 days of Tet/on, cells with NS-shRNA or GPX1-shRNA were treated with indicated concentration of cisplatin for 48 h. Cell death was measured by flow cytometry after double staining with Annexin V and PI. (d) GPX1 knockdown by its specific shRNA plasmid showed substantial increase in cell death by day 12 of Tet/on as detected by Annexin V/PI double staining. Cells with scrambled plasmid knockdown (sc-shRNA) served as control
Figure 7
Figure 7
ZNF143 expression could not protect TFAM from degradation in mitochondrial dysfunction. (a) Increased ZNF143 expression did not upregulate mRNA expression of TFAM as measured by qRT-PCR. TFAM gene expression did not change even after 6 days of POLGdn induction. TFAM transcriptional regulators, such as NRF-1, PGC-1α and PRC gene expression, did not have significant alteration after mitochondrial dysfunction. β-Actin was used as internal control. Data are shown as mean±S.D. of triplicate samples from three independent experiments. (b) Disappearance of TFAM protein following inhibition of mtDNA synthesis by POLGdn expression as determined by western blot assay. β-Actin was probed as a loading control. (c) Dramatic decrease of TFAM protein following inhibition of mtDNA synthesis by 0.2 μM ddC as determined by western blot assay. β-Actin was probed as a loading control. (d) Suppression of TFAM protein degradation by the proteasome inhibitor MG132, but not by pancaspase inhibitor Z-VAD. After doxycycline-induced POLGdn expression for 24 h, cells were treated with the indicated inhibitors for additional 24 h. Protein lysates were subject to western blot analysis for TFAM protein and β-actin was probed as a loading control
Figure 8
Figure 8
Schematic illustration of ZNF143 function in mitochondrial dysfunction. Disruption of mitochondrial respiration by either genetic or pharmacological approaches led to the prompt increase in the function of transcription factor ZNF143. By increasing the expression of tRNASec, elevated ZNF143 upregulates GPX activity. Increased GPX activity is orchestrated via increased cellular glutathione synthesis by transcriptional upregulation of glutathione synthesis enzyme GCLC and GCLM, which together serve as antioxidants in the defense against the cellular oxidative stress and resistant to cisplatin treatment in the mitochondrial respiratory dysfunction

Similar articles

Cited by

References

    1. Petros JA, Baumann AK, Ruiz-Pesini E, Amin MB, Sun CQ, Hall J, et al. mtDNA mutations increase tumorigenicity in prostate cancer. Proc Natl Acad Sci USA. 2005;102:719–724. - PMC - PubMed
    1. DeNicola GM, Karreth FA, Humpton TJ, Gopinathan A, Wei C, Frese K, et al. Oncogene-induced Nrf2 transcription promotes ROS detoxification and tumorigenesis. Nature. 2011;475:106–109. - PMC - PubMed
    1. Townsend DM, Tew KD, Tapiero H. The importance of glutathione in human disease. Biomed Pharmacother. 2003;57:145–155. - PMC - PubMed
    1. Shen Q, Chu FF, Newburger PE. Sequences in the 3′-untranslated region of the human cellular glutathione peroxidase gene are necessary and sufficient for selenocysteine incorporation at the UGA codon. J Biol Chem. 1993;268:11463–11469. - PubMed
    1. Lubos E, Loscalzo J, Handy DE. Glutathione peroxidase-1 in health and disease: from molecular mechanisms to therapeutic opportunities. Antioxid Redox Signal. 2011;15:1957–1997. - PMC - PubMed

Publication types