. 2012 Nov 15;3(11):e423.
doi: 10.1038/cddis.2012.160.

miR-204 targets Bcl-2 expression and enhances responsiveness of gastric cancer

Affiliations

miR-204 targets Bcl-2 expression and enhances responsiveness of gastric cancer

A Sacconi et al. Cell Death Dis. .

Abstract

Micro RNAs (miRs) are small non-coding RNAs aberrantly expressed in human tumors. Here, we aim to identify miRs whose deregulated expression leads to the activation of oncogenic pathways in human gastric cancers (GCs). Thirty nine out of 123 tumoral and matched uninvolved peritumoral gastric specimens from three independent European subsets of patients were analyzed for the expression of 851 human miRs using Agilent Platform. The remaining 84 samples were used to validate miRs differentially expressed between tumoral and matched peritumoral specimens by qPCR. miR-204 falls into a group of eight miRs differentially expressed between tumoral and peritumoral samples. Downregulation of miR-204 has prognostic value and correlates with increased staining of Bcl-2 protein in tumoral specimens. Ectopic expression of miR-204 inhibited colony forming ability, migration and tumor engraftment of GC cells. miR-204 targeted Bcl-2 messenger RNA and increased responsiveness of GC cells to 5-fluorouracil and oxaliplatin treatment. Ectopic expression of Bcl-2 protein counteracted miR-204 pro-apoptotic activity in response to 5-fluorouracil. Altogether, these findings suggest that modulation of aberrant expression of miR-204, which in turn releases oncogenic Bcl-2 protein activity might hold promise for preventive and therapeutic strategies of GC.


Figures

Figure 1
Figure 1
Signature of the best eight common miRNAs differentiate tumor and peritumor samples in GC. Unsupervised hierarchical clustering on selected miRs signature separately for the two subset of patients. (a and b) Red points represent signals with higher intensity while green points indicate signals with lower intensity level in RENCI cohort of samples (a) and SVH cohort of samples (b). Clustering basing on Euclidean distance is performed for each miRs (rows) and for each samples (columns). (c) Supervised statistical test was used to determinate significance level of the difference between signal distributions of the 39 samples. (d) Unsupervised PCA confirmed the ability of the signature to separate groups of tumoral samples from peritumoral samples. First component represents inter-group variability (axis x) while on the second component is plotted the intra-group variability (axis y)
Figure 2
Figure 2
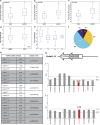
miR-204 expression correlates with tumor stage (T) data. Expression level of miR-204 in 64 RENCI paired samples, (b) in 16 SVH paired samples and (c) in 12 patients from a third independent cohort of samples SAH (S. Andrea Hospital). (d) Fold change between tumoral and peritumoral tissue on miR-204 were calculated for 111 samples (RENCI and SVH subset of patients). Fold change boxplot distribution of samples processed using different techniques and collected from different institutes indicates a similar distribution of the miR after normalization. (e) Boxplot of the comparison of T1 tumor stage versus T2, T3, T4 stage using fold change level of miR-204 signal. (f) Pie chart of tumor stage distribution of 103 known T-values (RENCI and SVH). (g) Schematic representation of the miR-204 and its host gene TRPM3. (h) Table which compares TRPM3 gene status quantitatively evaluated by multiplex ligation-dependent probe amplification with miR-204 downregulation in 10 primary GC and in the normal-matched peritumoral tissues. (i–l) Multiplex ligation-dependent probe amplification exemplificative histograms showing the heterozygous deletion of TRPM3 gene in a gastric carcinoma as compared with the matched normal peritumoral tissue (TRPM3 gene ratio in the tumor 0.47 versus 1.12 in the normal peritumoral tissue)
Figure 3
Figure 3
miR-204 overexpression affects cell migration, colony forming ability and chemoresistance. (a) Colony assay of GTL-16 cells stably transfected with pCMV-MIR-204 (miR-204) and pCMV-MIR vector (EV). An average of three independent experiments is reported. Error bars represent mean±S.D. (b) Wound healing assay shows that miR-204 inhibits cell migration in GTL-16 cells. Quantity of migrated cells presents an average from three experiments independently. (c) Tumor volumes measured at day 28 after the first injection. The central bold lines denote mean values, the vertical lines±S.E.M. (n=6 mice in each group) and the circles data points. P-values was calculated by 2-samples t-test and indicated in the figure. (d) Images of three representative tumors from mice bearing GTL-16 stable expressing miR-204 or empty vector. (e) Left: positive immunohistochemical staining of paraffin-embedded xenografts indicates cellular proliferation of GTL-16 stable cells. miR-204 overexpressing cells show a reduced proliferation rate compared with EV. Three sections of each of the six tumors per group have been scored. ( × 400, counterstained with hematoxylin). Right: histogram shows the percentage of positive cells from 6 tumors/group. The difference between GTL-16 miR-204 and GTL-16 EV xenograft's proliferation rate is statistically significant (P=0.0002). (f–h) Colony formation assay of GTL-16 stable cells overexpressing miR-204 or the empty vector treated at decreasing concentrations of 5-fluorouracil (5-FU) or oxaliplatin (OXA) drugs. Histogram showing the average colony counts from 5-FU=6 μM, OXA=1 μg/ml (f), 5-FU=3 μM, OXA=500 ng/ml (g), 5-FU=2 mM, OXA=250 ng/ml (h). An average of three independent experiments is reported
Figure 4
Figure 4
miR-204 downregulates the expression of Bcl-2 protein. (a) Venn-diagramm displays 13 common pathway shared by TargetScan and Pictar. (b) Table of 13 common pathway and common targets according to TargetScan and Pictar programms. (c) Immunohistochemistry of Bcl-2 protein in representative tissue samples: a representative case of Bcl-2-negative gastric carcinoma (I), a representative case of Bcl-2-positive gastric carcinoma displays a cytoplasmic immunostaining in more than 50% of tumor cells (II), the correspondent autologous morphologically uninvolved peritumoral tissue is consistently bcl-2 negative, the internal control of infiltrating lymphocytes are positive (III). Scale bar 30 μm. (d) Percentage of Bcl-2-positive samples plotted against miR-204 fold downregulation comparing tumoral versus peritumoral samples. In x axis, it is represented the miR-204 fold downregulation, while in y axis the percentage of Bcl-2-positive samples. (e) Expression vectors carrying a luciferase reporter followed by the first 541 bp of 3′-UTR regions of Bcl-2 in their wild-type form (black bars) or mutated in the miR-204 complementary sequence (gray bars), were transfected in H1299 cells in the presence of pCMV-miR-204 or pCMV-EV. Normalized luciferase activity values from three independent experiments in triplicate are shown. (f) Immunoblotting of Bcl-2 protein in N87 cell line stably transfected either with pCMV-MIR vector (EV) or pCMV-miR-204 (miR-204). (g) Immunoblotting of Bcl-2 protein in GTL-16 cell line stably transfected either with pCMV-MIR vector (EV) or pCMV-miR-204 (miR-204). (h) Immunoblotting of Bcl-2 protein in HEK293 cells transfected with either pCMV-miR-204 or pCMV-EV and pCDNA3-Bcl-2 plasmid. (i) GTL-16 gastric cells stably expressing either miR204 or the EV and transiently transfected with Bcl-2 and the EV were stained with Annexin V. Apoptosis was determined using flow cytometry as described in Materials and Methods. The values obtained from Annexin V assays represent the means±S.D. for three independent experiments. *P=0.0008; **P=0.03. (l) 293T cells were cotransfected with miR204 and Bcl-2 and their corresponding EV, and treated with 5-fluorouracil (3 μM). Twenty-four hours after treatment, apoptosis was determined by staining with Annexin V. Histograms report the means±S.D. for three independent experiments. *P<0.005
Figure 5
Figure 5
(a) Kaplan–Meier survival curves of patients at stage T1–T2 versus patients at stage T3–T4. (b) Kaplan–Meier survival curves of subgroups of patients with miR-204-fold higher and lower than 0.5. (c) Kaplan–Meier survival curves of patients with Bcl-2 status positive versus negative. In all analysis the differences between estimated curves are evaluated by log-rank test. (d) Pie charts miR-204 fold distribution of 103 patients with defined T status. The distributions are calculated considering subgroups of patients at stage T1 and stage T2–T3–T4. (e) Pie charts of Bcl-2 distribution of 79 patients with defined Bcl-2 status. The distributions are calculated considering subgroups of patients with miR-204 fold higher and lower 0.5. (f) Pie charts of Bcl-2 distribution of 79 patients with defined Bcl-2 status. The distributions are calculated considering subgroups of patients at stage T1–T2 and stage T3–T4

Similar articles

Cited by

References

    1. Jemal A, Bray F, Center MM, Ferlay J, Ward E, Forman D. Global cancer statistics. CA Cancer J Clin. 2011;61:69–90. - PubMed
    1. Lee JH, Kim KM, Cheong JH, Noh SH. Current management and future strategies of gastric cancer. Yonsei Med J. 2012;53:248–257. - PMC - PubMed
    1. Bartel DP. MicroRNAs: genomics, biogenesis, mechanism, and function. Cell. 2004;116:281–297. - PubMed
    1. Calin GA, Croce CM. MicroRNA signatures in human cancers. Nat Rev Cancer. 2006;6:857–866. - PubMed
    1. Croce CM. Causes and consequences of microRNA dysregulation in cancer. Nat Rev Genet. 2009;10:704–714. - PMC - PubMed

Publication types