. 2012 Nov 15;3(11):e424.
doi: 10.1038/cddis.2012.162.

Apoptosis and necrosis: two different outcomes of cigarette smoke condensate-induced endothelial cell death

Affiliations

Apoptosis and necrosis: two different outcomes of cigarette smoke condensate-induced endothelial cell death

B Messner et al. Cell Death Dis. .

Abstract

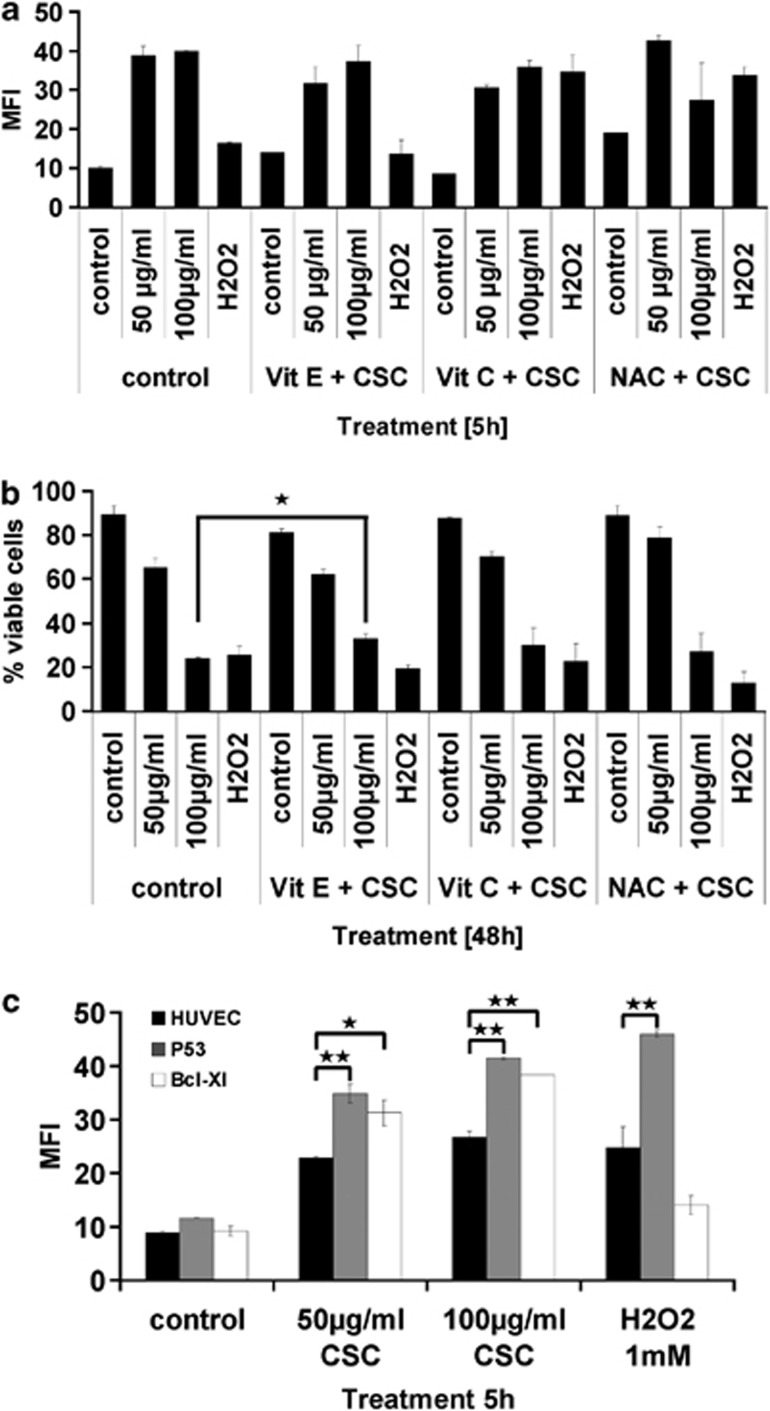
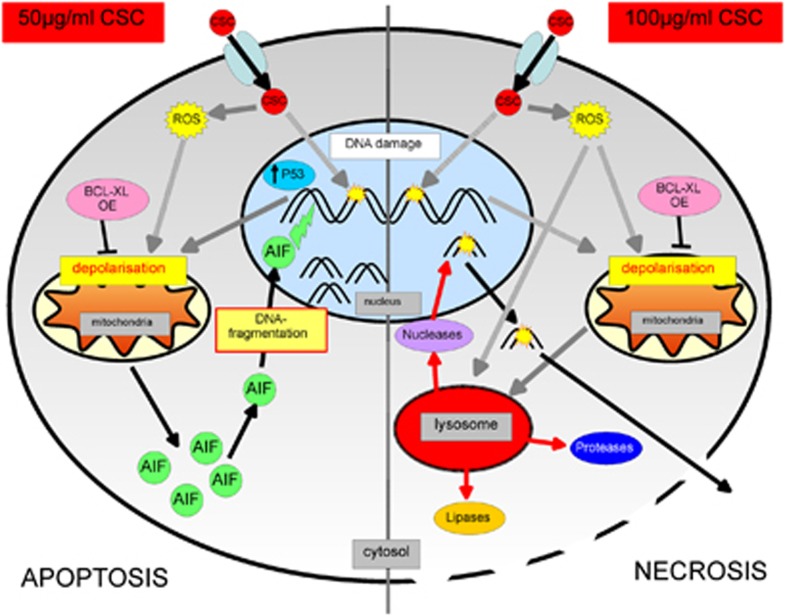
Cigarette smoking is one of the most important and preventable risk factors for atherosclerosis. However, because of the complex composition of cigarette smoke, the detailed pathophysiological mechanisms are not fully understood. Based on controversial reports on the pro-atherogenic activity of cigarette smoke condensate, also called tar fraction (CSC), we decided to analyse the effects of CSC on the viability of endothelial cells in vitro. The results of this study show that low concentrations of the hydrophobic tar fraction induces DNA damage resulting in a P53-dependent and BCL-XL-inhibitable death cascade. Western blot analyses showed that this cascade is caspase-independent and immunofluorescence analysis have shown that the apoptotic death signalling is mediated by the release of apoptosis-inducing factor. Higher CSC concentrations also induce apoptotic-like signalling but the signalling cascade is then redirected to necrosis. Despite the fact that CSC induces a profound increase in cellular reactive oxygen species production, antioxidants exhibit only a minimal cell death protective effect. Our data indicates that not only hydrophilic constituents of cigarette smoke extract, but also CSC is harmful to endothelial cells. The mode and the outcome of CSC-induced cell death signalling are highly concentration dependent: lower concentrations induce caspase-independent apoptosis-like cell death, whereas incubation with higher concentrations interrupts apoptotic signalling and induces necrosis.


Figures

Figure 1
Figure 1
CSC inhibits proliferation and induces apoptotic and necrotic cell death. (a) Shows the effect of 50 and 100 μg/ml CSC on the number of viable endothelial cells in vitro determined by XTT assay. Mean values±S.D. of a representative experiment performed in quadruplicates are shown. (b) FACS analysis of CSC-induced cell death. Endothelial cells were incubated with 50 or 100 μg/ml CSC for 48 and 72 h. Apoptotic and necrotic cell death was detected by performing annexin V/propidium iodide stainings. (c) Endothelial cells were incubated with 50 or 100 μg/ml CSC for 24, 48 and 72 h before the LDH release was measured. Mean values±S.D. of a representative experiment performed in triplicates (annexin V staining) or quadruplicates (XTT assay and LDH assay) are shown. (d) Shows images of scanning electron microscopic analysis of control and CSC-treated endothelial cells (arrow: necrotic cell; star: apoptotic cell). Representative images are shown. (e) Shows data on the DNA content of HUVECs treated with 50 μg/ml CSC and 100 μg/ml for the indicated times, respectively. The DNA content was analysed by FACS analysis. Asterisks indicate significant differences (*P<0.05; **P<0.01; ***P<0.001) compared with the corresponding controls
Figure 2
Figure 2
CSC-induced DNA damage and mitochondrial depolarisation without caspase-3 activation. (a) Shows data from a DNA damage analysis by the comet assay. Percent comet-positive cells compared with the control are shown. (b) Shows western blot analysis of P53 in HUVECs treated with 50 or 100 μg/ml CSC after 24, 48 and 72 h, respectively. Representative blots are shown. Data in (c) shows JC-1-based FACS analysis of intracellular mitochondrial membrane potential after CSC treatment for 2, 6, 12 and 24 h. Mean values±S.D. of a representative experiment performed in triplicates (JC-1 staining) or quadruplicates (Comet assay) are shown. (d) Shows western blot analysis of caspase-3 in CSC-treated endothelial cells. The cells were incubated with 50 or 100 μg/ml CSC for 24, 48 and 72 h. The right western blot in (d) shows analysis of endothelial cells treated with ursolic acid (6.25 and 12.5 μM for 13 h), which serves as a positive control. Representative blots are shown. Mean values±S.D. are shown. Asterisks indicate significant differences (*P<0.05; **P<0.01; ***P<0.001) compared with the controls
Figure 3
Figure 3
CSC-induced concentration-dependent signalling: translocation of AIF into the nucleus and permeabilisation of lysosomes. (a) Shows the result of annexin V/propidium iodide staining and FACS analysis of CSC-treated P53 knock down and BCL-XL-overexpressing cells. The cells were incubated with 50 and 100 μg/ml CSC for 48 h. (b) Shows immunofluorescence pictures of cellular AIF distribution in CSC-treated endothelial cells for 24, 48 and 72 h. Green fluorescence is specific for AIF and the nucleus is stained with TOPRO-3 (shown in blue). (b) Shows also immunofluorescence pictures of endothelial cells (controls and CSC incubated cells) incubated with an isotype control (negative control; cells stained with FITC rabbit anti-human IgG isotype). (c) FACS-based analysis of lysosomal integrity. Endothelial cells were incubated with 50 or 100 μg/ml CSC for 24, 48 and 72 h and lysosomal integrity was analysed using the LysoTracker dye. (d) Shows western blot analysis of LC 3 (autophagy marker). HUVECs were incubated with 50 or 100 μg/ml CSC for 24, 48 and 72 h. All experiments were performed in triplicates and were repeated at least three times. Mean values±S.D. are shown. Asterisks indicate significant differences (*P<0.05; **P<0.01) compared with the controls. MFI=mean fluorescence intensity
Figure 4
Figure 4
CSC-induced ROS production and the effect of antioxidants, P53 knock down and BCL-XL-overexpressing. (a) Shows the effect of CSC treatment on intracellular ROS production after 5 h of incubation. The effect of different antioxidants on CSC-induced ROS production was also analysed and is depicted in (a). To analyse the effect of different antioxidants on CSC-induced cell death FACS analysis were performed and the results are shown in (b). (c) Shows the effect of P53 knock down and BCL-XL-overexpression on CSC-induced ROS production. All experiments were performed in duplicates and were repeated at least three times. Mean values±S.D. are shown. Asterisks indicate significant differences (*P<0.05; **P<0.01) compared with the corresponding controls
Figure 5
Figure 5
Schematic hypothetical sketch of CSC-induced cell death: signalling and execution of CSC-induced cell death. The schematic sketch is divided into two parts: the left side shows intracellular signalling after administration of 50 μg/ml CSC and the right side the intracellular signalling after treatment with 100 μ/ml CSC. In all, 50 μg/ml induces apoptotic-like signalling in endothelial cells: CSC constituents enter the cells via unknown mechanisms and induce the formation of ROS (or are itself the source for ROS). CSC constituents (e.g., polycyclic aromatic hydrocarbon (PAH)) causes DNA damage and induces the activation of P53. The signal is then redirected from the P53 to the mitochondria and induces the depolarisation of mitochondrial membrane potential. This depolarisation could also be induced direct by ROS. CSC-induced mitochondrial depolarisation and rupture of the outer membrane induces the release of AIF, its translocation to the nucleus and the fragmentation of the DNA. In total, 100 μg/ml induces programmed necrosis signalling in endothelial cells: CSC constituents enter the cells via unknown mechanisms and induce the formation of ROS (or are itself the source for ROS). CSC constituents (e.g., PAH) causes DNA damage without the activation of P53. Depolarisation of mitochondrial membrane potential is induced either by DNA damage signalling without P53 contribution or direct by ROS. The next step in cell death signalling is the damage of lysosomes either induced via a signal from the mitochondria or via CSC-induced ROS formation. Damage of lysosomes induces the release of lipases and protease, which in turn induces plasma membrane rupture and the release of DNAses, finally leading to complete DNA degradation

References

    1. Mallat Z, Tedgui A. Apoptosis in the vasculature: mechanisms and functional importance. Br J Pharmacol. 2000;130:947–962. - PMC - PubMed
    1. Organisation WH . Tobacco – Fact Sheet No 339. World Health Organisation; 2012.
    1. Knoflach M, Kiechl S, Kind M, Said M, Sief R, Gisinger M, et al. Cardiovascular risk factors and atherosclerosis in young males: ARMY study (atherosclerosis risk-factors in male youngsters) Circulation. 2003;108:1064–1069. - PubMed
    1. Powell JT. Vascular damage from smoking: disease mechanisms at the arterial wall. Vasc Med. 1998;3:21–28. - PubMed
    1. Ambrose JA, Barua RS. The pathophysiology of cigarette smoking and cardiovascular disease: an update. J Am Coll Cardiol. 2004;43:1731–1737. - PubMed

Publication types

MeSH terms

Substances