. 2013 Jan 4;288(1):141-51.
doi: 10.1074/jbc.M112.431411. Epub 2012 Nov 14.

Matrix rigidity activates Wnt signaling through down-regulation of Dickkopf-1 protein

Affiliations

Matrix rigidity activates Wnt signaling through down-regulation of Dickkopf-1 protein

Maria V Barbolina et al. J Biol Chem. .

Abstract

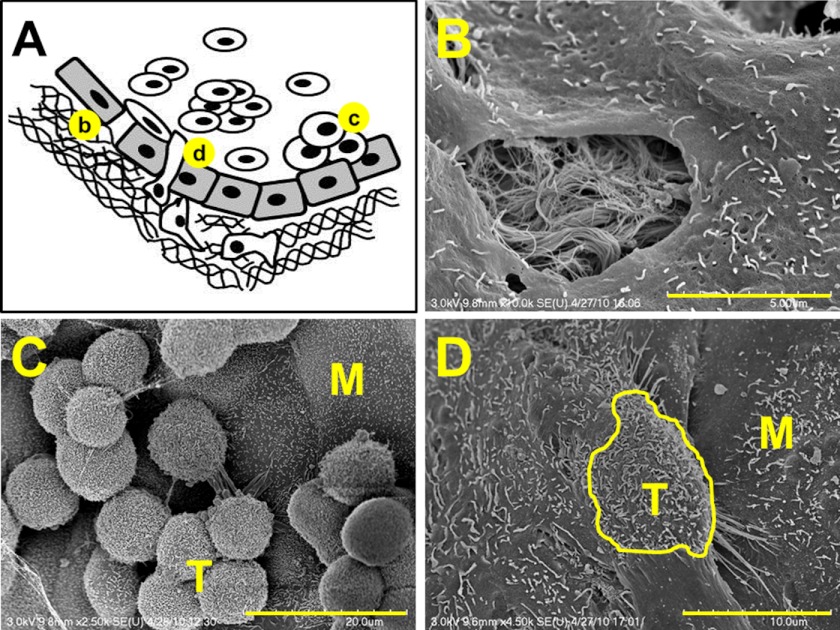
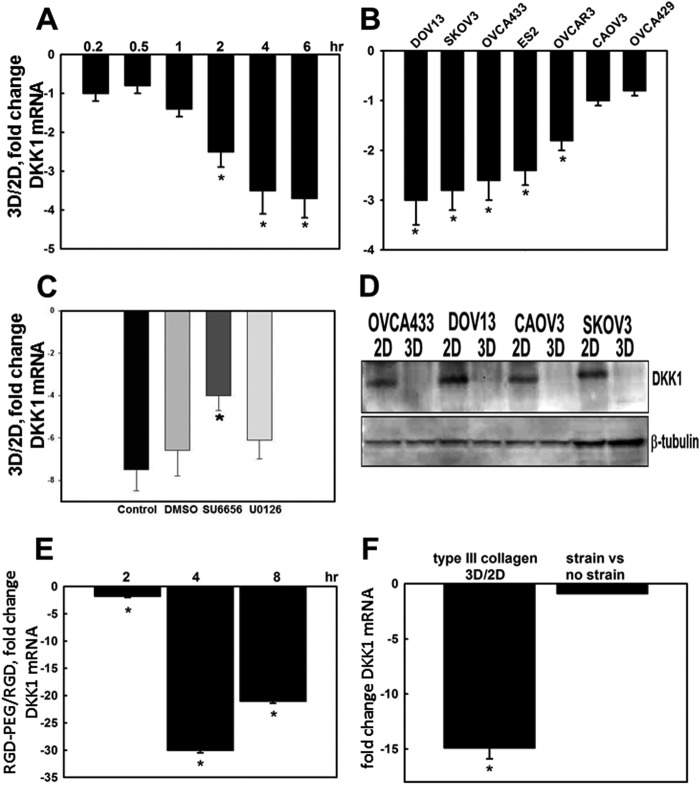
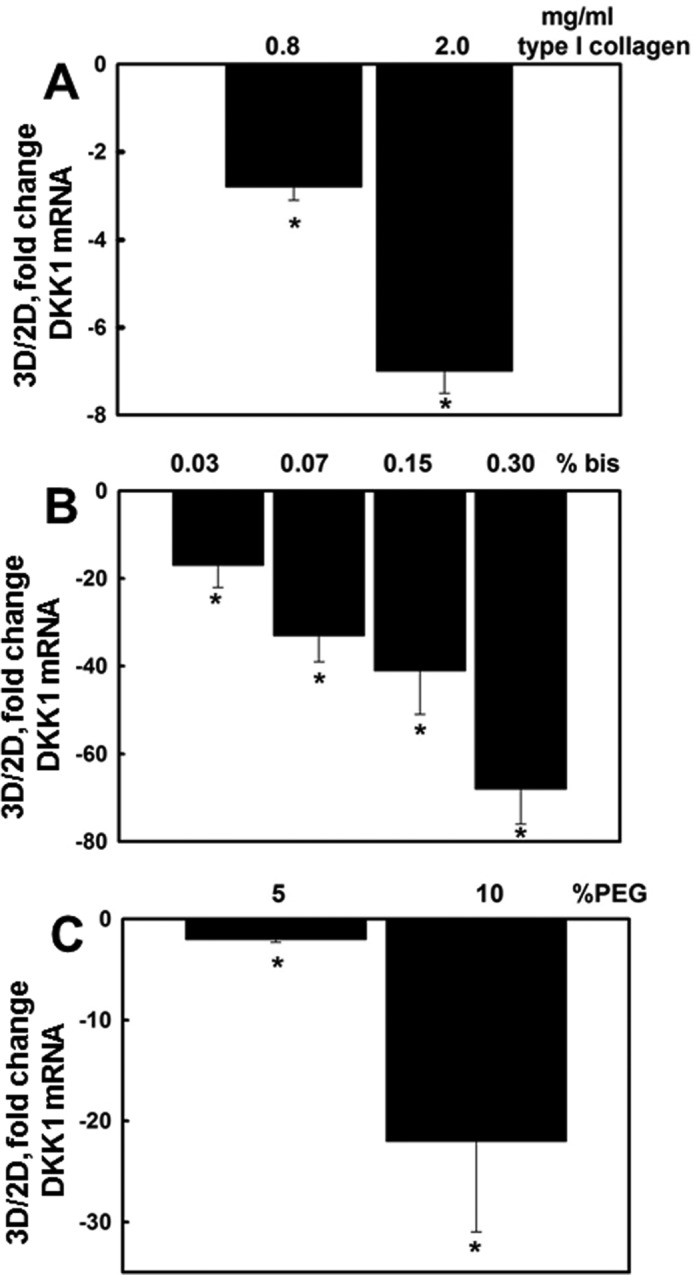
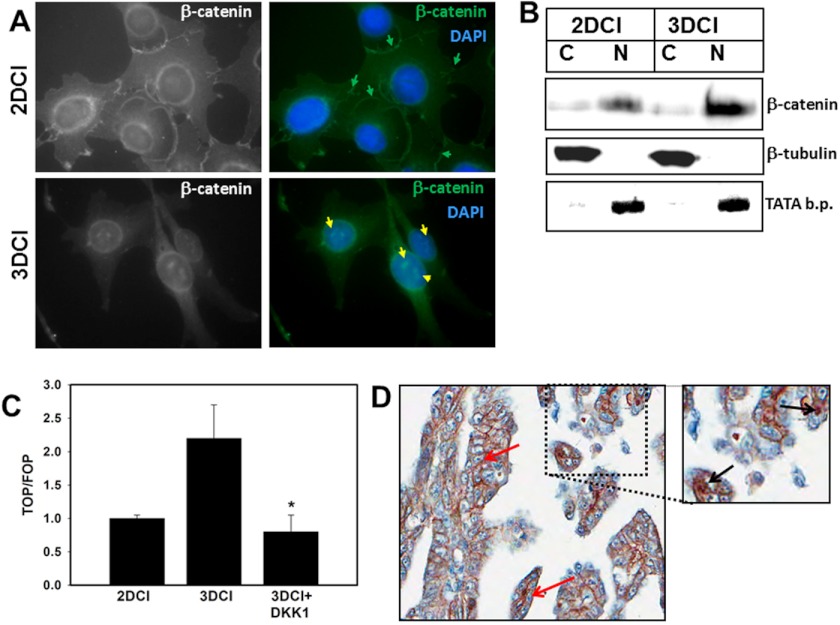
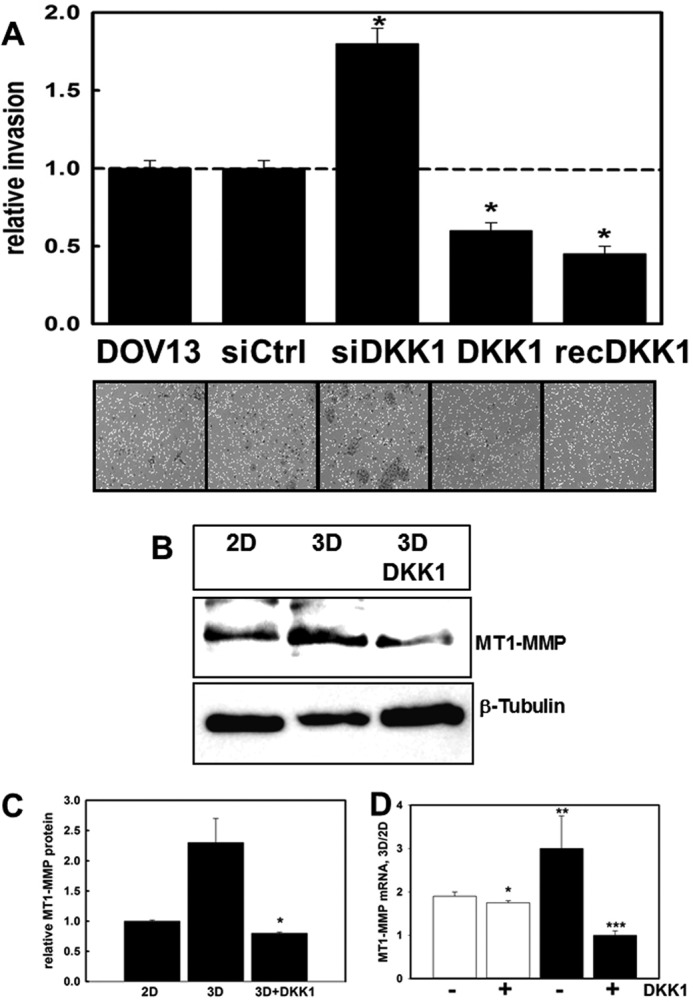
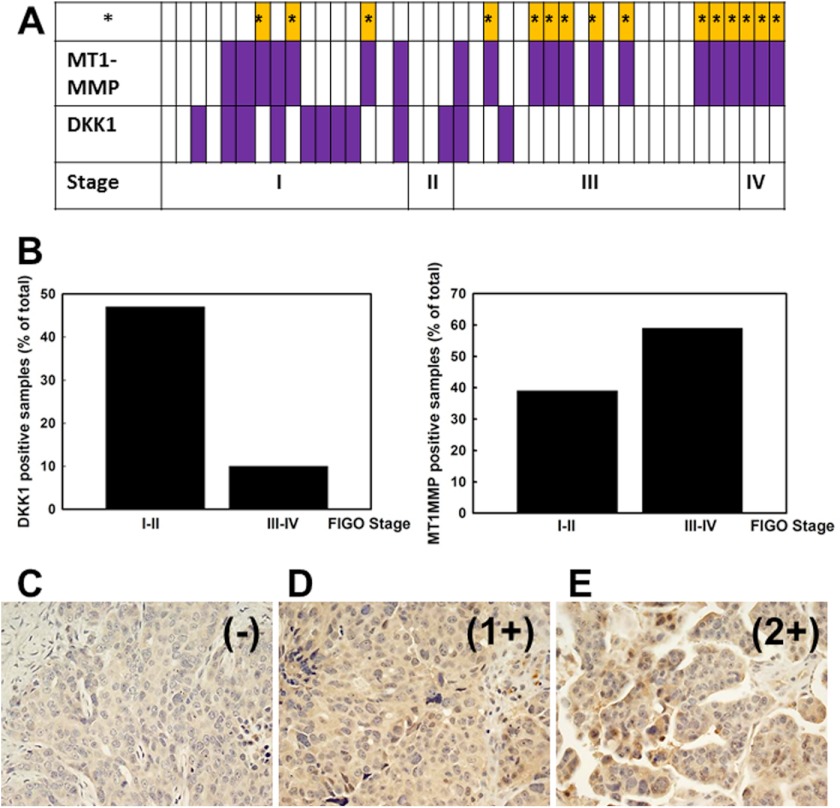
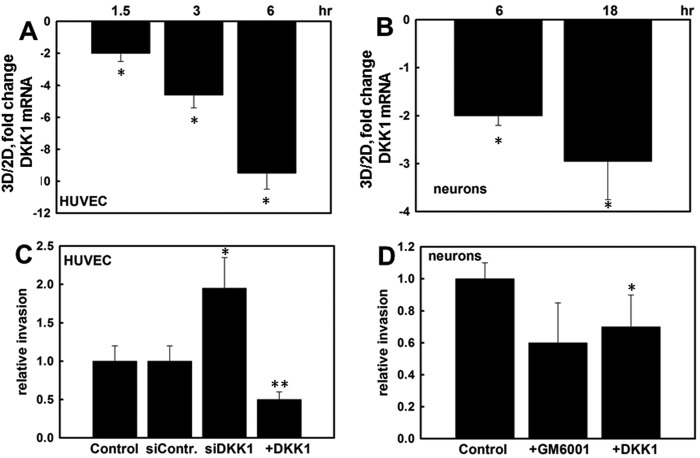
Cells respond to changes in the physical properties of the extracellular matrix with altered behavior and gene expression, highlighting the important role of the microenvironment in the regulation of cell function. In the current study, culture of epithelial ovarian cancer cells on three-dimensional collagen I gels led to a dramatic down-regulation of the Wnt signaling inhibitor dickkopf-1 with a concomitant increase in nuclear β-catenin and enhanced β-catenin/Tcf/Lef transcriptional activity. Increased three-dimensional collagen gel invasion was accompanied by transcriptional up-regulation of the membrane-tethered collagenase membrane type 1 matrix metalloproteinase, and an inverse relationship between dickkopf-1 and membrane type 1 matrix metalloproteinase was observed in human epithelial ovarian cancer specimens. Similar results were obtained in other tissue-invasive cells such as vascular endothelial cells, suggesting a novel mechanism for functional coupling of matrix adhesion with Wnt signaling.


Figures

FIGURE 1.
FIGURE 1.
Model of epithelial ovarian cancer metastasis. A, cells shed from the primary tumor circulate in ascites fluid, interact with peritoneal mesothelial cells, induce mesothelial cell retraction, and adhere avidly to the submesothelial three-dimensional collagen matrix wherein they anchor and proliferate to form secondary lesions. Scanning electron micrographs (SE) depicting events in metastasis (b, c, and d) are shown in the following panels. B, scanning electron micrographs of retracted mesothelial cells showing the underlying three-dimensional collagen matrix. Scale bar, 5 μm. C, scanning electron micrographs of EOC tumor cells (T) adherent to peritoneal tissue in a tissue explant. M designates mesothelial cells. Scale bar, 20 μm. D, scanning electron micrographs of EOC tumor cell (T; outlined in yellow) intercalated between peritoneal mesothelial cells (M) in a tissue explant. Scale bar, 10 μm.
FIGURE 2.
FIGURE 2.
Three-dimensional collagen culture down-regulates DKK1 expression. A, DOV13 cells were cultured on three-dimensional CI (3D) or planar collagen (two-dimensional (2D)) for the indicated time followed by real time RT-PCR analysis of DKK1 mRNA expression. Shown is the -fold change in the ratio of DKK1 mRNA in three-dimensional relative to two-dimensional collagen. Ratios of DKK1 RNA expression were obtained using the 2−ΔΔCt method. An average of three independent experiments ±S.D. (error bars) is presented, and data were statistically evaluated by t test. * designates p < 0.05. B, multiple ovarian carcinoma cell lines as indicated were cultured on three-dimensional CI or planar collagen (two-dimensional) for 8 h followed by RNA extraction, cDNA synthesis, and real time RT-PCR to assess DKK1 mRNA levels. Shown is the -fold change in the ratio of DKK1 mRNA in three-dimensional CI relative to two-dimensional. * designates p < 0.05. C, DOV13 cells were cultured for 8 h on three-dimensional CI or planar collagen (two-dimensional) in the presence of DMSO, SU6656 (2 μm), or UO126 (25 μm) as indicated followed by analysis of DKK1 mRNA expression as in A. * designates p < 0.05. D, representative Western blot of DKK1 levels in whole cell lysates after 24-h culture on planar collagen (two-dimensional) and three-dimensional CI as indicated. Blots were developed using polyclonal anti-DKK1 (1:200) and anti-rabbit HRP-conjugated secondary antibodies (1:1000). Expression of β-tubulin was probed as a loading control. E, DOV13 cells were cultured atop three-dimensional RGDS-PEG gels or planar unconjugated RGDS for the indicated periods of time followed by RNA extraction, cDNA synthesis, and real time RT-PCR. Averaged ratios of DKK1 mRNA levels in cells cultured on three-dimensional versus two-dimensional substratum are plotted on the histogram as -fold down-regulation against time. * designates p ≤ 0.005. F, expression of DKK1 mRNA was analyzed in DOV13 cells cultured on three-dimensional gels prepared from type III collagen relative to cells cultured on planar (two-dimensional) collagen III. Additionally, expression was evaluated in cells subjected to mechanical strain (as described under “Experimental Procedures”) compared with control cells as indicated. Averaged ratios of DKK1 mRNA levels in cells cultured on three-dimensional CIII versus planar CIII (two-dimensional) and under conditions of strain versus controls are plotted on the histogram as -fold down-regulation. * designates p < 0.005.
FIGURE 3.
FIGURE 3.
Matrix rigidity regulates DKK1 expression. A, DOV13 cells were cultured on three-dimensional (3D) collagen I gels formed using 0.8 or 2.0 mg/ml collagen I as indicated. Controls included cells cultured on planar (two-dimensional (2D)) collagen I. RNA was extracted, cDNA was synthesized, and real time RT-PCR was performed to detect DKK1 RNA expression. The ratio of DKK1 expression is depicted. An average of three independent experiments ±S.D. (error bars) is presented. p values were calculated using Student's t test. * designates p < 0.0005. B, DOV13 cells were cultured for 6 h on polyacrylamide gels containing a constant collagen concentration (0.2 mg/ml) with varied bisacrylamide to modulate gel stiffness. Cells were collected, total RNA was extracted, cDNA was synthesized, and DKK1 expression was detected using RT-PCR. * designates p < 0.05. C, DOV13 cells were cultured on 5 or 10% PEG gels with a constant RGDS concentration as indicated under “Experimental Procedures” for 8 h. Controls included cells cultured on a planar RGDS-coated tissue culture support. Total RNA was extracted, cDNA was synthesized, and real time RT-PCR was performed to detect DKK1 RNA expression. The ratio of DKK1 expression in three-dimensional versus two-dimensional culture conditions is depicted. An average of three independent experiments ±S.D. (error bars) is presented. p values were calculated using Student's t test. * designates p < 0.005.
FIGURE 4.
FIGURE 4.
Three-dimensional CI modulates β-catenin dynamics. A, DOV13 cells were cultured for 6 h on three-dimensional (3D) CI or planar collagen (two-dimensional (2D)) as indicated followed by fixation and staining using anti-β-catenin and anti-mouse Alexa Fluor 488 antibodies at 1:50 and 1:500 dilutions, respectively. Nuclei are stained with 4′,6-diamidino-2-phenylindole dihydrochloride (DAPI). Immunofluorescence images were taken with a Zeiss Axiovert fluorescence microscope using a 63× objective. Green and yellow arrows show membranous and nuclear β-catenin, respectively. Nuclear β-catenin was detected in >70% of cells cultured on three-dimensional CI (evaluation of 100 cells per condition). Magnification, 400×. B, cells were cultured on three-dimensional CI or planar collagen I for 6 h and subjected to subcellular fractionation as indicated under “Experimental Procedures” to collect cytoplasmic (C) and nuclear (N) fractions. The lysates were analyzed by Western blot using anti-β-catenin at a 1:50 dilution, anti-β-tubulin at a 1:1000 dilution, and anti-histone H3 at a 1:50 dilution. β-Tubulin and TATA-binding protein (b.p.) expression served as indicators of successful separation of cytoplasmic or nuclear protein fractions, respectively. To provide semiquantitative analysis of β-catenin distribution, levels of nuclear β-catenin were quantified using densitometry and normalized relative to TATA-binding protein. A 2-fold increase in nuclear β-catenin was observed in cells cultured on three-dimensional CI relative to two-dimensional. C, cells were transiently transfected with TOPFlash (TOP) and FOPFlash (FOP) promoter-luciferase reporter constructs to evaluate β-catenin transcriptional activity in cells cultured on three-dimensional CI versus planar (two-dimensional) collagen I for 6 h. A Renilla luciferase-expressing plasmid was co-transfected to account for the efficiency of transfection. Cells were lysed, and the luciferase signal was measured using a Dual-Luciferase system. TOPFlash and FOPFlash signals were first normalized to the Renilla luciferase signal, and then ratios of TOPFlash to FOPFlash were calculated. Results represent the mean and S.D. of three experiments. * designates p < 0.05 relative to control cells on three-dimensional CI. D, immunohistochemical analysis of β-catenin expression in metastatic human ovarian carcinoma. Shown is a specimen of a metastatic serous papillary adenocarcinoma from ovary to omentum (core number 43 in OV808 tissue microarray, US Biomax). Pictures were taken with an Aperio Imagescope system at 20× magnification. The outlined region was magnified 1.5-fold. Red arrows indicate membranous and black arrows indicate nuclear β-catenin.
FIGURE 5.
FIGURE 5.
DKK1 regulates MT1-MMP-dependent collagen invasion. A, a modified Boyden chamber assay was used to evaluate invasion of cells through three-dimensional CI. Cells were transfected with control siRNA (siCtrl), DKK1-specific siRNA (siDKK1), or a DKK1 expression plasmid (pCS2+/DKK1; designated DKK1) or were incubated in the presence of 0.33 μg/ml recombinant DKK1 (rDKK1) as indicated. Cells invaded through the collagen gel (18 h) and attached to the lower surface of the filter. Following removal of non-invasive cells from the upper surface, the filter was stained, and invasive cells were quantified. Invasion of DOV13 cells was arbitrarily set as “1,” and other values were normalized to this value. An average of five independent experiments is presented. Error bars represent S.D. p values were obtained by Student's t test in comparison with non-treated DOV13 controls. * designates p < 0.0005. B and C, DOV13 cells were cultured on three-dimensional (3D) CI or planar (two-dimensional (2D)) collagen I in the presence or absence of 0.33 mg/ml exogenous DKK1 and subjected to Western blot to detect MT1-MMP expression (1:1000 antibody dilution). β-Tubulin was used as a protein loading control. The histogram (C) shows densitometric quantitation of MT1-MMP levels. Expression of MT1-MMP in cells on planar collagen I was arbitrarily set as 1. p values were obtained by Student's t test. * designates p < 0.005 relative to culture on three-dimensional CI. D, DOV13 cells were cultured on three-dimensional CI or planar (two-dimensional) collagen I in the presence or absence of 0.33 mg/ml exogenous DKK1 for 4 (open bars) or 8 h (solid bars). RNA was extracted, cDNA was synthesized, and real time RT-PCR was performed to detect MT1-MMP RNA expression. Ratios of MT1-MMP RNA expression were found using the 2−ΔΔCt method. p values were obtained by Student's t test. * designates p = 0.03 relative to the 4-h sample in the absence of DKK1, ** designates p = 0.002 relative to the 4-h sample in the absence of DKK1, and *** designates p = 0.001 relative to the 8-h sample in the absence of DKK1.
FIGURE 6.
FIGURE 6.
Analysis of DKK1 and MT1-MMP expression in human ovarian tumors. A, human ovarian carcinoma RNA extracts were tested for DKK1 and MT1-MMP expression using real time RT-PCR. Open rectangles represent specimens with negative DKK1 or MT1-MMP expression (defined as no signal or Ct < 35), and closed purple filled rectangles show positive DKK1 or MT1-MMP expression (defined as Ct ≥35). A total of 41 samples were tested. Results for samples from 1 to 41 are plotted from left to right. Samples from ovarian carcinoma International Federation of Gynecology and Obstetrics (FIGO) stages I, II, III, and IV are indicated as “I,” “II,” “III,” and “IV,” respectively. Cases where negative DKK1 coincided with positive MT1-MMP expression are indicated (*; yellow bars). B, histogram showing the percentage of DKK1- and MT1-MMP-positive samples as percentage of total. C–E, representative examples from immunohistochemical analysis of DKK1. Examples of DKK1 staining include negative (−) (C; case number 9 from supplemental Table 1), weakly positive 1+ (D; case number 8 from supplemental Table 1), and moderately positive 2+ (E; case number 15 from supplemental Table 1). Magnification, 20×.
FIGURE 7.
FIGURE 7.
Three-dimensional CI regulates DKK1 expression and invasion in endothelial cells and primary cortical neurons. Human umbilical vein endothelial cells (HUVEC) (A) and E17 primary cortical neurons (B) were cultured on three-dimensional (3D) CI or planar (two-dimensional (2D)) collagen I for the indicated periods of time. RNA was extracted, cDNA was synthesized, and real time RT-PCR was performed to detect DKK1 RNA expression. Ratios of DKK1 RNA expression were found with the 2−ΔΔCt method. The averaged ratio of DKK1 expression in three-dimensional CI versus two-dimensional CI from three independent experiments is depicted in the histograms ±S.D. (error bars). * designates p < 0.0005. C, endothelial cells were transiently transfected with control siRNA (siContr), DKK1-specific siRNA (siDKK1), or a DKK1-expressing plasmid (+DKK1) as indicated followed by evaluation of the ability to invade three-dimensional CI gels. Invasion of untreated control cells was arbitrarily set as 1, and other values were calculated accordingly. The average of four independent experiments ±S.D. (error bars) is presented. * designates p < 0.05, and ** designates p < 0.005 relative to control. D, the ability of E17 cortical neurons to invade three-dimensional CI gels was assessed in the presence and absence of 10 μm GM6001 or 0.33 mg/ml exogenous DKK1 as indicated. The average of three independent experiments ±S.D. (error bars) is presented. * designates p < 0.05 relative to untreated controls. Note that comparison of invasion in the presence of GM6001 resulted in p = 0.06.

Similar articles

Cited by

References

    1. Bissell M. J., Barcellos-Hoff M. H. (1987) The influence of extracellular-matrix on gene-expression: is structure the message. J. Cell Sci. Suppl. 8, 327–343 - PubMed
    1. Labat-Robert J., Bihari-Varga M., Robert L. (1990) Extracellular matrix. FEBS Lett. 268, 386–393 - PubMed
    1. Butcher D. T., Alliston T., Weaver V. M. (2009) A tense situation: forcing tumour progression. Nat. Rev. Cancer 9, 108–122 - PMC - PubMed
    1. Engler A. J., Humbert P. O., Wehrle-Haller B., Weaver V. M. (2009) Multiscale modeling of form and function. Science 324, 208–212 - PMC - PubMed
    1. Gehler S., Baldassarre M., Lad Y., Leight J. L., Wozniak M. A., Riching K. M., Eliceiri K. W., Weaver V. M., Calderwood D. A., Keely P. J. (2009) Filamin A-β1 integrin complex tunes epithelial cell response to matrix tension. Mol. Biol. Cell 20, 3224–3238 - PMC - PubMed

Publication types

LinkOut - more resources