. 2012 Nov 14;32(46):16120-8.
doi: 10.1523/JNEUROSCI.1572-12.2012.

Morphine withdrawal enhances constitutive μ-opioid receptor activity in the ventral tegmental area

Affiliations

Morphine withdrawal enhances constitutive μ-opioid receptor activity in the ventral tegmental area

Frank J Meye et al. J Neurosci. .

Abstract

μ-Opioid receptors (MORs) in the ventral tegmental area (VTA) are pivotally involved in addictive behavior. While MORs are typically activated by opioids, they can also become constitutively active in the absence of any agonist. In the current study, we present evidence that MOR constitutive activity is highly relevant in the mouse VTA, as it regulates GABAergic input to dopamine neurons. Specifically, suppression of MOR constitutive activity with the inverse agonist KC-2-009 enhanced GABAergic neurotransmission onto VTA dopamine neurons. This inverse agonistic effect was fully blocked by the specific MOR neutral antagonist CTOP, which had no effect on GABAergic transmission itself. We next show that withdrawal from chronic morphine further increases the magnitude of inverse agonistic effects at the MOR, suggesting enhanced MOR constitutive activity. We demonstrate that this increase can be an adaptive response to the detrimental elevation in cAMP levels known to occur during morphine withdrawal. These findings offer important insights in the physiological occurrence and function of MOR constitutive activity, and have important implications for therapeutic strategies aimed at normalizing MOR signaling during addiction and opioid overdose.


Figures

Figure 1.
Figure 1.
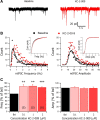
The MOR agonist DAMGO suppresses mIPSC frequency onto VTA dopamine neurons. A, Example traces of mIPSCs in the absence (black) and presence (blue) of 1 μm DAMGO. mIPSC frequency is diminished after administration of the MOR agonist. B, Distributions of mIPSC acute frequency (left) and amplitude (right) during baseline (black circles) and after administration of 1 μm DAMGO (blue triangles) in a representative experiment. The lines represent the fitted lognormal curves to extract means and SDs for the baseline (black, solid) and DAMGO (blue, dashed) conditions. DAMGO induces a clear leftward shift in the mIPSC frequency distribution. Inset, Cumulative probability plot of mIPSC frequency (left) and amplitude (right) of all experiments before (black circles) and after (blue triangles) 1 μm DAMGO. C, Average acute frequency (left) and amplitude (right) after DAMGO treatment as percentage of baseline, with the number of experiments in parentheses. DAMGO reduces mIPSCs across various doses. **p < 0.01; ***p < 0.001.
Figure 2.
Figure 2.
The MOR inverse agonist KC-2-009 enhances mIPSC frequency onto VTA dopamine neurons. A, Representative traces of mIPSCs in the absence (black) and presence (red) of 1 μm KC-2-009. Administration of this MOR inverse agonist increases mIPSC frequency. B, Exemplar lognormal distributions of mIPSC acute frequency (left) and amplitude (right) during baseline (black circles) and after administration of 1 μm KC-2-009 (red triangles). The MOR inverse agonist induces a rightward shift in the mIPSC frequency distribution, indicating a higher frequency of GABA transmission. Inset, Cumulative probability plot of mIPSC frequency (left) and amplitude (right) of all experiments before (black circles) and after 1 μm KC-2-009 (red triangles). C, Average acute frequency (left) and amplitude (right) as a percentage of baseline after various doses of KC-2-009. KC-2-009 clearly increased mIPSC frequency at all these doses. The number of experiments per dose is indicated in parentheses. **p < 0.01; ***p < 0.001.
Figure 3.
Figure 3.
The inverse agonistic effect of KC-2-009 is due to suppression of MOR constitutive activity. A, Representative traces of mIPSCs in the absence (black) and presence (red) of 1 μm the MOR neutral antagonist CTOP, which did not affect mIPSC frequency or amplitude. B, Associated exemplar lognormal distributions of mIPSC acute frequency (left) and amplitude (right) during baseline (black circles) and after administration of 1 μm CTOP (green squares). CTOP did not change the mIPSC frequency or amplitude distributions. Insets, Cumulative probability plots for mIPSC frequency (left) and amplitude (right) of all experiments before (black circles) and after 1 μm CTOP (green squares). C, Overview of the effect of various MOR ligands on mIPSC frequency in the VTA, with the number of experiments indicated in parentheses. Whereas the neutral antagonist CTOP did not affect mIPSCs itself, it did block the effects of both DAMGO and KC-2-009. In contrast, the KOR antagonist Nor-BNI could not block the effect of KC-2-009. Pretreatment with KC-2-009 also prevented the effect of DAMGO. *p < 0.05; **p < 0.01; ***p < 0.001.
Figure 4.
Figure 4.
Morphine withdrawal enhances MOR constitutive activity in the VTA. A, Morphine withdrawal increased the baseline frequency of mIPSCs onto VTA dopamine neurons compared with control. B, The MOR inverse agonist KC-2-009 (1 μm) led to a greater increase in mIPSC frequency after 3–4 d of withdrawal from chronic morphine, compared with either saline treatment or only 12 h of morphine abstinence. The MOR neutral antagonist CTOP was still without effect after 3–4 d of withdrawal, suggesting there was no increased release of endogenous opioids in the slice preparation. Note that effects are with respect to the baseline of the cell, correcting for any effects of morphine withdrawal on baseline frequency itself. C, Percentage of VTA dopamine neurons suppressed by the MOR agonist DAMGO during control conditions (left) or after morphine withdrawal (right). After morphine withdrawal, DAMGO only reduced mIPSC frequency in a minority of cells. The number of experiments is indicated in parentheses. *p < 0.05; **p < 0.01.
Figure 5.
Figure 5.
Pretreatment with adenylate cyclase activator FSK is sufficient to enhance MOR constitutive activity in the VTA. A, Top, Representative mIPSC traces in the absence and presence of 0.1 μm FSK. Bottom, FSK increased the baseline frequency of mIPSCs onto VTA dopamine neurons compared with control. B, Differential effects of the MOR neutral antagonist CTOP and the inverse agonist KC-2-009 in the absence and presence of FSK. Percentage change is with respect to the stabilized FSK-containing baseline. FSK pretreatment enhanced the effect of KC-2-009, whereas it did not change the effect of CTOP. Number of experiments indicated in parentheses. *p < 0.05; ***p < 0.001.

References

    1. Acquas E, Carboni E, Di Chiara G. Profound depression of mesolimbic dopamine release after morphine withdrawal in dependent rats. Eur J Pharmacol. 1991;193:133–134. - PubMed
    1. Aston-Jones G, Harris GC. Brain substrates for increased drug seeking during protracted withdrawal. Neuropharmacology. 2004;47(Suppl 1):167–179. - PubMed
    1. Bagley EE, Hacker J, Chefer VI, Mallet C, McNally GP, Chieng BC, Perroud J, Shippenberg TS, Christie MJ. Drug-induced GABA transporter currents enhance GABA release to induce opioid withdrawal behaviors. Nat Neurosci. 2011;14:1548–1554. - PubMed
    1. Baumeister AA, Anticich TG, Hebert G, Hawkins MF, Nagy M. Evidence that physical dependence on morphine is mediated by the ventral midbrain. Neuropharmacology. 1989;28:1151–1157. - PubMed
    1. Bergevin A, Girardot D, Bourque MJ, Trudeau LE. Presynaptic mu-opioid receptors regulate a late step of the secretory process in rat ventral tegmental area GABAergic neurons. Neuropharmacology. 2002;42:1065–1078. - PubMed

Publication types

MeSH terms