. 2012 Nov 14;32(46):16129-40.
doi: 10.1523/JNEUROSCI.2323-12.2012.

Targeting astrocytes ameliorates neurologic changes in a mouse model of Alzheimer's disease

Affiliations

Targeting astrocytes ameliorates neurologic changes in a mouse model of Alzheimer's disease

Jennifer L Furman et al. J Neurosci. .

Abstract

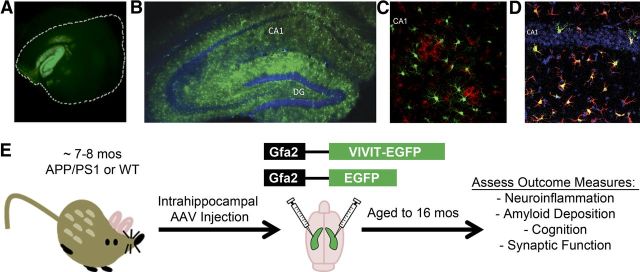
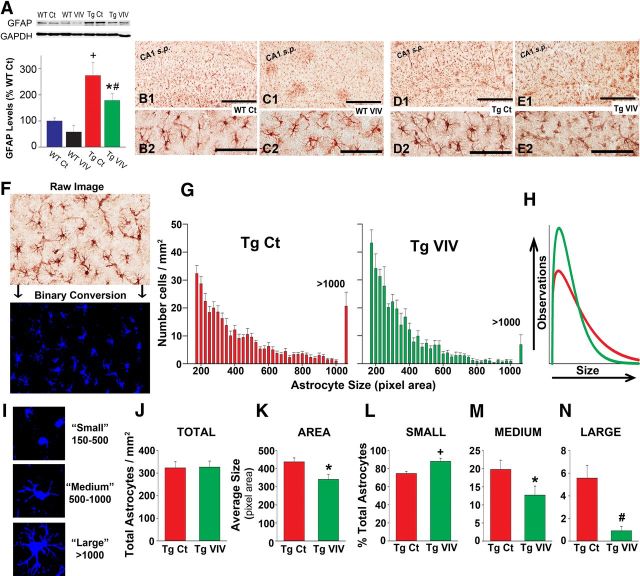
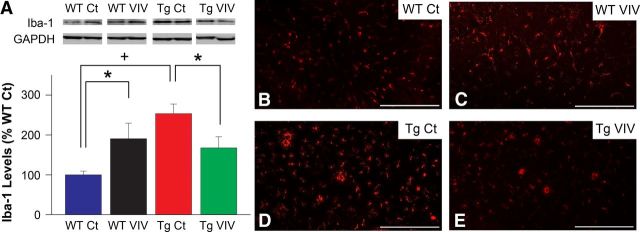
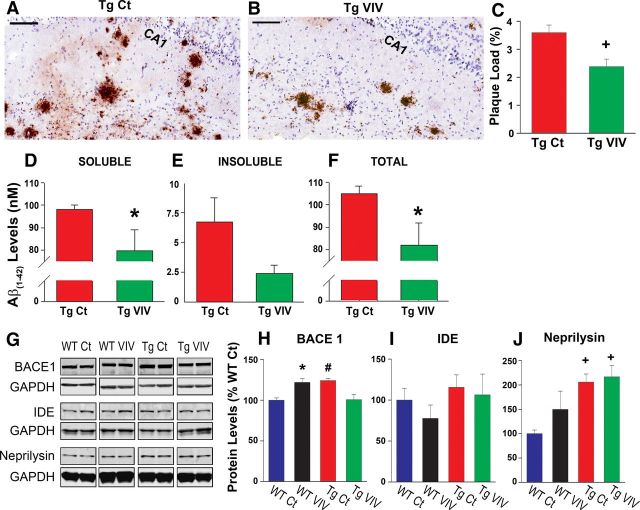
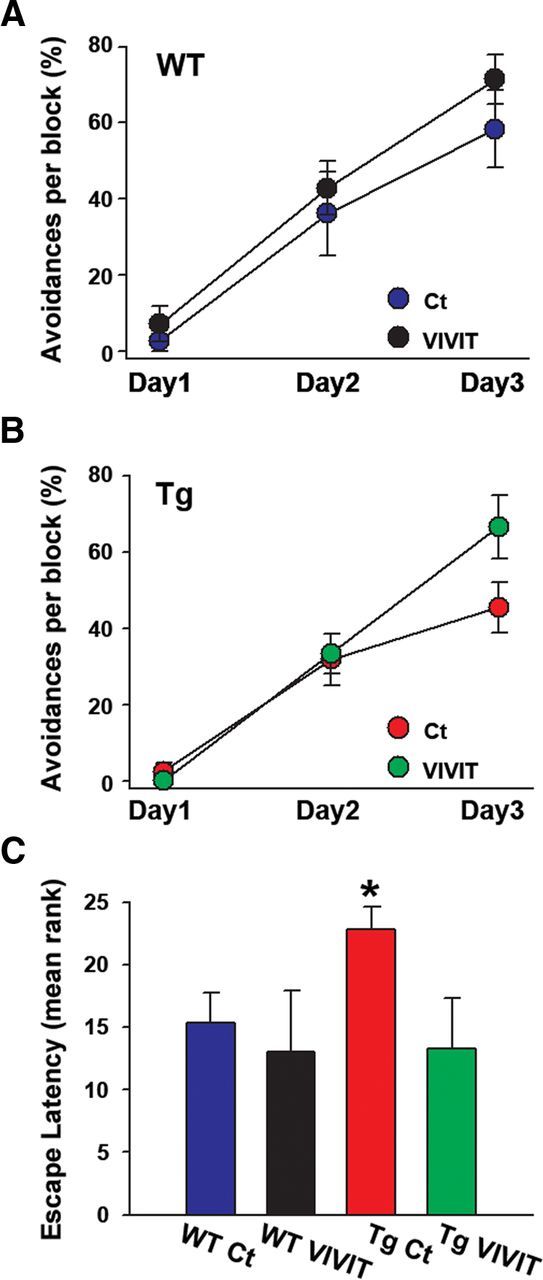
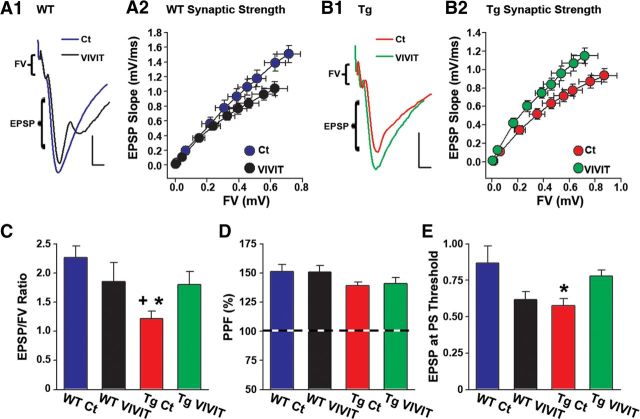
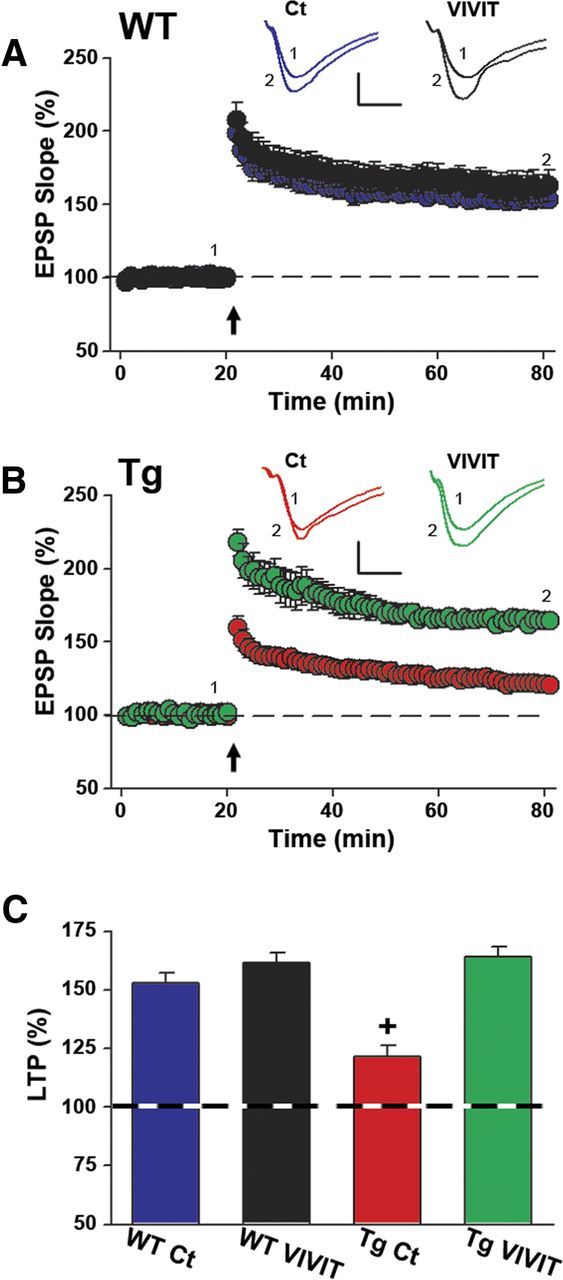
Astrocytes are the most abundant cell type in the brain and play a critical role in maintaining healthy nervous tissue. In Alzheimer's disease (AD) and most other neurodegenerative disorders, many astrocytes convert to a chronically "activated" phenotype characterized by morphologic and biochemical changes that appear to compromise protective properties and/or promote harmful neuroinflammatory processes. Activated astrocytes emerge early in the course of AD and become increasingly prominent as clinical and pathological symptoms progress, but few studies have tested the potential of astrocyte-targeted therapeutics in an intact animal model of AD. Here, we used adeno-associated virus (AAV) vectors containing the astrocyte-specific Gfa2 promoter to target hippocampal astrocytes in APP/PS1 mice. AAV-Gfa2 vectors drove the expression of VIVIT, a peptide that interferes with the immune/inflammatory calcineurin/NFAT (nuclear factor of activated T-cells) signaling pathway, shown by our laboratory and others to orchestrate biochemical cascades leading to astrocyte activation. After several months of treatment with Gfa2-VIVIT, APP/PS1 mice exhibited improved cognitive and synaptic function, reduced glial activation, and lower amyloid levels. The results confirm a deleterious role for activated astrocytes in AD and lay the groundwork for exploration of other novel astrocyte-based therapies.


Figures

Figure 1.
Figure 1.
AAV–Gfa2 vectors drive long-lasting and astrocyte-specific transgene expression. A–D, Representative confocal fluorescent photomicrographs showing EGFP expression in brain sections (A, longitudinal; B–D, coronal) prepared from mice that received a bilateral injection of AAV–Gfa2 vectors into the CA1 region of the hippocampal formation. At 2 months after injection (A), the longitudinal axis of the hippocampus showed abundant EGFP expression, although the neocortex, which is enclosed by the white dashed line, mostly excluded EGFP expression. At 9 months after injection (B–D), the hippocampal molecular layers, but not the dentate granule and CA1 pyramidal neuron layers (counterlabeled blue with DAPI in B and D), showed high levels of EGFP expression. Microglial cells, positively labeled for the presence of Iba-1 (red), were similarly devoid of EGFP expression (C). In contrast to neurons and microglia, numerous GFAP-positive astrocytes (red) colocalized with EGFP (green) (D), confirming that hippocampal astrocytes exclusively expressed the transgene (note EGFP/GFAP colabel appears orange/yellow). E illustrates the treatment paradigm and endpoint measures investigated in this study. WT and Tg mice received injections of either vehicle, or AAV–Gfa2 vectors containing EGFP control or EGFP coupled to the NFAT inhibitor VIVIT. We treated mice at ∼7–8 months of age, at the early stages of amyloid pathology, and then aged them to ∼16 months, at which time they underwent behavioral characterization. After the animals were killed, we assessed several AD-like biomarkers, including neuroinflammation, amyloid pathology, and hippocampal synaptic dysfunction.
Figure 2.
Figure 2.
Gfa2–VIVIT reduces astrocyte activation in Tg mice. A, Representative Western blots and mean ± SEM protein levels for the astrocyte marker GFAP from hippocampal homogenates of WT and Tg mice treated with vehicle and Gfa2–EGFP (Ct) or Gfa2–VIVIT (VIV). In the bar graph, GFAP levels are normalized to GAPDH internal controls and expressed as a percentage of the WT Ct group (+p < 0.001 Tg Ct vs WT Ct and WT VIV; #p < 0.01 Tg VIV vs WT VIV; *p < 0.05 Tg VIV vs WT Ct). B–E, Low-magnification (B1–E1) and high-magnification (B2–E2) representative images of astrocytes immunohistochemically labeled in hippocampal CA1 for the presence of GFAP. CA1 s.p., CA1 pyramidal cell layer. Scale bar, 500 μm. F, Representative region showing GFAP immunoreactivity before (raw) and after conversion to a binary image (cells in blue) for quantification of possible changes in astrocyte size. G, Histograms of binary images showing the size of individual astrocytes (total pixel area per cell) counted per unit area (mean ± SEM) in CA1 of Tg Ct and Tg VIVIT mice. The last column in each histogram indicates the number of cells counted with a total pixel area in excess of 1000. H, Weibull distributions for histograms shown in G. Curve parameters were compared using Z tests (see Results). I, Representative binary images of astrocytes sorted into small-, medium-, and large-sized categories based on total pixel area. J, Total number of astrocytes (mean ± SEM per square millimeter) counted in CA1 for Tg Ct and Tg VIVIT mice. K, Mean ± SEM astrocyte size (pixel area) for astrocytes counted in G. L–N, The proportion of small, medium, and large astrocytes (mean ± SEM, expressed as percentage of total cells) in area CA1 for Tg Ct and Tg VIV groups. For all panels, +p < 0.001, #p < 0.01, *p < 0.05.
Figure 3.
Figure 3.
Gfa2–VIVIT reduces microglial activation in Tg mice. A, Representative Western blots and mean ± SEM protein levels for the microglial marker Iba-1 from hippocampal homogenates of WT and Tg mice treated with vehicle and Gfa2–EGFP (Ct) or Gfa2–VIVIT (VIV). In the bar graph, Iba-1 levels are normalized to GAPDH internal controls and expressed as a percentage of the WT Ct group. Iba-1 levels were significantly reduced in VIVIT-treated Tg mice relative to Tg controls. Interestingly, the opposite effect was seen in WT animals (#p < 0.01, *p < 0.05). Fluorescent labeling of Iba-1 in CA1 stratum radiatum of WT Ct (B), WT VIV (C), Tg Ct (D), and Tg VIV (E) mice corroborated these treatment effects. Scale bars, 250 μm.
Figure 4.
Figure 4.
Gfa2–VIVIT reduces Aβ pathology in Tg mice. A, B, Representative photomicrographs (scale bar, 100 μm) and accompanying plaque load analysis (C, mean ± SEM) illustrating differences in the immunohistochemical labeling of Aβ deposits (brown) in Tg Ct and Tg VIV mice. Hematoxylin (blue) labels the pyramidal neuron layer in CA1. D–F show ELISA measures (mean ± SEM) of soluble, insoluble, and total (soluble + insoluble) Aβ(1–42) peptide levels in hippocampal homogenates of Tg mice. The Gfa2–VIVIT-treated group showed significantly lower (*p < 0.05) total peptide levels (F), attributable mostly to a significant reduction in the toxic, soluble Aβ fraction (D). G–J, Representative Western blots (G) and mean ± SEM protein levels (H–J) for Aβ metabolic enzymes measured from hippocampal homogenates of WT Ct, WT VIV, Tg Ct, and Tg VIV mice. Values are normalized to GAPDH internal controls and expressed as a percentage of the WT Ct group. H, BACE1, the rate-limiting enzyme in Aβ production, was differentially affected by VIVIT treatment across genotypes (#p < 0.01 Tg Ct vs Tg VIV; *p < 0.05 WT Ct vs WT VIV). I, J, IDE and neprilysin, participants in amyloid clearance, were not affected by VIVIT treatment, although neprilysin did show a genotype difference (+p < 0.001 Tg Ct and Tg VIV vs WT Ct).
Figure 5.
Figure 5.
Gfa2–VIVIT improves cognitive performance in Tg mice. Percentage avoidances (mean ± SEM) by WT (A) and Tg (B) mice exhibited on three training days (Day 1, Day 2, Day 3) in a one-way active avoidance task. Gfa2–VIVIT had little effect on avoidance behavior in WT mice (A) but tended to improve performance in the Tg group by the end of training (B). On day 4 of the task, mice completed a single probe trial (C) in the absence of footshock and received rankings (mean ± SEM ranking) according to their escape times (lower ranks correspond to quicker escape latencies). Mean rankings for the WTs and Tg VIVIT groups were very similar on the probe trial and significantly lower than the Tg Ct group (* p > 0.05 Tg Ct vs all other groups).
Figure 6.
Figure 6.
Gfa2–VIVIT improves synaptic function in Tg mice. Representative electrophysiological waveforms recorded in CA1 stratum radiatum of brain slices from WT (A1) and Tg (B1) mice in response to electrical stimulation of CA3 Schaffer collaterals. Calibration: 0.5 mV, 2.5 ms. Waveforms in each treatment group were matched to similar FV amplitudes to illustrate differences in the amplitude of the corresponding postsynaptic response. A2 and B2 show synaptic strength curves for WT (A2) and Tg (B2) mice in which mean EPSP slope (millivolts per milliseconds) amplitudes (SEM, vertical error bars) are plotted against FV (millivolts) amplitudes (SEM, horizontal error bars) across nine stimulus intensity levels. C, Mean ± SEM EPSP/FV ratios calculated from the upper two stimulus intensity levels shown in A2 and B2. The Tg Ct group exhibited a significantly reduced EPSP/FV ratio relative to both the WT Ct and Tg VIVIT groups. D, In contrast to synaptic strength, levels of PPF (mean ± SEM) did not differ across treatment group. E, The mean ± SEM EPSP slope amplitude at which a population spike appeared (i.e., population spike threshold) in the ascending phase of the field potential (see A1 and B1). The WT VIVIT and Tg Ct groups showed a reduced population spike threshold compared with WT Ct and Tg VIVIT mice. This difference reached significance for the Tg Ct group (p < 0.01 vs WT Ct).
Figure 7.
Figure 7.
Gfa2–VIVIT improves LTP in Tg mice. Time plots of mean ± SEM EPSP slope values in CA1 stratum radiatum from WT (A) and Tg (B) mice. Insets show representative EPSP waveforms averaged in individual slices immediately before (1) and 60 min after (2) the delivery of two 1 s trains of 100 Hz stimulation (arrow). Calibration: 0.5 mV, 5 ms. LTP levels did not differ with Gfa2 treatment in WT mice (A); however, Tg Ct mice showed a substantial LTP deficit relative to the Tg VIVIT group (B). The bar graph in C shows LTP levels (mean ± SEM, percentage of baseline) at 60 min after 100 Hz stimulation and illustrates the LTP deficit in Tg Ct mice (+p < 0.001 Tg Ct vs all other groups).

References

    1. Abdul HM, Sama MA, Furman JL, Mathis DM, Beckett TL, Weidner AM, Patel ES, Baig I, Murphy MP, LeVine H, 3rd, Kraner SD, Norris CM. Cognitive decline in Alzheimer's disease is associated with selective changes in calcineurin/NFAT signaling. J Neurosci. 2009;29:12957–12969. - PMC - PubMed
    1. Agostinho P, Lopes JP, Velez Z, Oliveira CR. Overactivation of calcineurin induced by amyloid-beta and prion proteins. Neurochem Int. 2008;52:1226–1233. - PubMed
    1. Ahmed RR, Holler CJ, Webb RL, Li F, Beckett TL, Murphy MP. BACE1 and BACE2 enzymatic activities in Alzheimer's disease. J Neurochem. 2010;112:1045–1053. - PMC - PubMed
    1. Akiyama H, Barger S, Barnum S, Bradt B, Bauer J, Cole GM, Cooper NR, Eikelenboom P, Emmerling M, Fiebich BL, Finch CE, Frautschy S, Griffin WS, Hampel H, Hull M, Landreth G, Lue L, Mrak R, Mackenzie IR, McGeer PL, O'Banion MK, et al. Inflammation and Alzheimer's disease. Neurobiol Aging. 2000;21:383–421. - PMC - PubMed
    1. Aramburu J, Yaffe MB, López-Rodríguez C, Cantley LC, Hogan PG, Rao A. Affinity-driven peptide selection of an NFAT inhibitor more selective than cyclosporin A. Science. 1999;285:2129–2133. - PubMed

Publication types

MeSH terms