

Aneuploid cells are differentially susceptible to caspase-mediated death during embryonic cerebral cortical development
- PMID: 23152605
- PMCID: PMC3614491
- DOI: 10.1523/JNEUROSCI.3706-12.2012
Aneuploid cells are differentially susceptible to caspase-mediated death during embryonic cerebral cortical development
Abstract
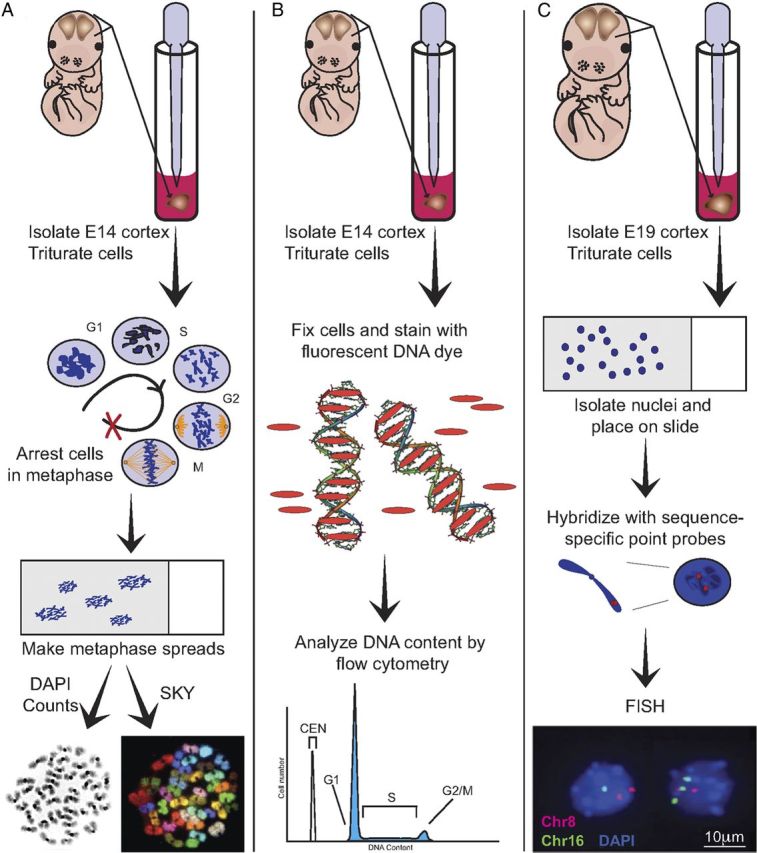
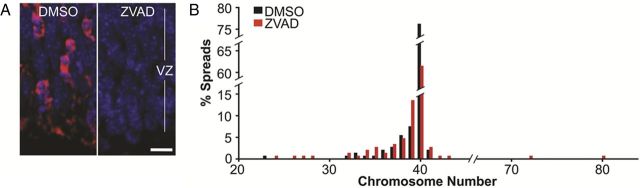
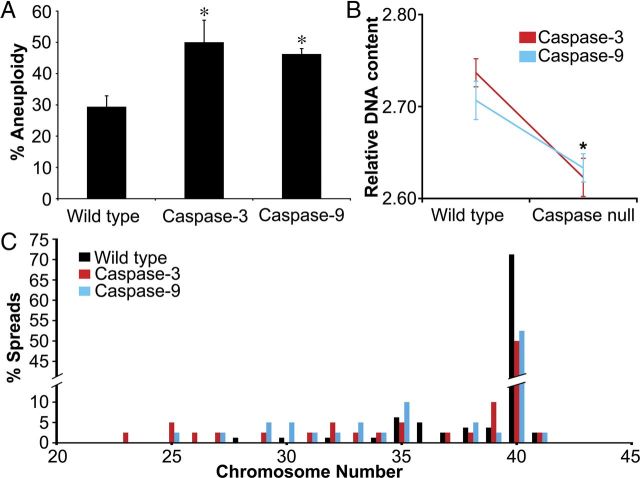
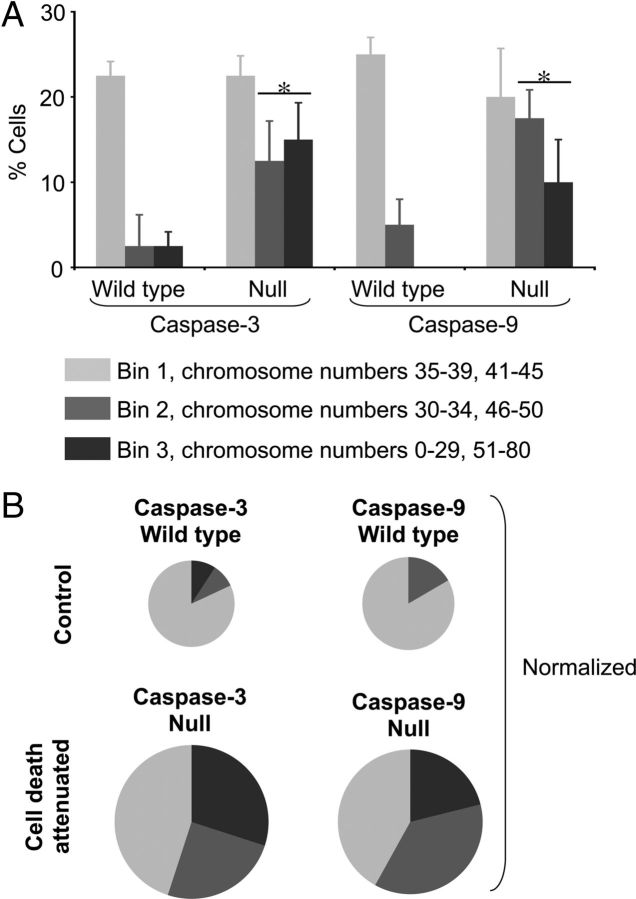
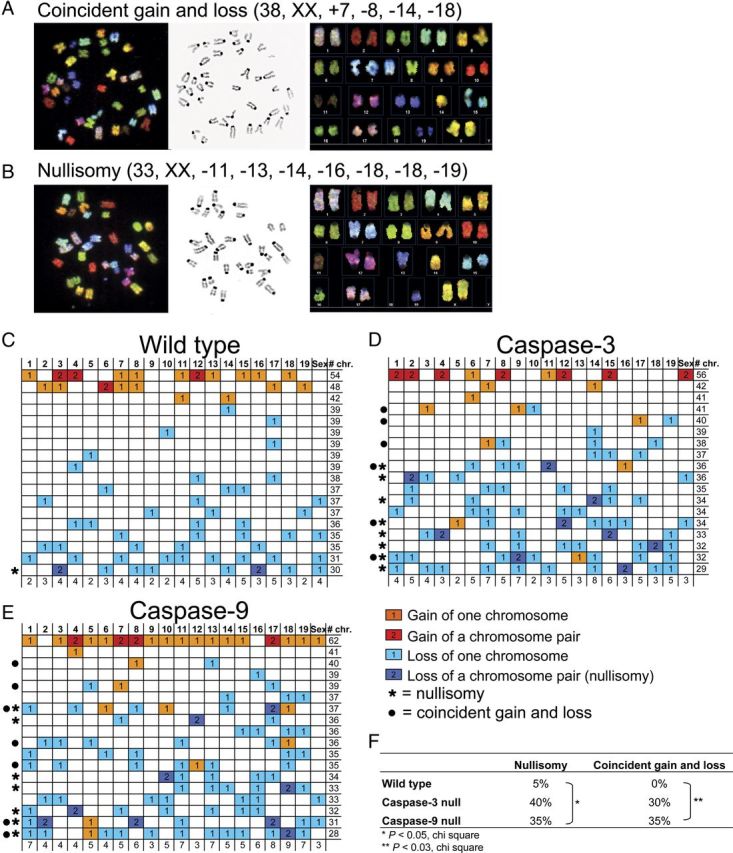
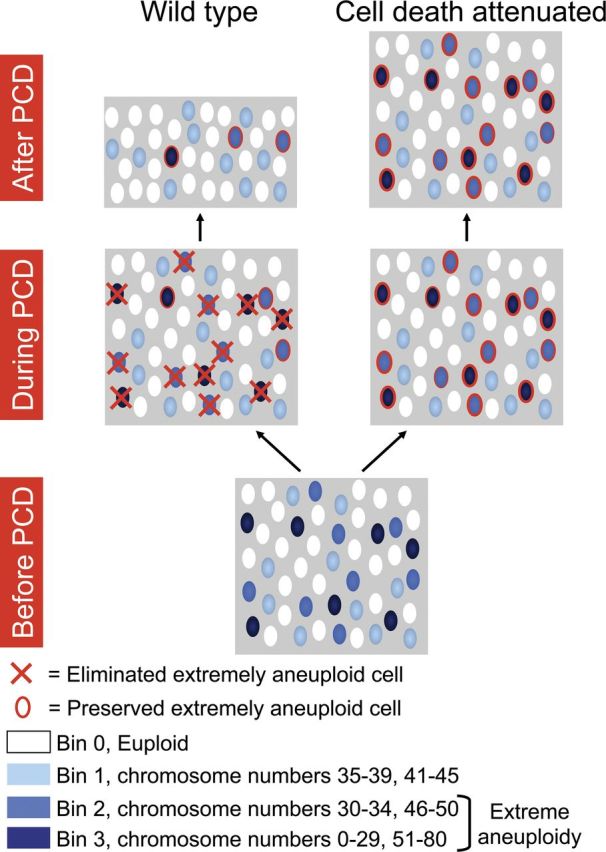
Neural progenitor cells, neurons, and glia of the normal vertebrate brain are diversely aneuploid, forming mosaics of intermixed aneuploid and euploid cells. The functional significance of neural mosaic aneuploidy is not known; however, the generation of aneuploidy during embryonic neurogenesis, coincident with caspase-dependent programmed cell death (PCD), suggests that a cell's karyotype could influence its survival within the CNS. To address this hypothesis, PCD in the mouse embryonic cerebral cortex was attenuated by global pharmacological inhibition of caspases or genetic removal of caspase-3 or caspase-9. The chromosomal repertoire of individual brain cells was then assessed by chromosome counting, spectral karyotyping, fluorescence in situ hybridization, and DNA content flow cytometry. Reducing PCD resulted in markedly enhanced mosaicism that was comprised of increased numbers of cells with the following: (1) numerical aneuploidy (chromosome losses or gains); (2) extreme forms of numerical aneuploidy (>5 chromosomes lost or gained); and (3) rare karyotypes, including those with coincident chromosome loss and gain, or absence of both members of a chromosome pair (nullisomy). Interestingly, mildly aneuploid (<5 chromosomes lost or gained) populations remained comparatively unchanged. These data demonstrate functional non-equivalence of distinguishable aneuploidies on neural cell survival, providing evidence that somatically generated, cell-autonomous genomic alterations have consequences for neural development and possibly other brain functions.
Figures
Similar articles
-
Chromosomal variation in neurons of the developing and adult mammalian nervous system.Proc Natl Acad Sci U S A. 2001 Nov 6;98(23):13361-6. doi: 10.1073/pnas.231487398. Proc Natl Acad Sci U S A. 2001. PMID: 11698687 Free PMC article.
-
Aneuploid mosaicism in the developing and adult cerebellar cortex.J Comp Neurol. 2008 Apr 20;507(6):1944-51. doi: 10.1002/cne.21648. J Comp Neurol. 2008. PMID: 18273885
-
Alteration of gene expression by chromosome loss in the postnatal mouse brain.J Neurosci. 2003 Jul 2;23(13):5599-606. doi: 10.1523/JNEUROSCI.23-13-05599.2003. J Neurosci. 2003. PMID: 12843262 Free PMC article.
-
The cytogenetic constitution of human blastocysts: insights from comprehensive chromosome screening strategies.Hum Reprod Update. 2019 Jan 1;25(1):15-33. doi: 10.1093/humupd/dmy036. Hum Reprod Update. 2019. PMID: 30395265 Review.
-
Mechanisms of aneuploidy induction in human oogenesis and early embryogenesis.Cytogenet Genome Res. 2005;111(3-4):237-44. doi: 10.1159/000086894. Cytogenet Genome Res. 2005. PMID: 16192699 Review.
Cited by
-
Assessment of copy number variations in the brain genome of schizophrenia patients.Mol Cytogenet. 2015 Jul 1;8:46. doi: 10.1186/s13039-015-0144-5. eCollection 2015. Mol Cytogenet. 2015. PMID: 26136833 Free PMC article.
-
Novel subcellular localization of the DNA helicase Twinkle at the kinetochore complex during mitosis in neuronal-like progenitor cells.Histochem Cell Biol. 2016 Mar;145(3):275-86. doi: 10.1007/s00418-015-1388-1. Epub 2015 Dec 17. Histochem Cell Biol. 2016. PMID: 26678504 Free PMC article.
-
Submegabase copy number variations arise during cerebral cortical neurogenesis as revealed by single-cell whole-genome sequencing.Proc Natl Acad Sci U S A. 2018 Oct 16;115(42):10804-10809. doi: 10.1073/pnas.1812702115. Epub 2018 Sep 27. Proc Natl Acad Sci U S A. 2018. PMID: 30262650 Free PMC article.
-
Chromosome instability and aneuploidy in the mammalian brain.Chromosome Res. 2023 Nov 1;31(4):32. doi: 10.1007/s10577-023-09740-w. Chromosome Res. 2023. PMID: 37910282 Free PMC article. Review.
-
Role of Trisomy 21 Mosaicism in Sporadic and Familial Alzheimer's Disease.Curr Alzheimer Res. 2016;13(1):7-17. doi: 10.2174/156720501301151207100616. Curr Alzheimer Res. 2016. PMID: 26651340 Free PMC article. Review.
References
-
- Armstrong RC, Aja T, Xiang J, Gaur S, Krebs JF, Hoang K, Bai X, Korsmeyer SJ, Karanewsky DS, Fritz LC, Tomaselli KJ. Fas-induced activation of the cell death-related protease CPP32 Is inhibited by Bcl-2 and by ICE family protease inhibitors. J Biol Chem. 1996;271:16850–16855. - PubMed
-
- Barch MJ, Knutsen T, and Spurbeck JL. The AGT cytogenetics laboratory manual. Philadelphia: Lippincott; 1997.
-
- Barnes DE, Stamp G, Rosewell I, Denzel A, Lindahl T. Targeted disruption of the gene encoding DNA ligase IV leads to lethality in embryonic mice. Curr Biol. 1998;8:1395–1398. - PubMed
-
- Blaschke AJ, Staley K, Chun J. Widespread programmed cell death in proliferative and postmitotic regions of the fetal cerebral cortex. Development. 1996;122:1165–1174. - PubMed
-
- Blaschke AJ, Weiner JA, Chun J. Programmed cell death is a universal feature of embryonic and postnatal neuroproliferative regions throughout the central nervous system. J Comp Neurol. 1998;396:39–50. - PubMed
Publication types
MeSH terms
Substances
Grants and funding
LinkOut - more resources
Full Text Sources
Other Literature Sources
Molecular Biology Databases
Research Materials