

Statistical object data analysis of taxonomic trees from human microbiome data
- PMID: 23152838
- PMCID: PMC3494672
- DOI: 10.1371/journal.pone.0048996
Statistical object data analysis of taxonomic trees from human microbiome data
Abstract
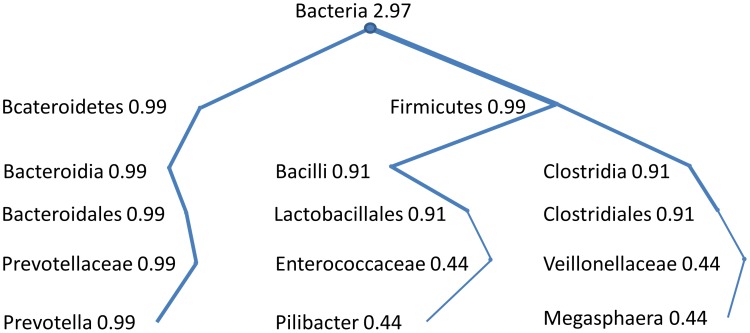
Human microbiome research characterizes the microbial content of samples from human habitats to learn how interactions between bacteria and their host might impact human health. In this work a novel parametric statistical inference method based on object-oriented data analysis (OODA) for analyzing HMP data is proposed. OODA is an emerging area of statistical inference where the goal is to apply statistical methods to objects such as functions, images, and graphs or trees. The data objects that pertain to this work are taxonomic trees of bacteria built from analysis of 16S rRNA gene sequences (e.g. using RDP); there is one such object for each biological sample analyzed. Our goal is to model and formally compare a set of trees. The contribution of our work is threefold: first, a weighted tree structure to analyze RDP data is introduced; second, using a probability measure to model a set of taxonomic trees, we introduce an approximate MLE procedure for estimating model parameters and we derive LRT statistics for comparing the distributions of two metagenomic populations; and third the Jumpstart HMP data is analyzed using the proposed model providing novel insights and future directions of analysis.
Conflict of interest statement
Figures
 with
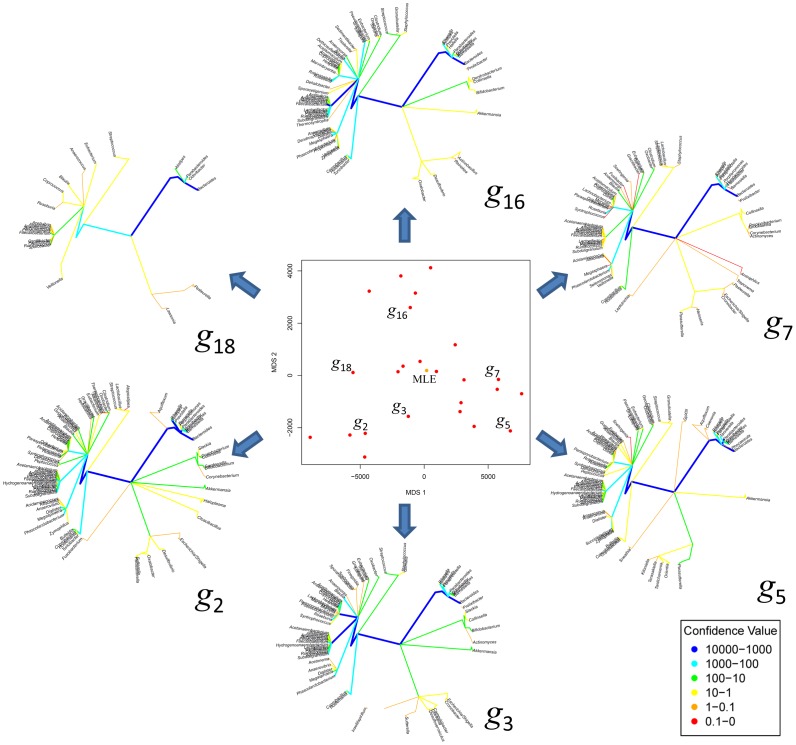
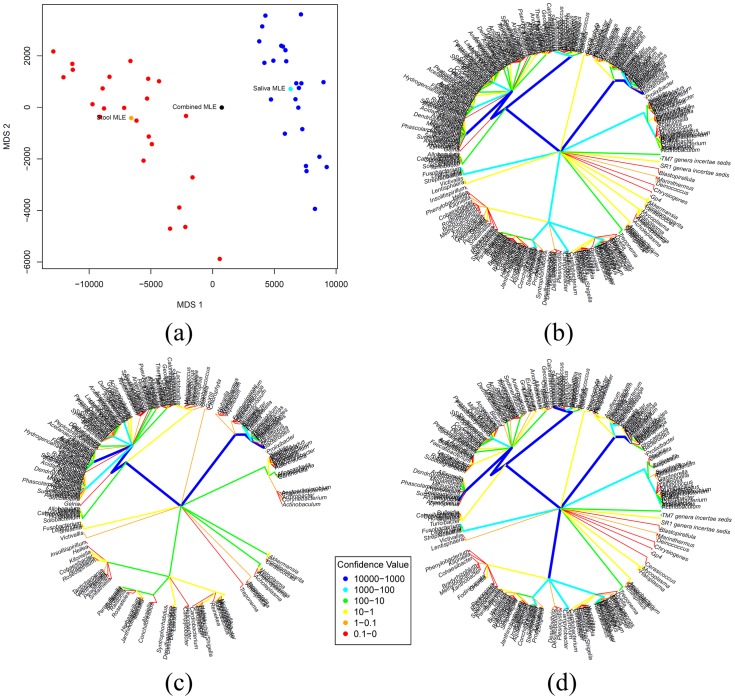
with  = {2, 3, 5, 7, 16, 18} and these are shown around the MDS plot to illustrate how the tree structure varies. The tree branches are color-coded to represent their weight values (sum of confidence) according to the reference table at the bottom left side of the plot. Blue denote the branches with the highest confidence among all while red denote the branches with lowest confidence. Note here that the tip of each branch represents a genus, and the location of each genus is the same on all trees.
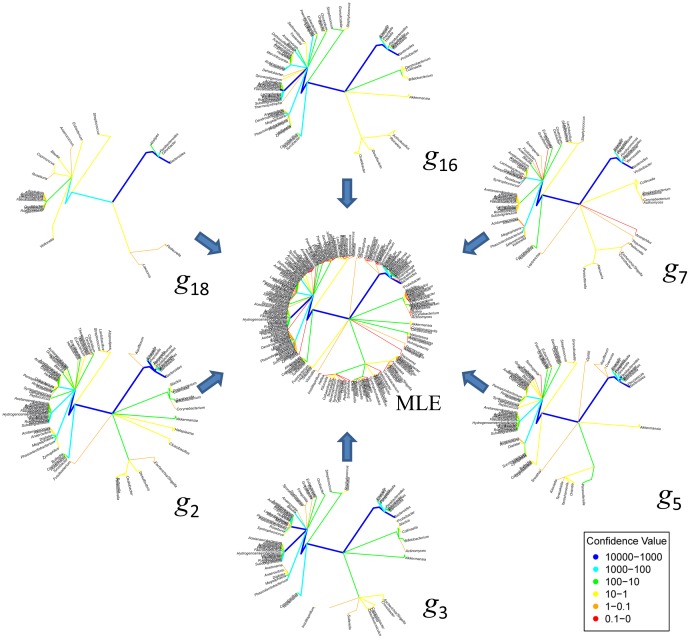
 with
with  = {2, 3, 5, 7, 16, 18}) are displayed around the MLE tree to illustrate some of tree structures represented by the MLE tree.
References
-
- Schloss PD (2008) Evaluating different approaches that test whether microbial communities have the same structure. ISME J 2: 265–275. - PubMed
Publication types
MeSH terms
Substances
Grants and funding
LinkOut - more resources
Full Text Sources
Research Materials
