. 2012 Nov 16:12:216.
doi: 10.1186/1471-2229-12-216.

Co-expression analysis identifies putative targets for CBP60g and SARD1 regulation

Affiliations

Co-expression analysis identifies putative targets for CBP60g and SARD1 regulation

William Truman et al. BMC Plant Biol. .

Abstract

Background: Salicylic acid is a critical signalling component in plant defence responses. In Arabidopsis, isochorismate synthase encoded by SID2 is essential for the biosynthesis of salicylic acid in response to biotic challenges. Recently, both the calmodulin binding protein CBP60g and its closest homolog, the non-calmodulin binding SARD1, have been shown to bind to the promoter region of SID2. Loss of both CBP60g and SARD1 severely impacts the plants ability to produce SA in response to bacterial inoculation and renders the plant susceptible to infection. In an electrophoretic mobility shift assay CBP60g and SARD1 were shown to bind specifically to a 10mer oligonucleotide with the sequence GAAATTTTGG.

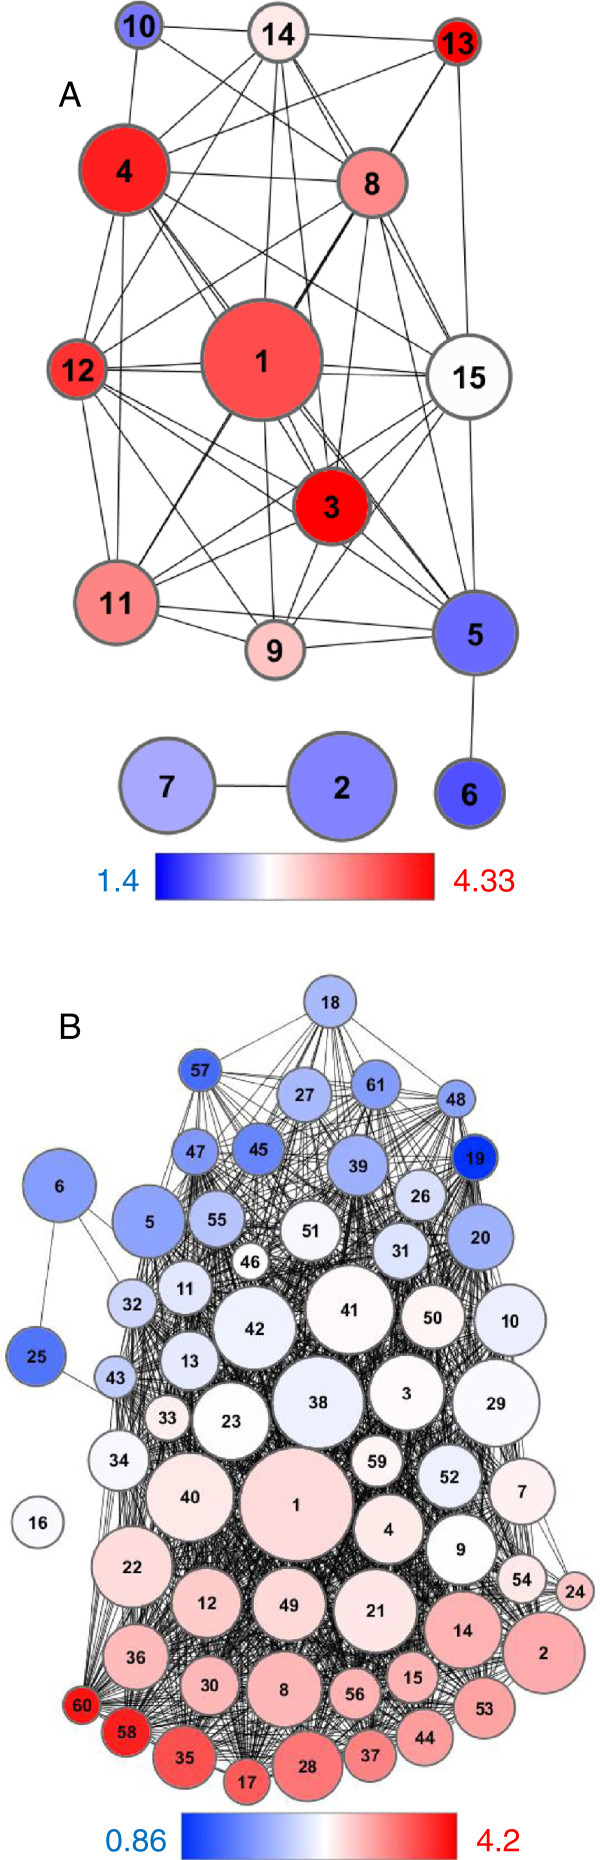
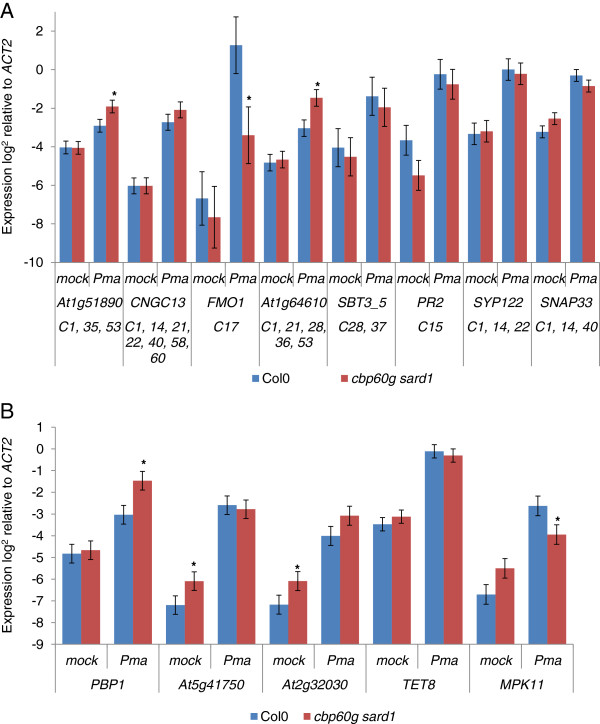
Results: Gene expression profiling on a custom microarray identified a set of genes, like SID2, down-regulated in cbp60g sard1 mutant plants. Co-expression analysis across a defined set of ATH1 full genome microarray experiments expanded this gene set; clustering analysis was then applied to group densely interconnected genes. A stringent threshold for co-expression identified two related calmodulin-like genes tightly associated with SID2. SID2 was found to cluster with genes whose promoter regions were significantly enriched with GAAATT motifs. Genes clustering with SID2 were found to be down-regulated in the cbp60g sard1 double mutant. Representative genes from other clusters enriched with the GAAATT motif were found to be variously down-regulated, unchanged or up-regulated in the double mutant. A previously characterised co-expression between SID2 and WRKY28 was not reproduced in this analysis but was contained within a subset of the experiments where SID2 was co-expressed with CBP60g or SARD1.

Conclusion: Putative components of the CBP60g SARD1 signalling network have been uncovered by co-expression analysis. In addition to genes whose regulation is similar to that of SID2 some are repressed by CBP60g and SARD1.


Figures

Figure 1
Figure 1
CBP60g, SARD1 and SID2 are co-expressed in response to MAMPs treatment and Pma ES4326 infection. Wildtype Col-0 Arabidopsis plants were treated with 1 μM flg22, Pma ES4326 (OD600 = 0.01) or mock treated with water. qPCR data from two biological replicates were combined using a mixed linear model and the expression relative to Actin2 calculated. The log2 ratio of treatment relative to mock is plotted with error bars representing the standard error of the difference between means. (A) With flg22 the Pearson correlation coefficient for CBP60g:SID2 was 0.92 and 0.66 for SARD1:SID2. (B) Following Pma ES4326 inoculation the Pearson correlation coefficient values are 0.64 for CBP60g:SID2 and 0.93 for SARD1:SID2.
Figure 2
Figure 2
Significant SID2:CBP60g/SARD1 correlation is observed in numerous publicly available microarray datasets. Affymetrix ATH1 array experiments were RMA normalised and the Spearman rank correlation coefficient calculated between probesets representing SID2 (262177_at) and CBP60g (246821_at) and SARD1 (260046_at) plotted. Darker points represent experiments where at least one correlation has a p-value no greater than 0.05. Highlighted experiments represent: (a-c) assorted MAMPs treatments; (d-e) plastid function; (f) oomycete infection; (g) SA and ABA signalling mutants; (h) exocyst component mutants; (i) potassium starvation.
Figure 3
Figure 3
Clusters of genes with GAAATT enriched promoters identified within the CBP60g / SARD1 co-expression network. 45 genes down-regulated in cbp60g, sard1 or cbp60g sard1 mutants were used to seed a co-expression network. (A) In experiment #1 a Spearman rank correlation coefficient threshold of 0.8 defined a network of 128 probesets. DPClus formed 15 overlapping clusters. (B) In experiment #2 a correlation threshold of 0.7 defined a network of 518 probesets which were organised into 61 overlapping clusters. Circles represent clusters of genes and edges represent correlation between members of different clusters. The number of genes in a cluster is proportionate to the size of the circle. The colour of the cluster reflects the average number of GAAATT motifs within the 1500 bp promoter region of cluster members, red indicates an over-representation, blue under-representation and white the genome average.
Figure 4
Figure 4
SID2 is tightly co-expressed with SARD1 and calmodulin-like genes with GAAATT abundant promoters. (A) The internal structure of cluster 3 from experiment #1. Edges between genes show correlation above the threshold of 0.8 with thickness proportional to the magnitude of correlation. Genes are coloured according to the number of GAAATT motifs present in the 1500 bp promoter region from white for genes with 0 motifs to red for a maximum of 7. (B) POBO analysis of GAAATT motif frequency in the 1500 bp upstream of transcription start sites. 1000 pseudoclusters of six genes were generated both from within cluster 3 and the genome background; jagged lines show the motif frequencies from which a fitted curve was derived. GAAATT motifs were found to be significantly over-represented with a p-value < 0.0001. (C) qRT-PCR measurement of gene expression 24 hpi Pma ES4326 inoculation (OD600 =0.01). Data from four or five biological replicates were merged using a mixed linear model and the mean log2 ratio to Actin2 expression plotted along with the standard error. Asterisks denote a significant differential expression between wildtype and the cbp60g sard1 mutant with p-value ≤ 0.05 from a two-tailed t-test.
Figure 5
Figure 5
An expanded SID2 regulon contains CBP60g, SARD1 and a variety of defence genes with GAAATT rich promoters. (A) The internal structure of cluster 2 from experiment #2. Edges between genes show correlation above the threshold of 0.7 with thickness proportional to the magnitude of correlation. Genes are coloured according to the number of GAAATT motifs present in the 1500 bp promoter region from white for genes with 0 motifs to red for a maximum of 7. (B) POBO analysis of GAAATT motif frequency in the 1500 bp upstream of transcription start sites. 1000 pseudoclusters of 30 genes were generated both from within cluster 2 and the genome background; jagged lines show the motif frequencies from which a fitted curve was derived. GAAATT motifs were found to be significantly over-represented with a p-value < 0.0001. (C) qRT-PCR measurement of gene expression 24 hpi Pma ES4326 inoculation (OD600 =0.01). Data from five biological replicates were merged using a mixed linear model and the mean log2 ratio to Actin2 expression plotted along with the standard error. Asterisks denote significant differential expression between wildtype and the cbp60g sard1 mutant with p-value ≤ 0.05 from a two-tailed t-test.
Figure 6
Figure 6
The SID2 regulon is enriched with known cis-elements and novel motifs. POBO analysis of motif distribution in 1500 bp promoters from experiment #2 cluster 2. 1000 pseudoclusters of 30 genes were generated both from within cluster 2 and the genome background; jagged lines show the motif frequencies from which a fitted curve was derived. (A-C) CCTNNNNNNNTCC motifs are significantly over-represented with a p-value < 0.0001 though CCT and TCC motifs are significantly under-represented in the cluster. (D-E) Different versions of the W-box consensus sequence binding site for WRKY transcription factors and (F) the defined WRKY28 binding site are significantly over-represented in cluster 2.
Figure 7
Figure 7
Putative targets for CBP60g / SARD1 regulation are repressed in cbp60g sard1 plants. Expression of candidate genes with promoters containing multiple GAAATT motifs from the 14 clusters, other than cluster 2, most significantly enriched for GAAATT motifs in experiment #2. (A) Candidates from clusters 1, 14, 15, 17, 21, 22, 28, 35, 36, 37, 40, 53, 58, 60. (B) Candidates from cluster 8. qRT-PCR measurement of gene expression 24 hpi Pma ES4326 inoculation (OD600 =0.01). Data from five biological replicates were merged using a mixed linear model and the mean log2 ratio to Actin2 expression plotted along with the standard error. Asterisks denote a significant differential expression between wildtype and the cbp60g sard1 mutant with p-value ≤ 0.05 from a two-tailed t-test.
Figure 8
Figure 8
WRKY28:SID2 co-expression is restricted to a subset of conditions engendering CBP60g/SARD1:SID2 co-expression. Spearman rank correlation coefficient between SID2 and CBP60g, SARD1 and WRKY28 plotted for the 182 microarray experiments where at least one correlation was significant (p-value ≤ 0.05). Correlation values were sorted by a self-organising maps algorithm and subjected to complete linkage hierarchical clustering. Positive correlations are yellow while negative correlations are blue.

References

    1. Jones JDG, Dangl JL. The plant immune system. Nature. 2006;444:323–329. - PubMed
    1. Tsuda K, Sato M, Stoddard T, Glazebrook J, Katagiri F. Network properties of robust immunity in plants. PLoS Genet. 2009;5:e1000772. - PMC - PubMed
    1. Glazebrook J. Contrasting mechanisms of defense against biotrophic and necrotrophic pathogens. Annu Rev Phytopathol. 2005;43:205–227. - PubMed
    1. Métraux JP, Signer H, Ryals J, Ward E, Wyss-Benz M, Gaudin J, Raschdorf K, Schmid E, Blum W, Inverardi B. Increase in salicylic Acid at the onset of systemic acquired resistance in cucumber. Science. 1990;250:1004–1006. - PubMed
    1. Loake G, Grant M. Salicylic acid in plant defence–the players and protagonists. Curr Opin Plant Biol. 2007;10:466–472. - PubMed

Publication types

MeSH terms