. 2012 Nov 13;22(5):571-84.
doi: 10.1016/j.ccr.2012.08.013.

Dependency of colorectal cancer on a TGF-β-driven program in stromal cells for metastasis initiation

Affiliations

Dependency of colorectal cancer on a TGF-β-driven program in stromal cells for metastasis initiation

Alexandre Calon et al. Cancer Cell. .

Abstract

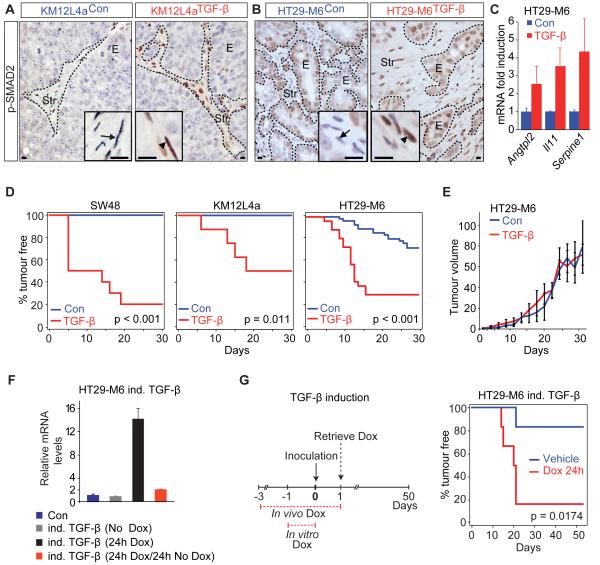
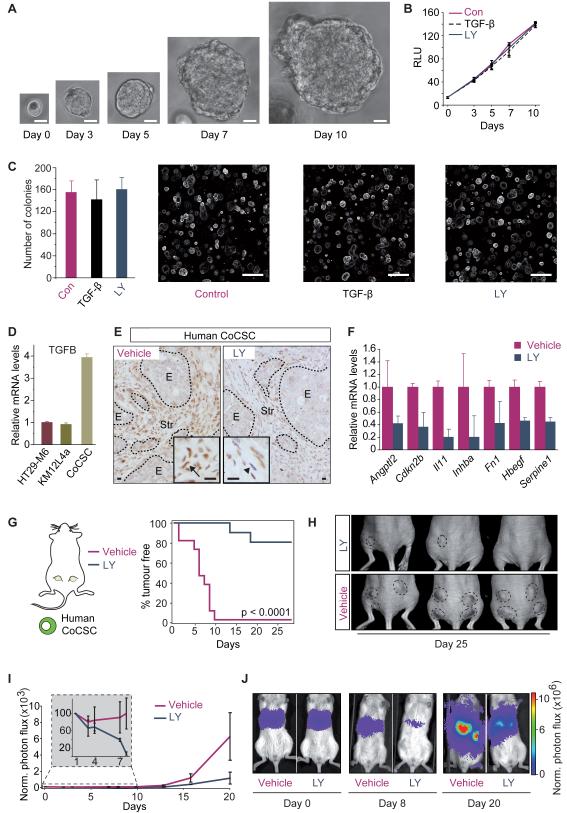
A large proportion of colorectal cancers (CRCs) display mutational inactivation of the TGF-β pathway, yet, paradoxically, they are characterized by elevated TGF-β production. Here, we unveil a prometastatic program induced by TGF-β in the microenvironment that associates with a high risk of CRC relapse upon treatment. The activity of TGF-β on stromal cells increases the efficiency of organ colonization by CRC cells, whereas mice treated with a pharmacological inhibitor of TGFBR1 are resilient to metastasis formation. Secretion of IL11 by TGF-β-stimulated cancer-associated fibroblasts (CAFs) triggers GP130/STAT3 signaling in tumor cells. This crosstalk confers a survival advantage to metastatic cells. The dependency on the TGF-β stromal program for metastasis initiation could be exploited to improve the diagnosis and treatment of CRC.


Figures

Figure 1
Figure 1. High TGF-beta expression predicts CRC relapse
A, Overall TGFB mRNA expression in CRC stages I-IV. Values are z-scores with standard deviation (SD) from the mean (**: p<0.01, two-tailed Student’s t test). B, Smooth function correlates overall TGFB mRNA expression with relative risk of recurrence. Stage IV patients were excluded from this analysis. Red dashed lines: 95% confidence interval (CI). Blue dashed lines: thresholds for patient selection into groups with low (L; blue: 44 patients), medium (M; gray; 86 patients) and high (H; red: 134 patients) TGFB expression. p-values and increase in HR per each increase in standard deviation of expression (+1 SD) are shown. C, Kaplan-Meier plots display recurrence-free survival (RFS) over time for groups defined in B. D, as in C, but grouped by AJCC stage. HR and p-values compare RFS over time for patients grouped according to TGFB levels (L vs M, L vs H and M vs H). E, Cox proportional hazards multivariate analysis of TGF-beta expression and AJCC staging in identifying patients that remained disease-free upon therapy. See also Figure S1
Figure 2
Figure 2. Stromal TGF-beta gene signatures predict recurrence
A, Gene set enrichment analyses (GSEA) of TGF-beta response signatures (TBRS) of Fibroblasts (F-TBRS), T-Cells (T-TBRS), Macrophages (Ma-TBRS) or Endothelial cells (End-TBRS) in carcinoma versus adenoma samples. ES: enrichment score, NES: normalized enrichment score, FDR: false discovery rate. B, Cross-correlations between TGFB, F-TBRS, T-TBRS, Ma-TBRS and End-TBRS in the patient cohort. Blue dots: patients. R: Correlation coefficients. Values are z-scores (*: p<0.05, ***: p<0.001). C, p-Values and increase in HR per each increase in expression (+1SD) in F-TBRS, T-TBRS, Ma-TBRS and End-TBRS, obtained via Cox proportional Hazards model. D, Kaplan-Meier plots display RFS of patients with low (blue), medium (gray) or high (red) F-TBRS, T-TBRS, Ma-TBRS or End-TBRS expression levels. E, FACS-purification of cell populations from primary CRC samples, enriched in the indicated cell types. F, Heat map shows relative expression levels of marker genes for epithelial (blue), leukocyte (red), endothelial (orange) cells and cancer-associated fibroblasts (green) in each cell population, Values are normalized intensities, log2. G, Relative expression of each TBRS in cell populations from (F). Whiskers represent minimum (Vmin) and maximum (Vmax) values. (log2; *: p<0.05, **: p<0.01, Student’s t test). H, Relative expression in each cell population of genes within the T-TBRS, Ma-TBRS, End-TBRS or F-TBRS associating positively with relapse. Whiskers: Vmin, Vmax (log2; *: p<0.05, **: p<0.01, Student’s t test). See also Figure S2.
Figure 3
Figure 3. TGF-beta activated stroma induces tumour initiation
A, B, nuclear p-SMAD2 reactivity (arrowheads) in subcutaneous (subQ) tumours derived from TGF-beta secreting KM12L4a (A) or HT-29M6 (B) CRC cells and control cells. E: epithelial cells, Str: stromal cells. Scale bars = 10μm. C, Relative expression of some stromal TBRS genes in tumours from (B). Values are mean ±SEM (n = 3). D, Kaplan-Meier plots display tumour-free survival (TFS) for mice injected subQ with 3×10⁴ TGF-beta secreting (red) or control cell lines (blue); SW48 (n = 8); KM12L4a (n = 8); HT29-M6 cells (n = 25 (red), n = 39 (blue). E, Growth over time for HT29-M6TGF-β (red; n = 13) and HT29-M6Con (blue; n = 16) derived tumours. Day 1: day of first detection. Values are mean ±SEM. F, Relative TGFB mRNA levels in HT29-M6 cells expressing active TGF-beta through a doxycycline (Dox) inducible promoter (HT29-M6 ind. TGF-beta) compared to control cells (Con, blue). Inducible TGF-beta cells were non-treated (gray), treated with Dox for 24h (black), or treated with Dox for 24h followed by 24h of Dox withdrawal prior to qRT-PCR (red). Values are mean ±SD (n = 3). G, Inducible TGF-beta cells were either untreated (blue) or pretreated with Dox in vitro 24h before subQ inoculation (3×10⁴ cells; n = 6). Recipient mice received either Dox (red) or vehicle (blue) in drinking water ad libitum during 3 days prior to injection. Kaplan-Meier curves show TFS when TGF-beta secretion is induced in vivo for 24h (red) compared to control cells (blue). See also Figure S3
Figure 4
Figure 4. TGF-beta activated stroma induces CRC metastasis
A, Pie charts for submucosal or lymphatic vessel invasion in KM12L4aconand KM12L4aTGF-β-derived caecum tumours. B, Incidence of metastases in mice from (A) (**: p<0.01; Fisher’s exact test). C-D, Number of liver metastases after intrasplenic (IS) injection with (C) 105 KM12L4aCon or KM12L4aTGF-β cells; or (D) 2×10⁶ HT29-M6Con or HT29-M6TGF-b cells *: p<0.05, two-tailed Student’s t test). Whiskers: Vmin, Vmax. Representative livers are shown from injections with 5×10⁵ cells (C) or 2×10⁶ cells (D). Arrows: metastatic nodules. E, Incidence of metastasis induced in (C), (D) and S4C. F, Normalized bioluminescence over time after injection of 5×10⁵ KM12L4aCon or KM12L4aTGF-β cells. Intensities were normalized to day 0 and arbitrarily set to 100. Values are mean ±SEM (*: p<0.05). G-H, Inducible TGF-beta cells and recipient mice were treated as in Figure 3G. G, Bioluminescence over time after injection with 5×10⁵ cells. Values, normalized as in (F), are mean ±SEM (*: p<0.05). H, Number of liver metastases at time of sacrifice. Whiskers: Vmin, Vmax (*: p<0.05, two-tailed Student’s t test). I-J, p-SMAD2 staining in liver metastasis generated from KM12L4aCon (I) or KM12L4aTGF-β cells (J). E: epithelial cells, Str: stromal cells. Scale bars = 10μm. K, Relative expression levels of some stromal TBRS genes in dissected metastatic nodules. Values are mean ±SEM (n = 3). See also Figure S4
Figure 5
Figure 5. Inhibition of TGF-beta response in the stroma blocks tumour initiation
A, In vitro expansion of a CoCSC. Scale bars = 10μm. B, In vitro growth of human CoCSCs upon addition of TGF-beta or LY2157299 (LY). Values are mean relative absorbance (RLU) over time ±SD (n = 3). C, Number of organoids from human CoCSCs treated with TGF-beta or LY2157299. Values are mean ±SD (n = 3). Representative images are shown. Scale bars = 200μm. D, qRT-PCR for TGFB in the indicated CRC cells. Values are mean ±SEM. E, p-SMAD2 staining in subQ tumours derived from CoCSCs injected in NSG mice treated with LY2157299 for 3 days (LY; right panel, arrowhead) or untreated (left panel; arrow). E: epithelial cells, Str: stromal cells. Scale bars = 10μm. F, Relative expression of some stromal TBRS genes in tumours from (E). Values are mean ±SEM (n = 2) G, Kaplan–Meier curves show TFS for mice injected subQ with 106 CoCSCs. Mice received LY2157299 (blue) or vehicle (purple) from 3 days prior to inoculation until sacrifice (n = 12). H, Representative images from (G). I, Bioluminescence over time after IS inoculation of 5×10⁵ CoCSCs cells in NSG mice treated as in (G). Values, normalized as in Figure 4F, are mean ±SEM. J, Representative images from (I).
Figure 6
Figure 6. Metastasis initiation driven by stromal TGF-beta signalling requires GP130/STAT3 in tumour cells
A, p-STAT3 staining in subQ tumours derived from control (HT29-M6shCon, left panel) cells, HT29-M6 cells that secrete TGF-beta (HT29-M6shCon/TGF-β; middle panel) or HT29-M6 shGP130 cells that also secrete TGF-beta (HT29-M6shGP130/TGF-β; right panel). Arrows point to epithelial tumour cell nuclei. E: epithelial cells, Str: stromal cells. Scale bars = 50μm. B, Kaplan–Meier curves for mice injected with 3×10⁴ HT29-M6shGP130/TGF-β (blue) or HT29-M6shCon/TGF-β cells (red; n = 16). C, Growth kinetics of HT29-M6shGP130/TGF-β (blue) and HT29-M6shCon/TGF-β (red) subQ xenografts (n = 5). Day 1: day of first detection. Values are mean ±SEM. D, Bioluminescence over time after IS inoculation of 2×10⁶ HT29-M6shCon/TGF-β (red) or HT29-M6shGP130/TGF-β (blue) cells. Values, normalized as in Figure 4F, are mean ±SEM (n = 4; *: p<0.05). E, Bioluminescence from (D) 24h after IS injection. Whiskers: Vmin, Vmax (**: p<0.01, two-tailed Student’s t test). F, In vivo measurement of caspase3/7 activity in CRC cells 6h post IS injection. Values are mean ratios between caspase activity and total cellular bioluminescence ±SEM (n = 3). See also Figure S5
Figure 7
Figure 7. Stromal TGF-beta-induced IL11 increases metastasis initiation by CRC cells
A, Western blot of p-STAT3 and total STAT3 in CRC epithelial cells upon addition of rhIL11. B, Cross-correlation analysis between expression of IL11 response signature (IL11RS) and TGFB or F-TBRS in the CRC patient cohort. Blue dots: patients. R are indicated. (***: p<0.001). C, Smooth function correlates IL11RS expression with relative risk of recurrence, stage IV patients excluded. Red dashed lines: 95% CI. Blue dashed lines: thresholds for selection into groups with low (L; blue, 42 patients), medium (M; gray, 88 patients) and high (H; red, 134 patients) IL11RS expression levels. HR (+1SD) and p-values are indicated. D, Kaplan-Meier plots with RFS for groups defined in (C). E, IL11 mRNA levels in the indicated tumour cell populations from six patients. qRT-PCR values are mean ±SD. F, Relative expression levels of IL11 mRNA in liver metastasis from IS injection with KM12L4aCon (blue) or KM12L4aTGF-β (red) (n = 3); and from subQ tumours generated by CoCSCs treated with either vehicle (Con, purple) or LY2157299 (dark blue) (n = 2). Values are mean ±SEM. G, Pie charts evaluate submucosal or lymphatic vessel invasion in KM12L4acon (n = 7) and KM12L4aIL11 (n = 8)-derived caecum tumours. Table shows incidence of metastasis in mice (**: p<0.01, Fisher’s exact test). H-L, Mice inoculated IS with 2×10⁶ HT29-M6Con cells (blue; n = 7) or HT29-M6IL11 cells (gray; n = 4). H, Quantification and representative pictures of liver metastases (arrows) at time of sacrifice (*: p<0.05, two-tailed Student’s t test). Whiskers: Vmin, Vmax. I, Bioluminescence over time after IS inoculation. Values, normalized as in Figure 4F, are mean ±SEM (**: p<0.01). J, Representative images from (I). K, Bioluminescence 24h after injection in mice from (I). Whiskers: Vmin, Vmax (**: p<0.01, two-tailed Student’s t test). L, In vivo caspase3/7 activity 6 hours post IS injection of HT29-M6con or HT29-M6IL11 cells. Values are mean ±SEM. See also Figure S6

Comment in

References

    1. Alarcon C, Zaromytidou AI, Xi Q, Gao S, Yu J, Fujisawa S, Barlas A, Miller AN, Manova-Todorova K, Macias MJ, et al. Nuclear CDKs drive Smad transcriptional activation and turnover in BMP and TGF-beta pathways. Cell. 2009;139:757–769. - PMC - PubMed
    1. Becker C, Fantini MC, Schramm C, Lehr HA, Wirtz S, Nikolaev A, Burg J, Strand S, Kiesslich R, Huber S, et al. TGF-beta suppresses tumor progression in colon cancer by inhibition of IL-6 trans-signaling. Immunity. 2004;21:491–501. - PubMed
    1. Bhatia M, Davenport V, Cairo MS. The role of interleukin-11 to prevent chemotherapy-induced thrombocytopenia in patients with solid tumors, lymphoma, acute myeloid leukemia and bone marrow failure syndromes. Leuk Lymphoma. 2007;48:9–15. - PubMed
    1. Bos PD, Zhang XH, Nadal C, Shu W, Gomis RR, Nguyen DX, Minn AJ, van de Vijver MJ, Gerald WL, Foekens JA, Massague J. Genes that mediate breast cancer metastasis to the brain. Nature. 2009;459:1005–1009. - PMC - PubMed
    1. Bueno L, de Alwis DP, Pitou C, Yingling J, Lahn M, Glatt S, Troconiz IF. Semi-mechanistic modelling of the tumour growth inhibitory effects of LY2157299, a new type I receptor TGF-beta kinase antagonist, in mice. Eur J Cancer. 2008;44:142–150. - PubMed

Publication types

MeSH terms

Substances