An official website of the United States government
The .gov means it’s official.
Federal government websites often end in .gov or .mil. Before
sharing sensitive information, make sure you’re on a federal
government site.
The site is secure.
The https:// ensures that you are connecting to the
official website and that any information you provide is encrypted
and transmitted securely.
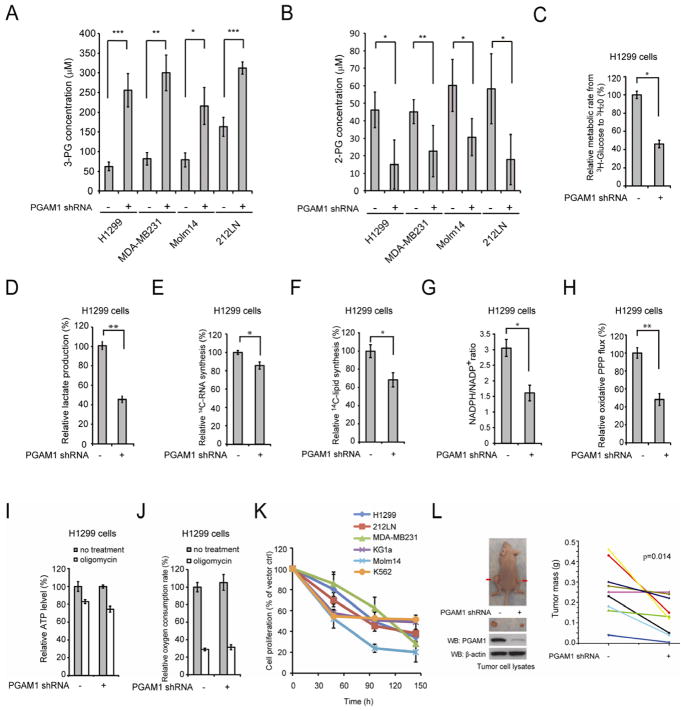
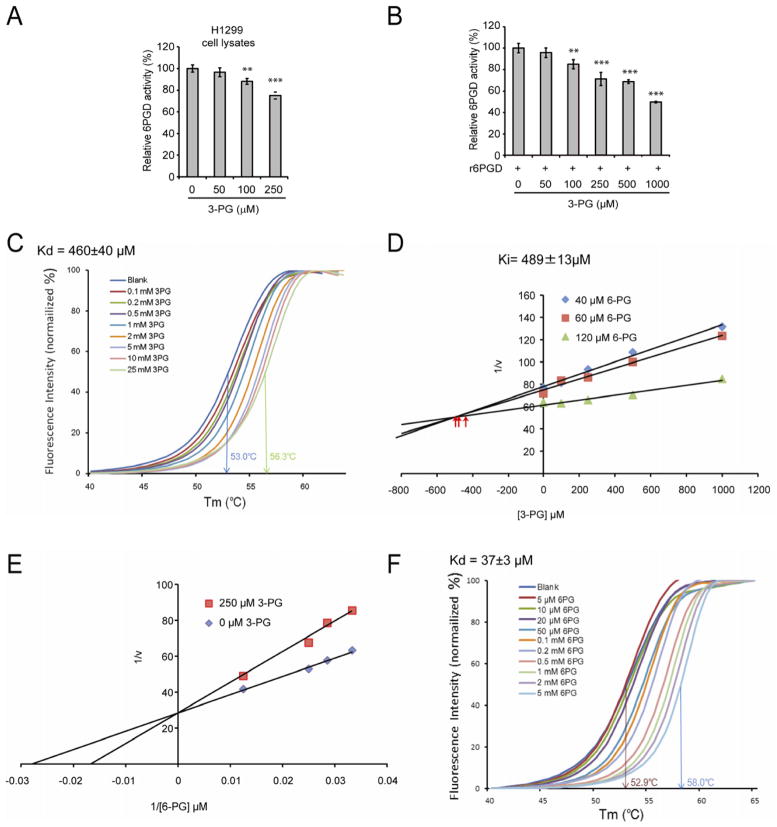
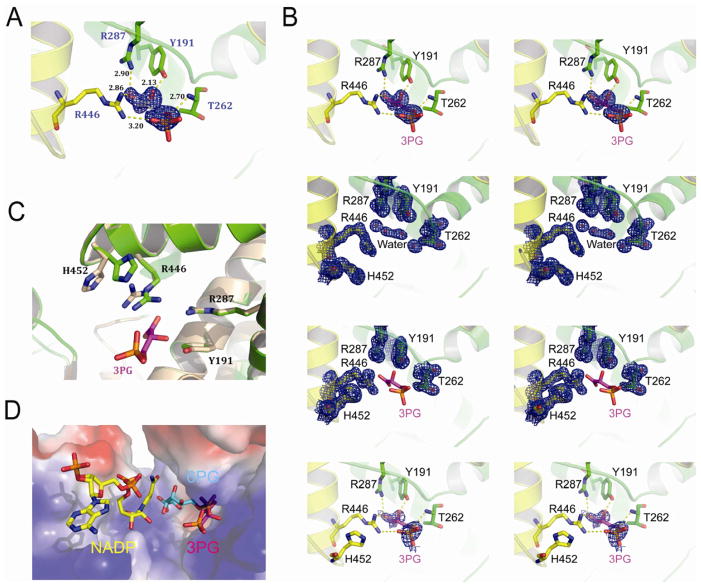
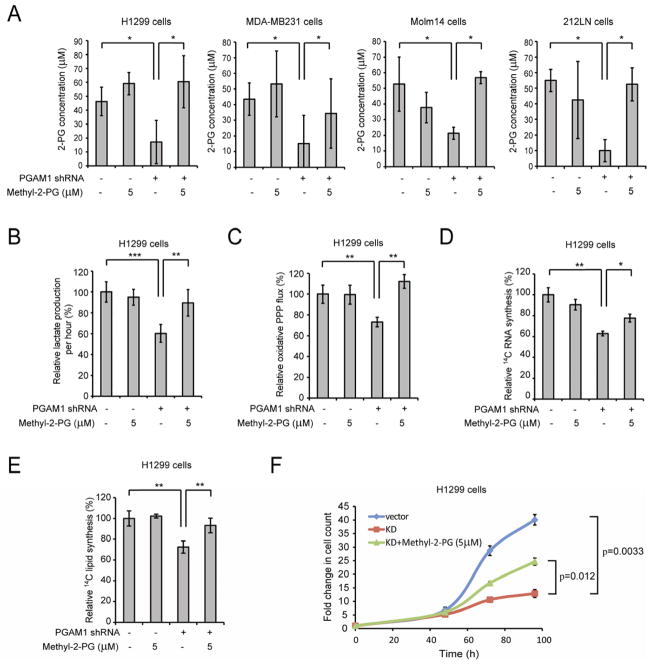
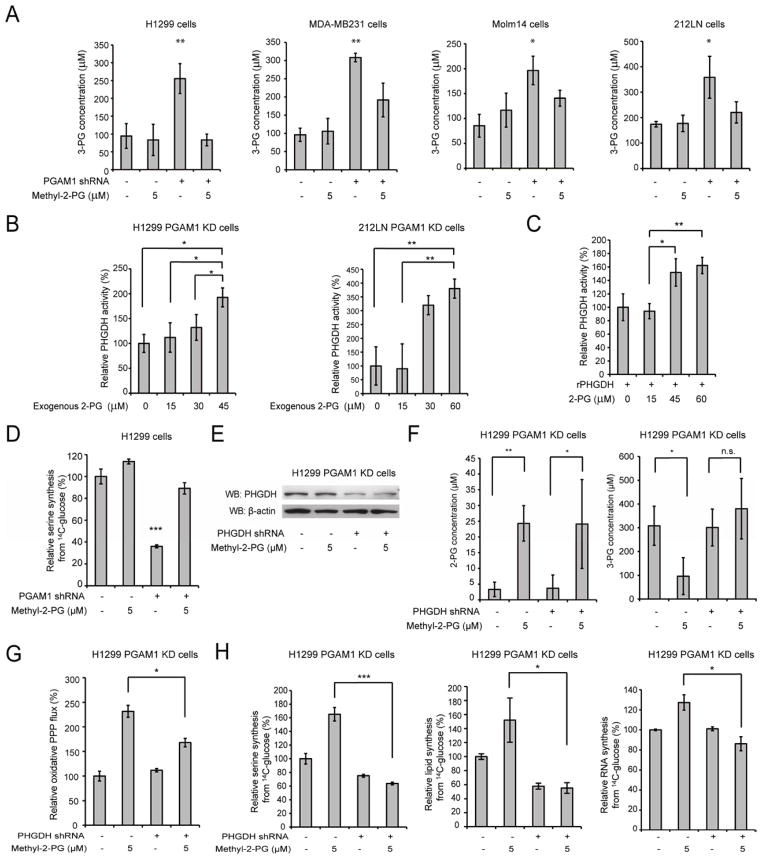
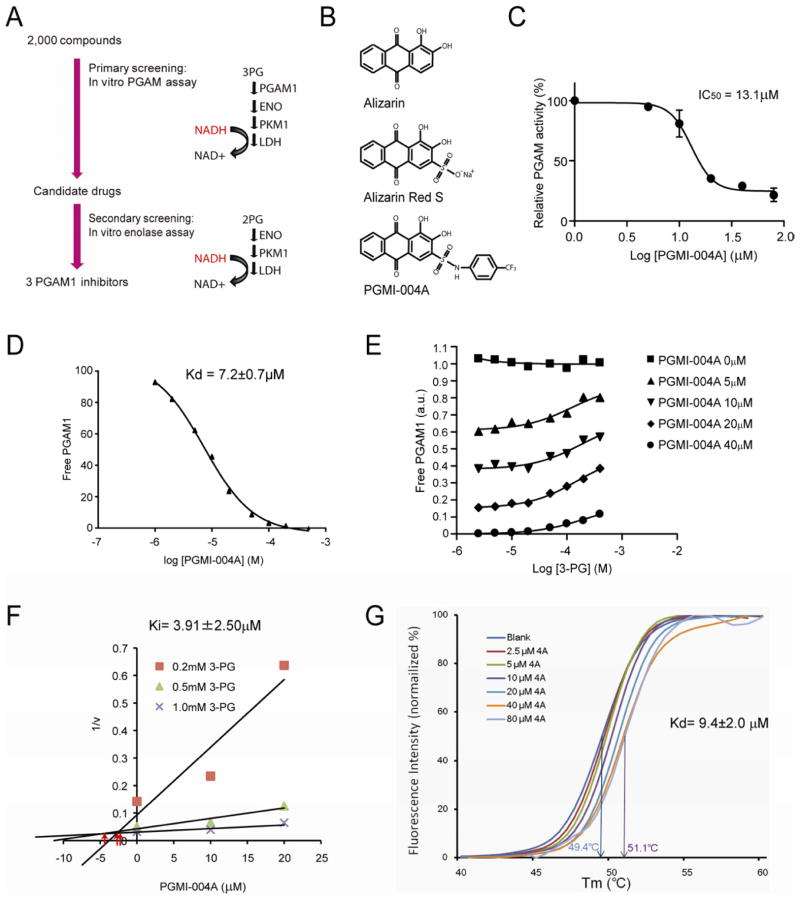
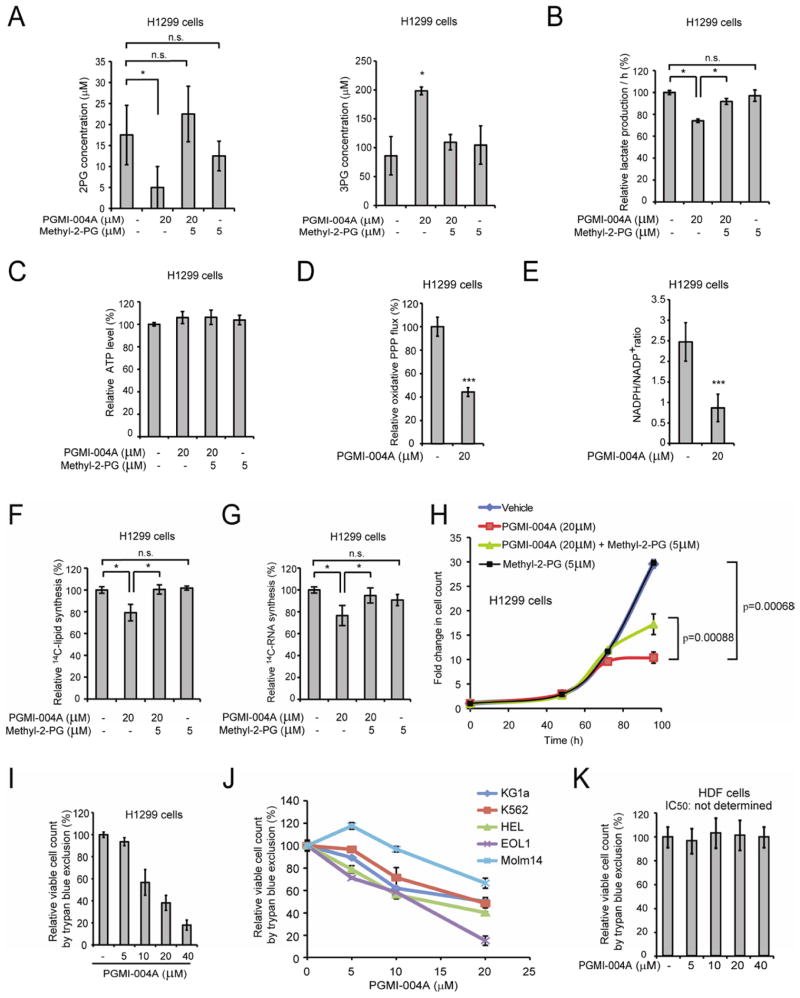
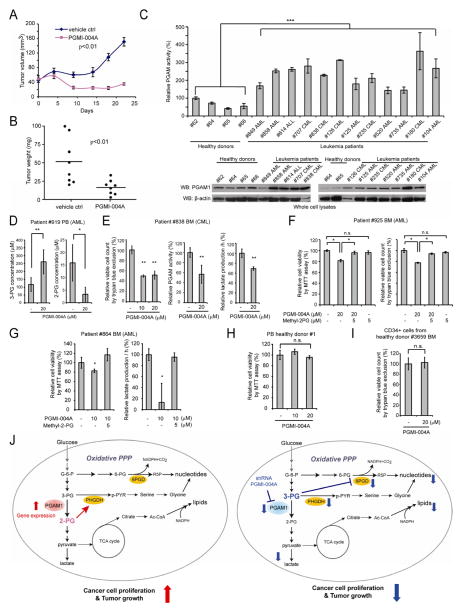
It is unclear how cancer cells coordinate glycolysis and biosynthesis to support rapidly growing tumors. We found that the glycolytic enzyme phosphoglycerate mutase 1 (PGAM1), commonly upregulated in human cancers due to loss of TP53, contributes to biosynthesis regulation in part by controlling intracellular levels of its substrate, 3-phosphoglycerate (3-PG), and product, 2-phosphoglycerate (2-PG). 3-PG binds to and inhibits 6-phosphogluconate dehydrogenase in the oxidative pentose phosphate pathway (PPP), while 2-PG activates 3-phosphoglycerate dehydrogenase to provide feedback control of 3-PG levels. Inhibition of PGAM1 by shRNA or a small molecule inhibitor PGMI-004A results in increased 3-PG and decreased 2-PG levels in cancer cells, leading to significantly decreased glycolysis, PPP flux and biosynthesis, as well as attenuated cell proliferation and tumor growth.
Figure 1. PGAM1 controls intracellular 3-PG and 2-PG levels in cancer cells and is important…
Figure 1. PGAM1 controls intracellular 3-PG and 2-PG levels in cancer cells and is important for glycolysis and anabolic biosynthesis, as well as cell proliferation and tumor growth
(A–B) Intracellular concentrations of 3-PG and 2-PG were determined in diverse PGAM1 knockdown cancer cells and compared to control cells. Detailed concentrations are listed in Table S3. (C–J) H1299 cells with stable knockdown of PGAM1 and control cells harboring an empty vector were tested for glycolytic rate (C), lactate production (D), RNA biosynthesis (E), lipogenesis (F), NADPH/NADP+ ratio (G), and oxidative PPP flux (H). The intracellular ATP levels (I) and oxygen consumption rate (J) in the presence or absence of 100nM oligomycin (ATP synthase inhibitor) were also tested. (K) Cell proliferation rates were determined by cell counting in diverse human cancer (H1299, 212LN and MDA-MB231) and leukemia (KG1a, Molm14 and K562) cells with stable knockdown of PGAM1, which were normalized to the corresponding control cells harboring an empty vector. (L) Stable knockdown of PGAM1 by shRNA attenuates tumor growth potential of H1299 cells in xenograft nude mice. Left: Dissected tumors (indicated by red arrows) in a representative nude mouse and expression of PGAM1 in tumor lysates are shown. Right: PGAM1 knockdown cells show significantly reduced tumor formation in xenograft nude mice compared to cells harboring empty vector control (p values were determined by a two-tailed paired Student’s t test). The error bars represent mean values +/− SD from three replicates of each sample (*: 0.01
Figure 2. Attenuation of PGAM1 results in…
Figure 2. Attenuation of PGAM1 results in increased intracellular levels of 3-PG, which binds to…
Figure 2. Attenuation of PGAM1 results in increased intracellular levels of 3-PG, which binds to and inhibits 6PGD by competing with its substrate 6-PG
(A–B) Enzyme activity of 6PGD in H1299 cell lysates (A) or recombinant 6PGD (r6PGD) (B) was determined in the presence of increasing concentrations of 3-PG. Relative 6PGD activity was normalized to the control samples without 3-PG treatment. 3-PG levels in control H1299 cells with empty vector and PGAM1 knockdown are 62.5±10.8μM and 256±41.9μM, respectively. The error bars represent mean values +/− SD from three replicates of each sample (**: 0.01
Figure 3. Co-crystallization analysis of 3-PG mediated…
Figure 3. Co-crystallization analysis of 3-PG mediated inhibition of 6PGD
(A) Stereo view of the…
Figure 3. Co-crystallization analysis of 3-PG mediated inhibition of 6PGD
(A) Stereo view of the Fo-Fc electron density map contoured at 3.0 σ around 3-PG. The Fo-Fc density map is shown as blue mesh. Residues of 6PGD interact with 3-PG are shown in stick. (B) Upper top: Stereo view of the unbiased Fo-Fc electron density map contoured at 3.0 σ around 3PG. The Fo-Fc density map is shown as blue mesh. Residues interact with 3-PG are shown in stick. Lower top: Stereo view of the 2Fo-Fc electron density map of 6PGD apo-form contoured at 1.2 σ at 3-PG binding pocket in the same orientation as in Figure 2A. The 2Fo-Fc density map is shown as blue mesh. Upper bottom: Stereo view of the 2Fo-Fc electron density map of 6PGD-3-PG complex contoured at 1.2 σ at 3-PG binding pocket in the same orientation as in Figure 3A and 3C. The 2Fo-Fc density map is shown as blue mesh. Lower bottom: Stereo view of simulated-annealing omit map contoured at 0.8 σ around 3-PG. The omit density map is shown as blue mesh. (C) Structure comparison of the 6PGD apo-form (wheat) and the 6PGD-3-PG complex (green). Arg 446 and His 452 in the 6PGD-3-PG complex structure show different conformation. (D) Surface electrostatic potential of the substrate-binding pocket of 6PGD. The bound 3-PG (pink) competes with 6-PG (blue) but not NADP (yellow) in the active site. The model was built by aligning structures of 6PGD-NADP (PDB code: 2JKV), 6PGD-6-PG (PDB code: 3FWN) and 6PGD-3PG. See also Table S4.
Figure 4. Rescue of reduced 2-PG levels…
Figure 4. Rescue of reduced 2-PG levels in PGAM1 knockdown cells reverses the phenotypes due…
Figure 4. Rescue of reduced 2-PG levels in PGAM1 knockdown cells reverses the phenotypes due to attenuation of PGAM1
(A) 2-PG levels in diverse cancer cells with stable knockdown of PGAM1 were determined in the presence and absence of cell permeable methyl-2-PG. (B–F) H1299 cells with stable knockdown of PGAM1 were tested for lactate production (B), oxidative PPP flux (C) and biosynthesis of RNA (D) and lipids (E), as well as cell proliferation (F) in the presence and absence of methyl-2-PG. The error bars represent mean values +/− SD from three replicates of each sample (*: 0.01
Figure 5. Rescue of reduced 2-PG levels…
Figure 5. Rescue of reduced 2-PG levels due to PGAM1 attenuation results in decreased 3-PG…
Figure 5. Rescue of reduced 2-PG levels due to PGAM1 attenuation results in decreased 3-PG levels by activating PHGDH
(A) 3-PG levels in diverse cancer cells with stable knockdown of PGAM1 were determined in the presence and absence of methyl-2-PG. (B–C) Enzyme activity of PHGDH in PGAM1 knockdown H1299 (B; left) or 212LN (B; right) cell lysates and recombinant PHGDH (rPHGDH) (C) were determined in the presence of increasing concentrations of 2-PG. Relative enzyme activity was normalized to the control samples without 2-PG treatment. 2-PG levels in control H1299 cells with empty vector and PGAM1 knockdown cells are 46.2±10.2μM and 15.0±14.1μM, respectively, while 2-PG levels in 212LN cells with empty vector and stable knockdown of PGAM1 are 58.3±20.1μM and 17.8±14.4μM, respectively. (D) Serine biosynthesis rate of H1299 cells with stable knockdown of PGAM1 was determined by measuring 14C incorporation into serine from 14C-glucose in the presence and absence of methyl-2-PG. Relative serine biosynthesis was normalized to control cells harboring an empty vector without methyl-2-PG treatment. (E) Western blot result shows shRNA-mediated knockdown of PHGDH in H1299 cells with stable knockdown of PGAM1 in the presence or absence of methyl-2-PG treatment. (F) 2-PG (left) and 3-PG (right) levels in PGAM1 knockdown cells upon PHGDH knockdown were determined in the presence and absence of methyl-2-PG. (G–H) PGAM1 stable knockdown cells treated with or without shRNA targeting PHGDH were tested for PPP flux (G) as well as biosynthesis of serine, lipids and RNA (H; left, middle and right, respectively) in the presence and absence of methyl-2-PG. The error bars represent mean values +/− SD from three replicates of each sample (*: 0.01
Figure 6. Identification and characterization of small…
Figure 6. Identification and characterization of small molecule PGAM1 inhibitor, PGMI-004A
(A) Schematic representation of…
Figure 6. Identification and characterization of small molecule PGAM1 inhibitor, PGMI-004A
(A) Schematic representation of the primary and secondary screening strategies to identify lead compounds as PGAM1 inhibitors. (B) Structure of alizarin and its derivatives alizarin Red S and PGAM inhibitor (PGMI)-004A. (C) PGMI-004A inhibits PGAM1 with an IC50 of 13.1 μM, which was determined by incubating purified human PGAM1 proteins with increasing concentrations of PGMI-004A. The error bars represent mean values +/− SD from three replicates of each sample. (D) Kd value was determined as 7.2±0.7 μM by incubating purified human PGAM1 proteins with increasing concentrations of PGMI-004A. The fluorescence intensity (Ex: 280nm, Em: 350nm) from Tryptophan was measured (Schauerte and Gafni, 1989). (E) Competitive binding assay of PGMI-004A with recombinant PGAM1 protein in the presence of increasing concentrations of PGAM1 substrate 3-PG. Increased free PGAM1 was determined by an increase in fluorescence intensity. (F) Dixon plot analysis of PGAM1 enzyme assay in the presence of different concentrations of PGMI-004A and 3-PG. The reaction velocity (v) was determined by the rate of the decrease in fluorescence (ex: 340nm, em: 460nm) by NADH oxidation. Ki was determined to be 3.91±2.50μM. (G) Thermal shift melting curves of PGAM1 and PGMI-004A. Thermal shift assay was performed to examine the protein (PGAM1) and “ligand” (inhibitor PGMI-004A) interaction. Change of melting temperature (Tm) in a dose-dependent manner at concentrations from 2.5μM to 80μM demonstrates that PGMI-004A directly binds to the protein. Kd for PGAM1-PGMI-004A interaction was determined to be 9.4±2.0μM. See also Figure S4.
Figure 7. Inhibition of PGAM1 by PGMI-004A…
Figure 7. Inhibition of PGAM1 by PGMI-004A reveals that PGAM1 enzyme activity is important for…
Figure 7. Inhibition of PGAM1 by PGMI-004A reveals that PGAM1 enzyme activity is important for regulation of 3-PG and 2-PG levels and coordination of glycolysis and biosynthesis to promote cancer cell proliferation
(A) 2-PG (left) and 3-PG (right) levels in H1299 cells treated with or without PGMI-004A were determined in the presence and absence of methyl-2-PG. (B–C) Lactate production (B) and intracellular ATP levels (C) in H1299 cells treated with or without PGMI-004A were determined in the presence and absence of methyl-2-PG. (D–E) H1299 cells treated with or without PGMI-004A were tested for oxidative PPP flux (D) and NADPH/NADP+ ratio (E). (F–H) H1299 cells treated with or without PGMI-004A were tested for biosynthesis of lipids (F) and RNA (G), as well as cell proliferation (H) in the presence and absence of methyl-2-PG. (I–K) Cell viability of H1299 cells (I), diverse human leukemia cells (J) and control human dermal fibroblasts (HDF) cells (K) in the presence of increasing concentrations of PGMI-004A. Cell viability was determined by trypan blue exclusion. The error bars represent mean values +/− SD from three replicates of each sample (*: 0.01
Figure 8. PGMI-004A treatment results in increased…
Figure 8. PGMI-004A treatment results in increased 3-PG and decreased 2-PG levels, and reduced cell…
Figure 8. PGMI-004A treatment results in increased 3-PG and decreased 2-PG levels, and reduced cell proliferation of primary leukemia cells from human patients, as well as attenuated tumor growth in xenograft nude mice in vivo
(A–B) Tumor growth (A) and tumor size (B) in xenograft nude mice injected with H1299 cells were compared between the group of mice treated with PGMI-004A and the control group treated with vehicle control. p values were determined by a two-tailed Student’s t test. (C) PGAM1 protein expression (lower) and enzyme activity (upper) levels were examined using primary leukemia cells from diverse human patients with AML, CML and B-ALL and compared to control peripheral blood cells from healthy donors. (D) Effect of PGMI-004A treatment on 3-PG (left) and 2-PG (right) levels in human primary leukemia cells isolated from peripheral blood samples from a representative AML patient. (E) Effect of PGMI-004A treatment on cell viability (left), PGAM1 activity (middle) and lactate production (right) in human primary leukemia cells from a representative CML patient. (F–G) Effect of methyl-2-PG treatment on decreased cell viability (F; G left) and lactate production (G right) in PGMI-004A-treated human primary leukemia cells from AML patients. (H–I) PGMI-004A shows no toxicity in treatment (120h) of peripheral blood cells (H) and CD34+ cells isolated from bone marrow samples (I) from representative healthy human donors. (J) Proposed model: role of PGAM1 in cancer cell metabolism. Left: PGAM1 activity is upregulated in cancer cells to promote glycolysis and keep the intracellular 3-PG levels low, which in turn permits high levels of the PPP and biosynthesis to fulfill the request of rapidly growing tumors. PGAM1 also maintains the physiological levels of 2-PG to sustain PHGDH activity, which diverts 3-PG from glycolysis to serine synthesis and contributes to maintaining relatively low levels of 3-PG in cancer cells. These effects in concert provide a metabolic advantage to cancer cell proliferation and tumor growth. Right: When PGAM1 is inhibited, 3-PG levels are elevated, which in turn inhibit 6PGD and consequently the oxidative PPP and anabolic biosynthesis. At the same time, 2-PG is decreased to levels below the physiological concentrations, leading to decreased PHGDH activity, which facilitates 3-PG accumulation. Such metabolic changes result in attenuated cell proliferation and tumor development. The error bars represent mean values +/− SD from three replicates of each sample (*: 0.01
Chaneton B, Gottlieb E.Chaneton B, et al.Cancer Cell. 2012 Nov 13;22(5):565-6. doi: 10.1016/j.ccr.2012.10.014.Cancer Cell. 2012.PMID: 23153529
References
Cairns RA, Harris IS, Mak TW. Regulation of cancer cell metabolism. Nature reviews Cancer. 2011;11:85–95.
-
PubMed
Chen YY, Ko TP, Chen WH, Lo LP, Lin CH, Wang AH. Conformational changes associated with cofactor/substrate binding of 6-phosphogluconate dehydrogenase from Escherichia coli and Klebsiella pneumoniae: Implications for enzyme mechanism. J Struct Biol. 2010;169:25–35.
-
PubMed
Corcoran CA, Huang Y, Sheikh MS. The regulation of energy generating metabolic pathways by p53. Cancer biology & therapy. 2006;5:1610–1613.
-
PubMed
Elstrom RL, Bauer DE, Buzzai M, Karnauskas R, Harris MH, Plas DR, Zhuang H, Cinalli RM, Alavi A, Rudin CM, Thompson CB. Akt stimulates aerobic glycolysis in cancer cells. Cancer Res. 2004;64:3892–3899.
-
PubMed
Engel M, Mazurek S, Eigenbrodt E, Welter C. Phosphoglycerate mutase-derived polypeptide inhibits glycolytic flux and induces cell growth arrest in tumor cell lines. J Biol Chem. 2004;279:35803–35812.
-
PubMed