. 2012 Nov 13;22(5):601-14.
doi: 10.1016/j.ccr.2012.10.003.

Loss of the Par3 polarity protein promotes breast tumorigenesis and metastasis

Affiliations

Loss of the Par3 polarity protein promotes breast tumorigenesis and metastasis

Luke Martin McCaffrey et al. Cancer Cell. .

Erratum in

Abstract

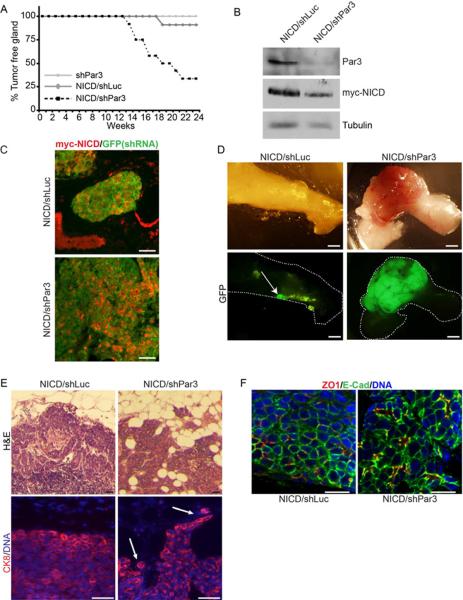
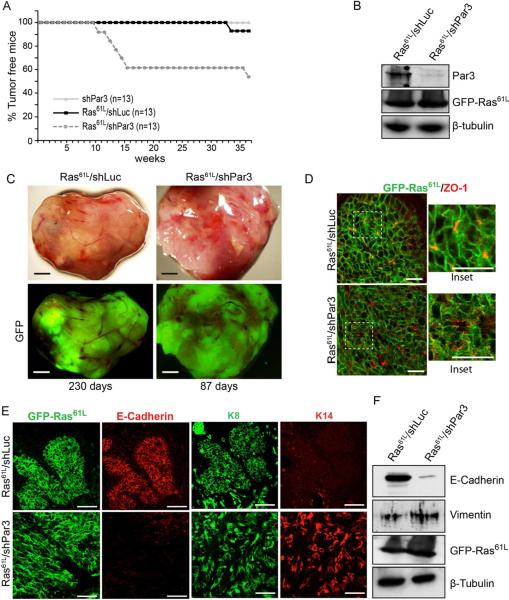
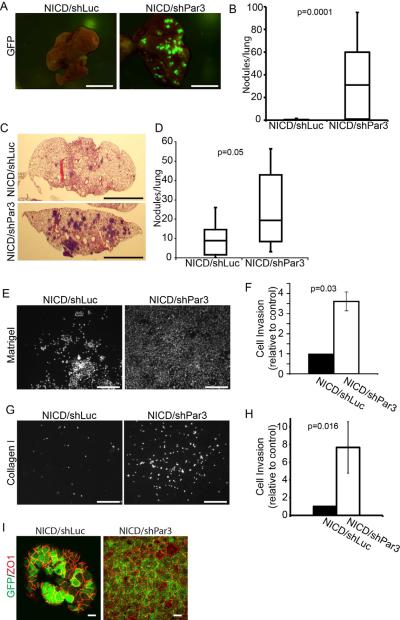
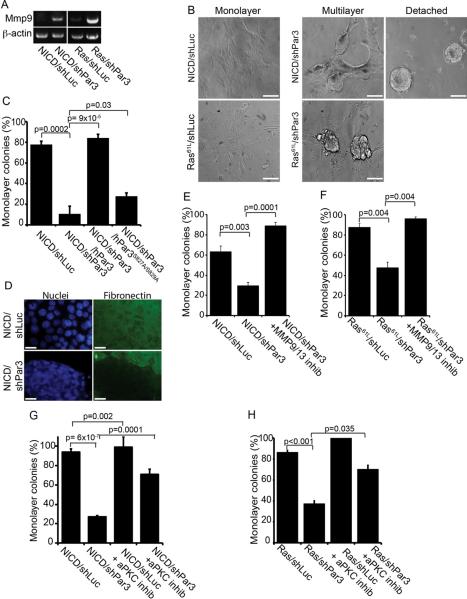
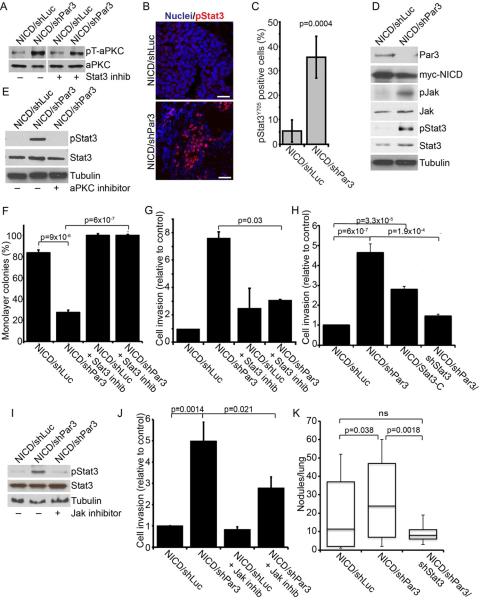
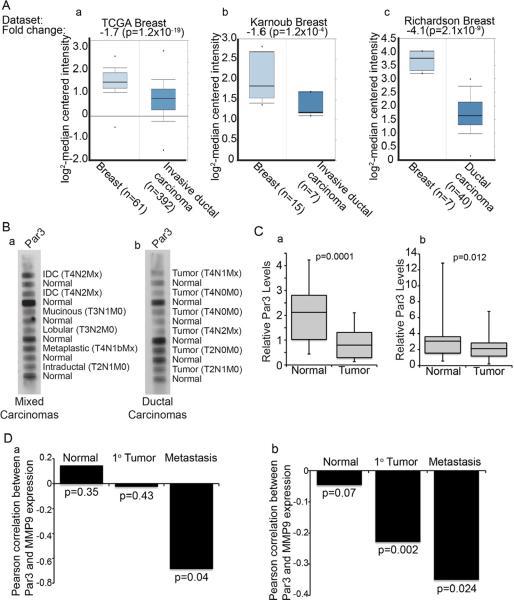
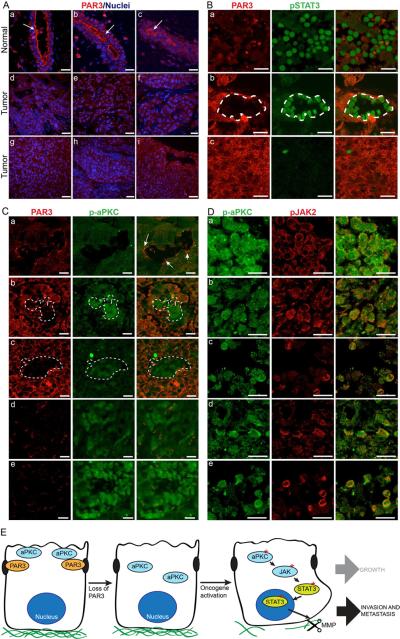
Loss of epithelial organization is a hallmark of carcinomas, but whether polarity regulates tumor growth and metastasis is poorly understood. To address this issue, we depleted the Par3 polarity gene by RNAi in combination with oncogenic Notch or Ras(61L) expression in the murine mammary gland. Par3 silencing dramatically reduced tumor latency in both models and produced invasive and metastatic tumors that retained epithelial marker expression. Par3 depletion was associated with induction of MMP9, destruction of the extracellular matrix, and invasion, all mediated by atypical PKC-dependant JAK/Stat3 activation. Importantly, Par3 expression is significantly reduced in human breast cancers, which correlates with active aPKC and Stat3. These data identify Par3 as a regulator of signaling pathways relevant to invasive breast cancer.


Figures

Figure 1
Figure 1
Loss of Par3 cooperates with NICD to promote mammary tumor formation (A) Kaplan-Meier (KM) curve of tumor-free status in mice transplanted with shPar3 (n=17), NICD/shLuc (n=11), or NICD/shPar3 (n=12) MECs. (B) Tumors arising from orthotopically transplanted myc-NICD/shLuc or myc-NICD/shPar3 MECs were immunoblotted for Par3, myc-NICD and tubulin. (C) Immunofluorescence staining of tumor sections for myc-NICD (red) and GFP (green), which marks cells expressing shRNA. (D) Tumors arising from NICD/shLuc or NICD/shPar3 transduced MECs. GFP is co-expressed with the shRNA and is used as a marker for transduction. Arrow indicates small non-palpable NICD/shLuc tumor, which were found in 7/11 fat pads. (E) Upper panels: Hematoxylin and Eosin (H&E) stained sections of the edges of NICD/shLuc and NICD/shPar3 tumors. Lower panels: Tissue sections of the tumor edge stained with cytokeratin 8 (CK8, red) and Hoechst 33258 (DNA, blue). Arrows show invading cells. (F) Immunofluorescence staining of tumor sections for E-cadherin, ZO1, and Hoeschst 33342 for DNA. Scale bars= 50 μm (C), 2 mm (D), 100 μm (E), 20 μm (F). See also Figure S1.
Figure 2
Figure 2
Loss of Par3 cooperates with Ras61L to promote mammary tumor formation (A) KM curve for mice transplanted with MECs expressing GFP/shPar3 (n=13), Ras61L/shLuc (n=13), or Ras61L/shPar3 (n=13). (B) Imunoblot of primary Ras61L /shLuc and Ras61L /shPar3 tumor lysates. (C) Micrographs of tumors from transplanted Ras61L/shLuc or Ras61L/shPar3 MECs. GFP indicates tumor cells are transduced with lentivirus. (D) Immunofluorescence staining of tumor sections for GFP-Ras61L (green) and ZO1 (red). (E) Immunofluorescence staining of tumor sections for GFP-Ras61L (green) and E-cadherin (red), or cytokeratin 8 (green) and cytokeratin 14 (red). (F) Western blot of primary Ras61L /shLuc and Ras61L /shPar3 tumor cell lysates. Scale bars = 500 μm (C), 50 μm (D) and (E). See also Figures S2.
Figure 3
Figure 3
Suppression of Par3 increases tumor invasion and metastasis (A) Whole mount GFP fluorescent images of lung metastases from tumor-bearing mice following orthotopic mammary gland transplants of MECs transduced with NICD/shLuc (n=14) and NICD/shPar3 (n=17; p=0.0001). (B) Box plots showing the number of metastatic nodules in lungs from (A). (C) H&E-stained sections of lungs following tail vein injections of 3×10⁵ MECs transduced with NICD/shLuc or NICD/shPar3. (D) Box plots showing the number of metastatic nodules in lungs (n=10) following systemic injections of transduced cells from (C). (E) Hoechst stained nuclei of NICD/shLuc or NICD/shPar3 MECs that invaded through the Matrigel pad and 8μm filter inserts after 72 h. (F) Quantification of (E) and results are average of 3 independent experiments. Error bars are 1 sem. (G) Same as (E), except invasion through collagen I gels. (H) Quantification of (G); results are means of 3 independent experiments. Error bars = sem. (I) Immunofluorescence staining of NICD/shLuc or NICD/shPar3 MECs that migrated through the Matrigel for GFP (green) and ZO1 (red). Scale bars = 1cm (A, C), 100 μm (E, G), 10 μm (I). See also Figures S3.
Figure 4
Figure 4
Loss of Par3 induces MMP expression and cell detachment in transformed mammary epithelial cells through activation of aPKC (A) RT-PCR on total RNA from tumor tissues expressing either NICD or Ras61L +/− shRNA against Par3, using primers for MMP9 and β-actin (control). (B) Primary MECs stably expressing NICD/shLuc, NICD/shPar3, Ras61L/shLuc or Ras61L/shPar3 were plated on fibronectin for 72 h, and imaged by DIC. Representative images of the various colony phenotypes are shown. Scale bars = 50 μm. (C) Quantification of cell detachment by MECs expressing NICD/shLuc, NICD/shPar3, and NICD/shPar3 with RNAi-resistant full-length human Par3, or mutant Par3S827A/S829A that does not bind aPKC. (D) IF staining of fibronectin under colonies of NICD/shLuc and NICD/shPar3 MECs. Scale bars = 10 μm. (E) Quantification of cell detachment for NICD/shLuc and NICD/shPar3 MECs +/− 400 pM of MMP Inhibitor I. (F) Quantification of cell detachment for Ras61L/shLuc and Ras61L/shPar3 MECs grown +/− 400 pM MMP9/13 inhibitor I. (G) Quantification of cell detachment for NICD/shLuc and NICD/shPar3 MECs +/− 40μg/ml of aPKC pseudosubstrate inhibitor. (H) Detachment of Ras61L/shLuc and Ras61L/shPar3 MECs grown +/− 40μg/ml aPKC inhibitor. Results are means of at least 3 independent cultures. Error bars = +/− 1sd. See also Figure S4 and Tables S1–S4.
Figure 5
Figure 5
Loss of Par3 activates Stat3 signaling through aPKC (A) Immunoblot of NICD/shLuc and NICD/shPar3 MEC lysates showing active phospho-aPKCT410/403 (pT-aPKC) and total aPKC protein levels +/− 50nM Stat3 inhibitor, Cucurbitacin I. (B) Immunofluorescence staining of NICD/shLuc or NICD/shPar3 tumor sections for pStat3Y705 (red) and nuclei (blue). Scale bars = 50 μm. (C) Quantification of pStat3Y705 positive cells in tumor sections (n=8). (D) Immunoblots of lysates from NICD/shLuc or NICD/shPar3 primary MECs. Phospho-antibodies were used to detect pJAKY1007/8 and pStat3Y705. (E) Immunoblots of NICD/shLuc or NICD/shPar3 MEC lysates +/− 40μg/ml aPKC inhibitor. (F) Quantification of cell detachment for NICD/shLuc and NICD/shPar3 MECs grown +/− 50 nM Cucurbitacin I. Results from 2 independent experiments. (G) Quantification of invasion of NICD/shLuc and NICD/shPar3 MECs through Matrigel, +/− 50 nM Cucurbitacin I. (H) Quantification of invasion of NICD/shLuc, NICD/shPar3, constitutively active Stat3-C, and NICD/shPar3/shStat3 MECs through Matrigel. (I) Immunoblots of NICD/shLuc or NICD/shPar3 MEC lysates +/− 10 nM JAK inhibitor, Pyridone 6. (J) Quantification of invasion of NICD/shLuc and NICD/shPar3 MECs through Matrigel, +/− 10 nM Jak inhibitor, Pyridone 6. (K) Quantification of lung nodules arising from NICD/shLuc, NICD/shPar3, and NICD/shPar3/shStat3 transformed MECs injected systemically. Five sections were examined from each lung of 5 mice for each treatment. Results are means of at least 3 independent cultures, unless otherwise noted. Error bars = +/− 1sd. See also Figure S5.
Figure 6
Figure 6
PAR3 expression is reduced in human breast cancer, correlating with elevated MMP9 expression (A) Microarray data showing relative levels of PARD3 gene expression for invasive ductal carcinomas versus matched normal breast tissue from TCGA (a), Karnoub (b) and Richardson (c) datasets (see Supplementary Methods for information on datasets). (B) Human tumor protein array membranes of mixed carcinomas (a) and ductal carcinomas (b) with matched normal adjacent tissue were immunoblotted for PAR3. IDC=Intraductal carcinoma. TNM classification values are given for each tumor sample. (C) Box and whisker plots showing quantification of band intensities for PAR3 that were normalized to RAN expression levels in 52 matched human normal and breast tumor lysates from mixed carcinomas (a) and ductal carcinomas (b). (D) Spearman's coefficients of correlation between PAR3 and MMP9 expression in normal breast, primary breast tumor and metastatic human breast cancers from two independent data sets (a; accession number: GSE1477; b, accession number: GSE7390). See also Figure S6.
Figure 7
Figure 7
PAR3 protein expression is reduced and aPKC/STAT3 signaling is activated in human breast cancers (A) Tissue sections of human normal and breast cancers stained for PAR3 (red) and nuclei (blue). Arrows show PAR3 enriched at the apical membrane. Images represent normal (a – c), infiltrating ductal carcinoma (d – f) and metastatic carcinoma (g – i). Scale bars = 100 μm. Arrows show PAR3 enriched at the apical membrane. (B) Tissue sections of human invasive breast cancers stained for PAR3 (red) and pSTAT3Y705 (green), representative of 166 stained tumor samples. Tumors with weak (top; 64% of tumors), mixed (middle; 28% of tumors), and intense (bottom, 8% of tumors) PAR3 staining. (C) Tissue sections of human invasive breast cancers stained for PAR3 (red) and active phospho-aPKCT560 (green). Arrows show PAR3 enriched at apical membrane and weak p-aPKC staining. Images show representative weak (a, 69% of tumors) mixed (b – c, 25% of tumors), and intense (d – e; 6% of tumors) p-aPKC staining. (D) Tissue sections of human invasive breast cancers co-stained for p-aPKCT560 (green) and pJAK2Y1007/8 (red). Representative images are shown for 5 tumor samples (a–e). (E) Model for cooperative effects of loss of Par3 in NICD or Ras61L tumors. Loss of Par3 in the context of either oncogene results the mis-localization and inappropriate activation of aPKC, which drives the induction and activation of Jak/Stat3 signaling, thereby causing increased MMP expression and ECM degradation. Scale bars = 30 μm.

References

    1. Barbieri I, Pensa S, Pannellini T, Quaglino E, Maritano D, Demaria M, Voster A, Turkson J, Cavallo F, Watson CJ, et al. Constitutively active Stat3 enhances neu-mediated migration and metastasis in mammary tumors via upregulation of Cten. Cancer Res. 2010a;70:2558–2567. - PubMed
    1. Barbieri I, Quaglino E, Maritano D, Pannellini T, Riera L, Cavallo F, Forni G, Musiani P, Chiarle R, Poli V. Stat3 is required for anchorage-independent growth and metastasis but not for mammary tumor development downstream of the ErbB-2 oncogene. Mol Carcinog. 2010b;49:114–120. - PubMed
    1. Bilder D, Li M, Perrimon N. Cooperative regulation of cell polarity and growth by Drosophila tumor suppressors. Science. 2000;289:113–116. - PubMed
    1. Bromberg J, Wang TC. Inflammation and cancer: IL-6 and STAT3 complete the link. Cancer Cell. 2009;15:79–80. - PMC - PubMed
    1. Bromberg JF, Wrzeszczynska MH, Devgan G, Zhao Y, Pestell RG, Albanese C, Darnell JE., Jr. Stat3 as an oncogene. Cell. 1999;98:295–303. - PubMed

Publication types

MeSH terms