. 2012 Nov 13;22(5):631-44.
doi: 10.1016/j.ccr.2012.09.021.

ATF4 regulates MYC-mediated neuroblastoma cell death upon glutamine deprivation

Affiliations

ATF4 regulates MYC-mediated neuroblastoma cell death upon glutamine deprivation

Guoliang Qing et al. Cancer Cell. .

Abstract

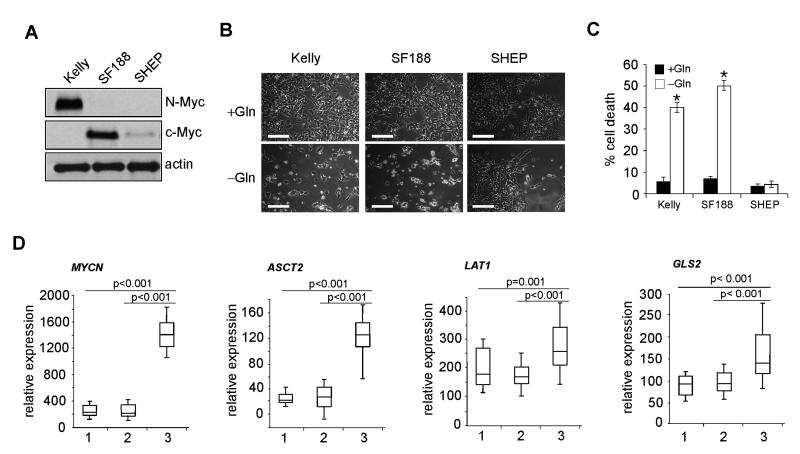
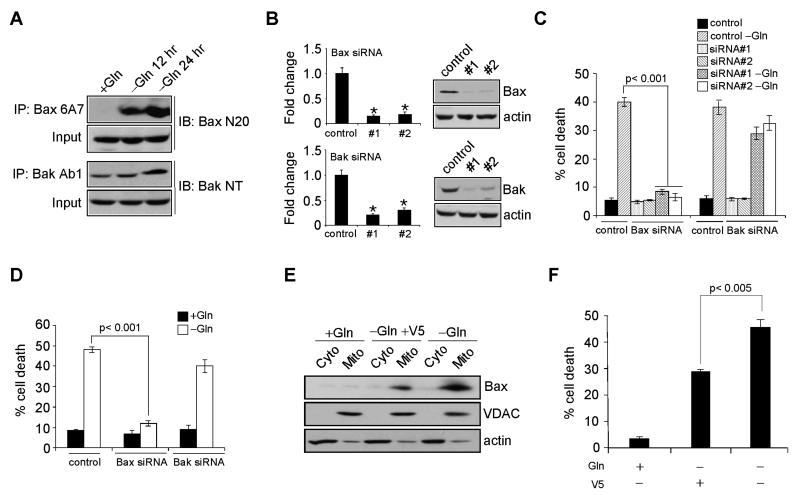
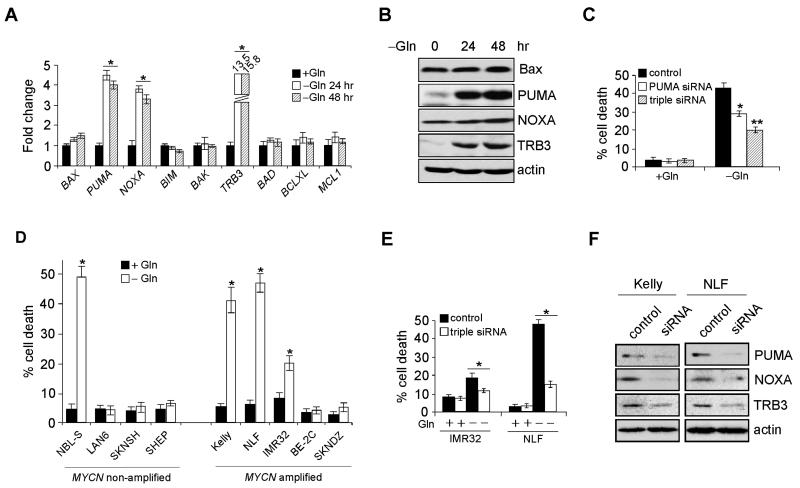
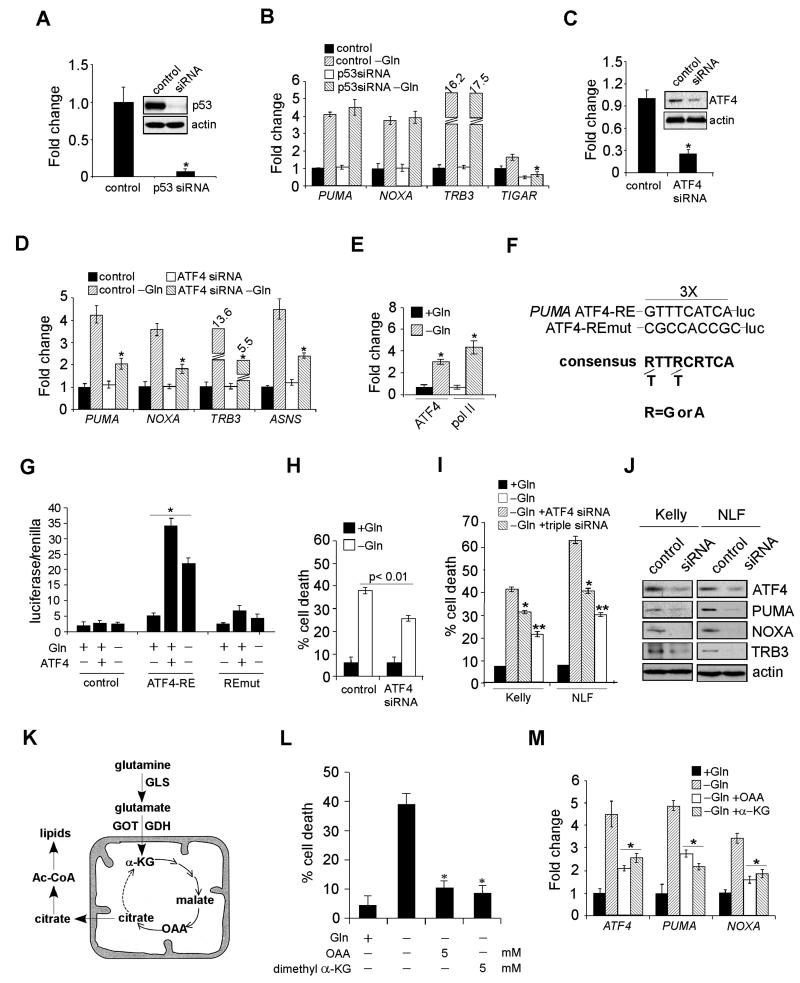
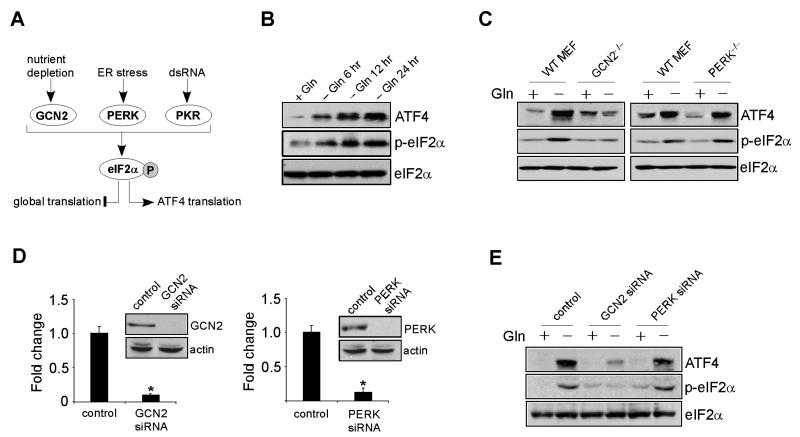
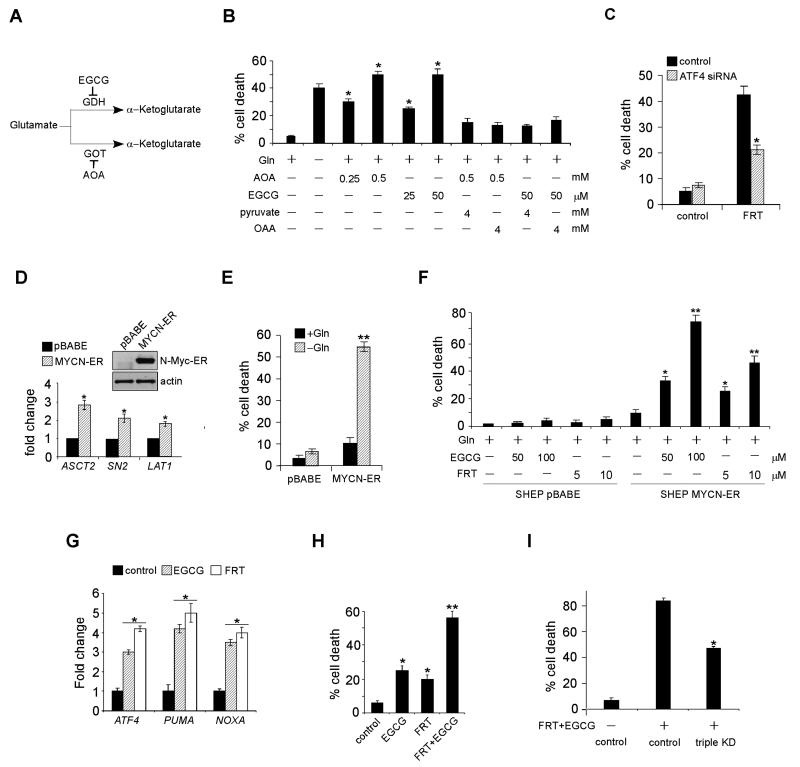
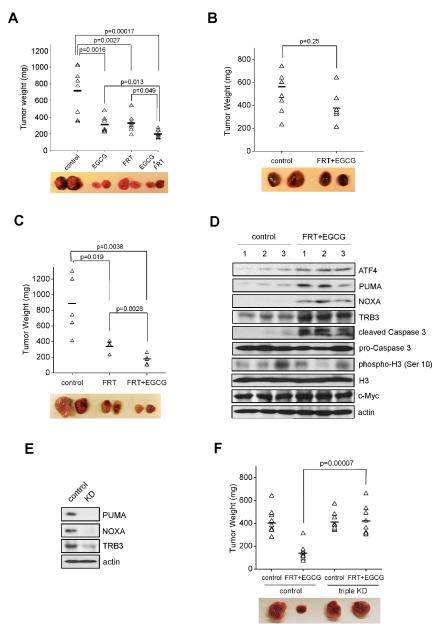
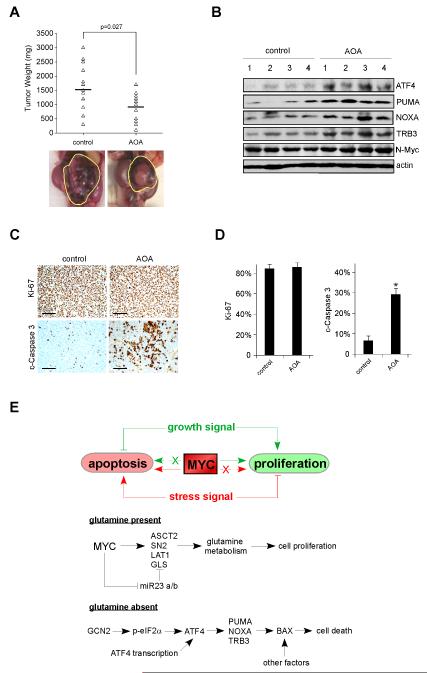
Oncogenic Myc alters mitochondrial metabolism, making it dependent on exogenous glutamine (Gln) for cell survival. Accordingly, Gln deprivation selectively induces apoptosis in MYC-overexpressing cells via unknown mechanisms. Using MYCN-amplified neuroblastoma as a model, we identify PUMA, NOXA, and TRB3 as executors of Gln-starved cells. Gln depletion in MYC-transformed cells induces apoptosis through ATF4-dependent, but p53-independent, PUMA and NOXA induction. MYC-transformed cells depend on both glutamate-oxaloacetate transaminase and glutamate dehydrogenase to maintain Gln homeostasis and suppress apoptosis. Consequently, either ATF4 agonists or glutaminolysis inhibitors potently induce apoptosis in vitro and inhibit tumor growth in vivo. These results reveal mechanisms whereby Myc sensitizes cells to apoptosis, and validate ATF4 agonists and inhibitors of Gln metabolism as potential Myc-selective cancer therapeutics.


Figures

Figure 1
Figure 1. Gln Starvation Triggers Tumor Cell Death in a MYC-dependent Manner
(A) Western blot analysis of Myc (N-Myc and c-Myc) expression in Kelly, SF188 and SHEP cells. β-actin was used as a loading control. (B) Representative images of Kelly, SF188 and SHEP cells in the presence or absence of Gln for 48 hr. Scale bars represent 50 μm. (C) Quantification of cell death by PI-Annexin V staining. Data are presented as an average of triplicates. Error bars represent standard deviation. *p< 0.001. (D) Relative expression of MYCN, ASCT2, LAT1, and GLS2 in primary neuroblastoma tumors. 1: low-risk group (28 tumors); 2: MYCN non-amplified, high-risk group (32 tumors); 3: MYCN-amplified, high-risk group (20 tumors); defined using International Neuroblastoma Risk Group (INRG) criteria (Maris, 2010). Data are presented as box plots: the box represents 25th percentile through the 75th percentile (the line through the box denotes the median), and the whiskers above and below extend to the 90th and 10th percentiles respectively. See also Figure S1.
Figure 2
Figure 2. Gln Depletion Triggers Bax-dependent, but Bak-independent Cell Death
(A) Immunoprecipitation of active Bax and Bak using conformation-specific antibodies in Kelly cells subjected to Gln starvation at indicated time points. (B) Protein levels of Bax and Bak upon siRNA knockdown in Kelly cells. Bar graphs show the quantification results. *p< 0.001. (C-D) Viability of Kelly cells (C) and SF188 cells (D) upon indicated siRNA knockdown were examined by PI-Annexin V staining after 48 hr Gln starvation. Data are shown as an average of triplicates. (E) Immunoblotting of Bax in the cytosolic (Cyto) and mitochondrial (Mito) fraction of NLF cells treated with V5 peptide in the presence or absence of Gln. VDAC and actin antibodies were used as controls for mitochondrial and cytosolic protein purification. (F) Gln starvation-induced cell death with or without V5 peptide treatment was examined by PI-Annexin V staining. Shown are average results from three experiments. All error bars represent standard deviation.
Figure 3
Figure 3. PUMA, NOXA and TRB3, but Not Ku70, are Involved in Gln Deprivation-mediated Cell Death
(A) RT-PCR analysis of genes involved in apoptosis. Data are shown as an average of triplicates. (B) Western blot analysis of indicated protein levels in Gln-starved Kelly cells. (C) Viability of Kelly cells transfected with indicated siRNAs in the presence or absence of Gln was analyzed by AnnexinV-PI staining. Data are shown as an average of triplicates. (D) Examination of Gln starvation-induced cell death in five MYCN-amplified, and four MYCN non-amplified neuroblastoma cell lines. Cell death was measured by Annexin V-PI staining. (E) Viability of IMR32 or NLF cells transfected with siRNAs targeting PUMA, NOXA, and TRB3 in the presence or absence of Gln was analyzed by AnnexinV-PI staining. Data are shown as an average of triplicates. (F) Western blots confirming the effect of siRNA knockdown. All error bars represent standard deviation. *p< 0.01. **p< 0.005. See also Figure S2.
Figure 4
Figure 4. ATF4, but Not p53, is Responsible for PUMA, NOXA, and TRB3 Activation
(A) Protein levels of p53 with or without siRNA knockdown. (B) mRNA expression of indicated genes was examined by RT-PCR in Kelly cells transfected with a control siRNA or p53 siRNA in the presence or absence of Gln. Data are shown as an average of triplicates. (C) Protein levels of ATF4 in Kelly cells with or without siRNA knockdown. (D) Indicated gene expression was quantitated by RT-PCR in Kelly cells transfected with a control or ATF4 siRNA in the presence or absence of Gln. Data are shown as an average of triplicates. (E) Specific chromatin binding of ATF4 evaluated by ChIP assay. Recruitment of Pol II was also assessed. (F) Schematic representation of the consensus ATF4-binding site, the ATF4 response element (ATF4-RE) within the PUMA promoter and its mutant (ATF4-REmut). (G) Luciferase assay was performed using control, ATF4-RE, and ATF4-REmut constructs with or without exogenous ATF4 expression or Gln starvation. Data are shown as an average of triplicates. (H) Viability of Kelly cells transfected with a control or ATF4 siRNA in the presence or absence of Gln was examined by PI-Annexin V staining. Data are shown as an average of triplicates. (I) Evaluation of Kelly and NLF cell death upon siRNA knockdown of ATF4 (using independent siRNAs from [C] and [H]), or a combination of PUMA, NOXA, and TRB3, in the absence of Gln. (J) Western blots confirming the effect of siRNA knockdown in (I). (K) Diagram depicting Gln metabolism in the TCA cycle. See text for more details. (L) Evaluation of Gln-starved Kelly cell death upon the addition of OAA or α-KG. (M) RT-PCR analysis of indicated genes in Kelly cells cultured in Gln-free or replete medium, or Gln-free medium supplemented with OAA or α-KG. Data are shown as an average of triplicates. All error bars represent standard deviation. *p< 0.01. **p< 0.005. See also Figure S3.
Figure 5
Figure 5. GCN2-eIF2α Pathway Activates ATF4 Translation in the Absence of Gln
(A) Diagram depicting pathways involved in selective ATF4 translation. See text for more details. (B) Western blot analysis of ATF4 and phosphorylated eIF2α (p-eIF2α) in Kelly cells, in the presence or absence of Gln. Total eIF2α was used as a loading control. (C) Immunoblotting of ATF4 and phosphorylated eIF2α (p-eIF2α) in wild-type (WT) MEFs and GCN2- or PERK-deficient (KO) MEFs, with or without Gln starvation. (D) Protein levels of GCN2 and PERK upon indicated siRNA knockdown in Kelly cells. Error bars represent standard deviation. *p< 0.005. (E) Protein levels of ATF4 and phosphorylated eIF2α (p-eIF2α) were detected in Kelly cells transfected with a control or GCN2 or PERK siRNA, in the presence or absence of Gln. See also Figure S4.
Figure 6
Figure 6. Pharmacological Inhibition of Gln Metabolism or ATF4 Hyperactivation Triggers Dramatic Cell Death In Vitro
(A) Diagram showing enzymes involved in glutamate metabolism. See text for details. (B) Kelly cell death was examined by PI-Annexin V staining upon EGCG or AOA treatment in the presence of Gln. Where indicated, various metabolites were also supplemented. (C) Kelly cell death was measured upon fenretinide treatment, with or without ATF4 knockdown. (D) Induction of MYCN-ER and its target genes in SHEP cells. Data are shown as an average of triplicates. (E) SHEP cell death with or without MYCN-ER induction was quantified by PI-Annexin V staining, in the presence or absence of Gln. (F) SHEP cells with or without MYCN-ER induction were cultured in Gln-replete medium, and their viability was measured upon indicated drug treatments. Data are shown as an average of triplicates. (G) RT-PCR analysis of ATF4, PUMA, and NOXA mRNAs in Kelly cells treated without or with EGCG (50 μM) or fenretinide (5 μM). Data are shown as an average of triplicates. (H) Kelly cell death was quantitated by Annexin V-PI staining upon different drug treatments. Where indicated, 25 μM EGCG and/or 3 μM fenretinide were used, and data are shown as an average of triplicates. (I) Evaluation of Kelly cell death upon PUMA/NOXA/TRB3 triple knockdown, in the presence or absence of fenretinide/EGCG. Experiments were repeated three times. All error bars represent standard deviation. *p< 0.01. **p< 0.005. See also Figure S5.
Figure 7
Figure 7. Pharmacological Intervention of Gln Metabolism or ATF4 Stimulation Significantly Inhibits MYC-mediated Xenograft Tumor Growth
(A) Xenograft tumor growth assay was performed using Kelly cells with EGCG and/or fenretinide administration. Representative pictures of subcutaneous tumors under different treatments are shown. (B-C) SKNAS cells (B) and P493B lymphoma cells overexpressing c-Myc (C) were subjected to the same xenograft experiments as performed in (A). (D) Western blot analysis of P493B-inititated xenograft tumor lysates for indicated proteins. (E) ShRNA viruses targeting PUMA, NOXA, and TRB3 were transduced into P493B cells and knockdown efficiencies were evaluated by Western blots. (F) Xenografts of P493B cells with or without PUMA/NOXA/TRB3 triple knock-down in the presence or absence of fenretinide/EGCG. The horizontal lines in (A-C) and (F) represent the average tumor weights for each group. See also Figure S6.
Figure 8
Figure 8. Transaminase Inhibitor Amino Oxyacetate (AOA) Reduces Autochthonous Neuroblastoma Growth in the TH-MYCN Transgenic Mouse Model
(A) Tumor bearing homozygous TH-MYCN mice were i.p. injected daily with PBS or 10 mg/kg AOA as described in the Experimental Procedures. 8 Days later, tumors were isolated and weighed. The horizontal lines represent the average tumor weights for each group. Pictures shown are of representative neuroblastomas. (B) Tumors harvested from homozygous TH-MYCN mice as described in (A) were lysed and subjected to Western blot analysis using indicated antibodies. (C) Ki-67 and cleaved Caspase 3 (c-Caspase 3) staining were performed on paraffin-embedded tumor tissue sections derived from (A). Representative staining micrographs were shown. Scale bars represent 100 μm. (D) Quantification of the results in (C), n=8 and *p< 0.001. Error bars represent standard deviation. (E) Model depicting the action of Gln in MYC-overexpressing tumors. See text for additional details. See also Figure S7.

References

    1. Ahluwalia GS, Grem JL, Hao Z, Cooney DA. Metabolism and action of amino acid analog anticancer agents. Pharmacology & therapeutics. 1990;46:243–271. - PubMed
    1. Ameri K, Harris AL. Activating transcription factor 4. The international journal of biochemistry & cell biology. 2008;40:14–21. - PubMed
    1. Bensaad K, Tsuruta A, Selak MA, Vidal MN, Nakano K, Bartrons R, Gottlieb E, Vousden KH. TIGAR, a p53-inducible regulator of glycolysis and apoptosis. Cell. 2006;126:107–120. - PubMed
    1. Butkinaree C, Park K, Hart GW. O-linked beta-N-acetylglucosamine (O-GlcNAc): Extensive crosstalk with phosphorylation to regulate signaling and transcription in response to nutrients and stress. Biochimica et biophysica acta. 2010;1800:96–106. - PMC - PubMed
    1. Capasso M, Devoto M, Hou C, Asgharzadeh S, Glessner JT, Attiyeh EF, Mosse YP, Kim C, Diskin SJ, Cole KA, et al. Common variations in BARD1 influence susceptibility to high-risk neuroblastoma. Nature genetics. 2009;41:718–723. - PMC - PubMed

Publication types

MeSH terms