. 2012 Nov 13;22(5):645-55.
doi: 10.1016/j.ccr.2012.09.009.

Aberrant overexpression of IL-15 initiates large granular lymphocyte leukemia through chromosomal instability and DNA hypermethylation

Affiliations

Aberrant overexpression of IL-15 initiates large granular lymphocyte leukemia through chromosomal instability and DNA hypermethylation

Anjali Mishra et al. Cancer Cell. .

Abstract

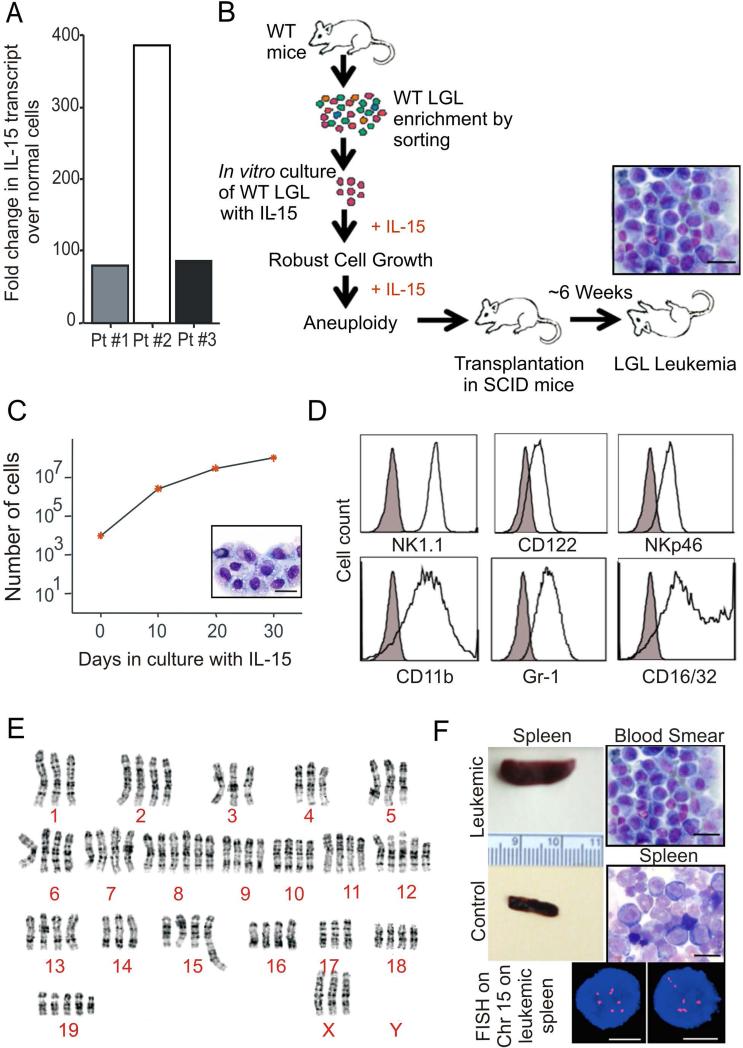
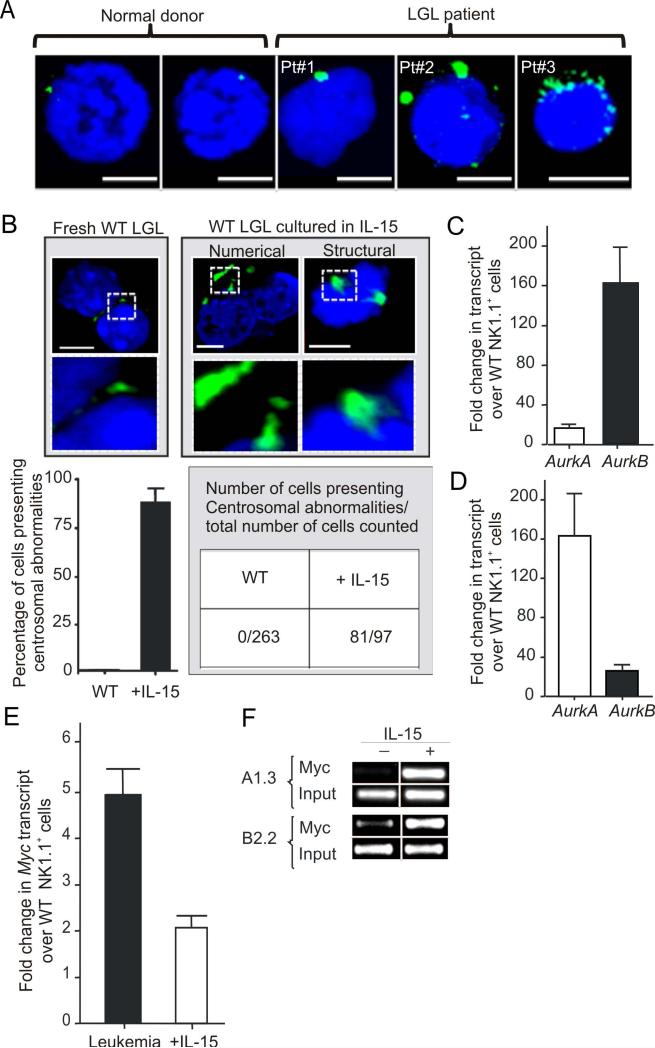
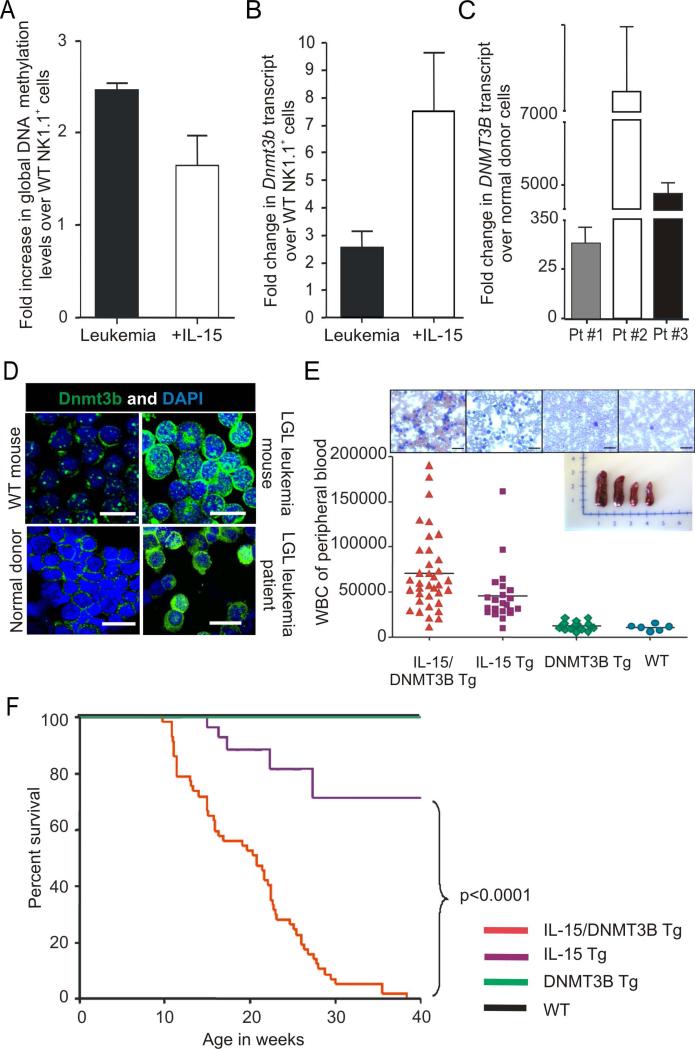
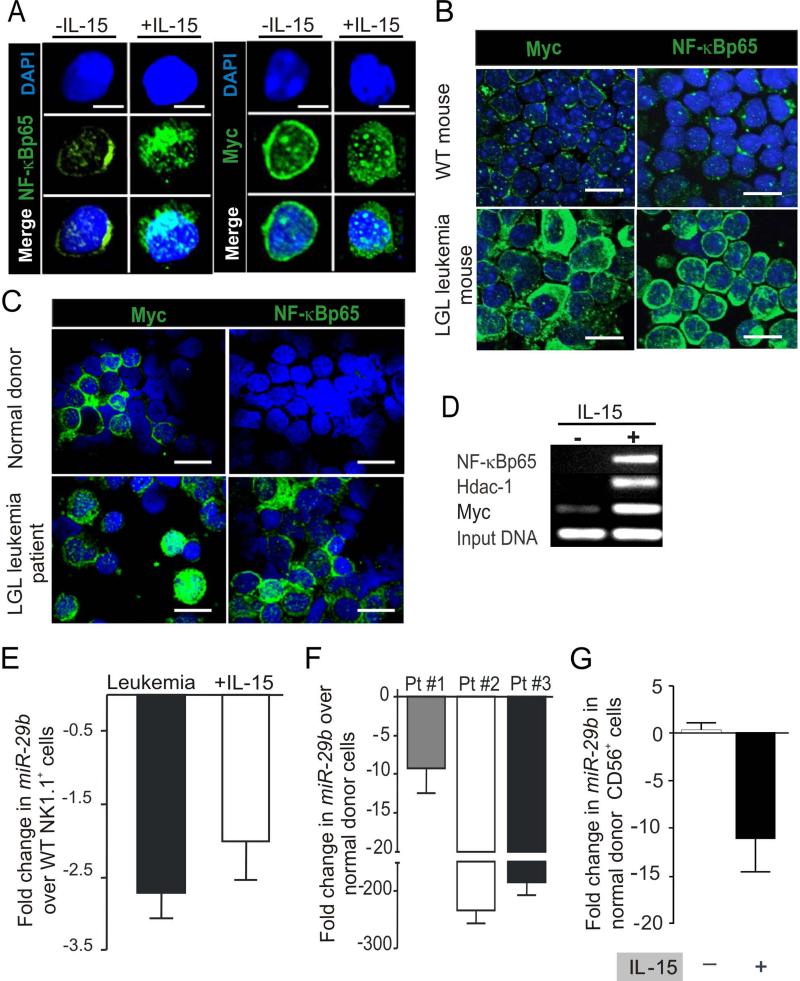
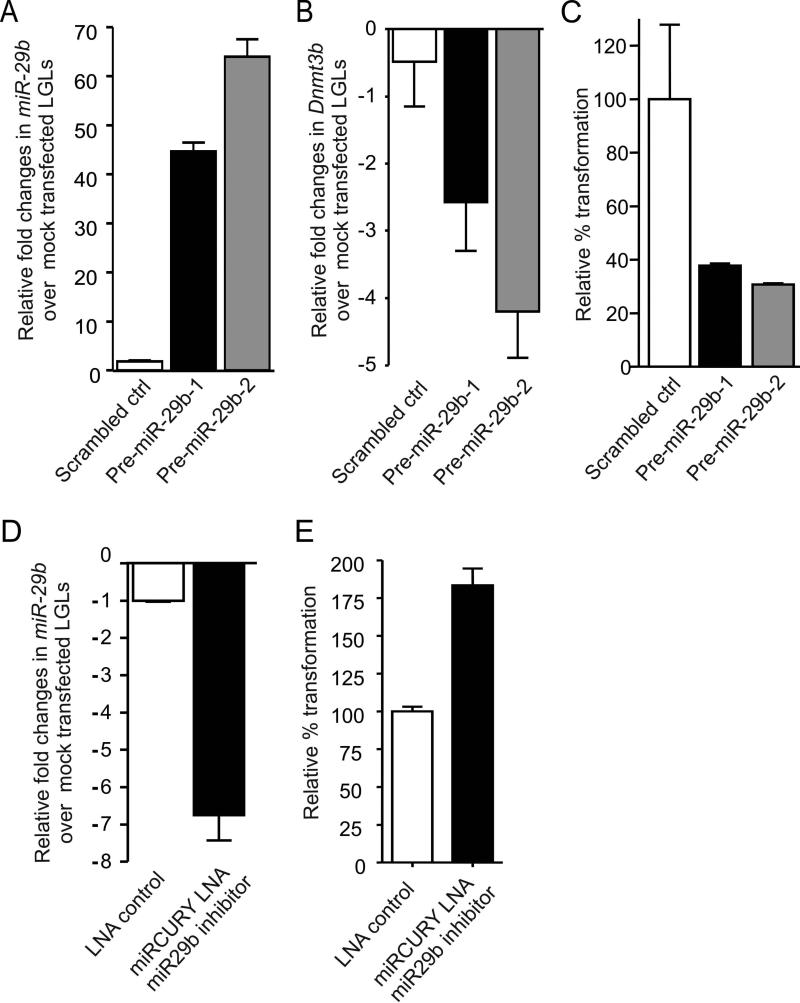
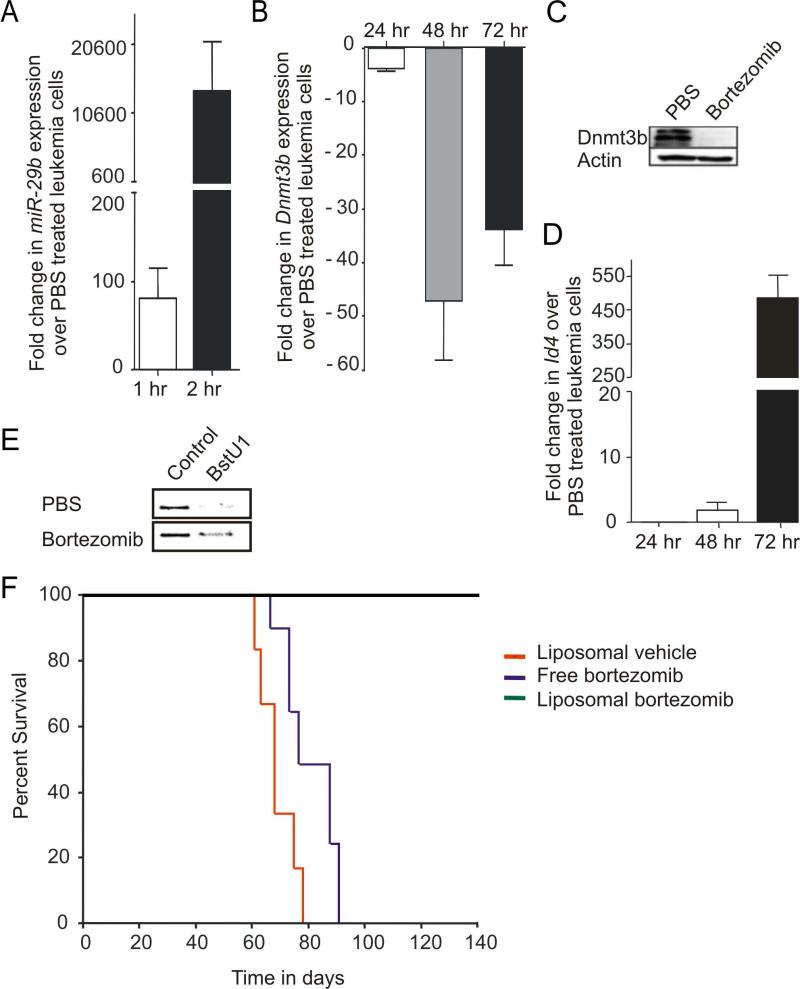
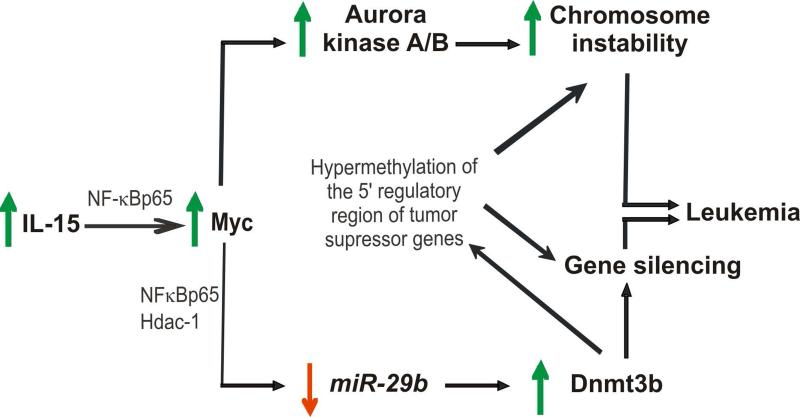
How inflammation causes cancer is unclear. Interleukin-15 (IL-15) is a pro-inflammatory cytokine elevated in human large granular lymphocyte (LGL) leukemia. Mice overexpressing IL-15 develop LGL leukemia. Here, we show that prolonged in vitro exposure of wild-type (WT) LGL to IL-15 results in Myc-mediated upregulation of aurora kinases, centrosome aberrancies, and aneuploidy. Simultaneously, IL-15 represses miR-29b via induction of Myc/NF-κBp65/Hdac-1, resulting in Dnmt3b overexpression and DNA hypermethylation. All this is validated in human LGL leukemia. Adoptive transfer of WT LGL cultured with IL-15 led to malignant transformation in vivo. Drug targeting that reverses miR-29b repression cures otherwise fatal LGL leukemia. We show how excessive IL-15 initiates cancer and demonstrate effective drug targeting for potential therapy of human LGL leukemia.


Figures

Figure 1
Figure 1. Chronic exposure to IL-15 initiates robust expansion and chromosomal instability in WT LGL
(A) Fold changes in expression of IL-15 mRNA in human LGL leukemia samples from three patients (Pt), normalized to 18S mRNA and then quantified relative to values of IL-15 measured in normal donors cells that were enriched for either CD56+ or CD8+ (n=4 each) and then arbitrarily set at 1. (B) Schema for the generation of in vitro robust expansion of WT LGL during culture in IL-15, and adoptive transfer followed by malignant transformation in vivo in the absence of exogenous IL-15. Scale bars, 10 μm (C) WT splenic NK1.1+ cells were sorted and incubated in triplicate with 100ng/ml rhIL-15. Cell growth was quantified as absolute number of cells (mean ± SEM) using enumeration in trypan blue exclusion dye. Wright-Giemsa stain of the in vitro cultured cells. Scale bars, 10 μm. (D) WT LGL were analyzed for their immuno-phenotype by FACS after six months of in vitro culture with IL-15. (E) Karyotype analysis was performed on metaphase spreads from WT LGL cultured in IL-15 for approximately six months, demonstrating marked aneuploidy. Composite karyotype of the in vitro transformed WT LGL cells was: 76-79<4n>,XXX,-X,-1,-3,del(4)(A1A2),-4,-5,+8,+8,+12,del(12)(A1.2B),-14,der(15)t(5;15)(B1;F2),-17,+19,+mar[cp7]/76 79,idem,+6[cp10]/76-79,idem,+19[cp3]. (F) ICR-SCID mice were intravenously injected with 1 × 10⁷ WT LGL following approximately eight months of in vitro culture with IL-15. Splenomegaly (compared to WT control as shown) and the presence of neoplastic LGL, both at the feathered edge of peripheral blood smear and on the spleen cytospin preparation, are shown. Scale bars, 10 μm. A representative FISH image illustrating gain of several copies chromosome 15 (red, chromosome 15 probe; blue, DAPI counter-stain) as seen in WT LGL cultured in vitro for months in IL-15 (E) is also shown. Scale bars, 5 μm.
Figure 2
Figure 2. IL-15 induces centrosome aberration in normal LGLs
(A) The size, structure and number of human centrosomes was determined by confocal microscopy and immunoflorescence staining with Pericentrin (green) in both freshly isolated normal human CD56+ or CD8+ LGL (top left) as well as in malignant cells from three patients with acute LGL leukemia. Cells were counterstained with DAPI (blue) for nuclear staining. Images shown are representative of slides with ~105 cells. Scale bars, 5 μm. (B) The size, structure and number of mouse centrosomes was determined by confocal microscopy and immunoflorescence staining with GTU88 (green) in both freshly isolated WT LGL (top left) as well as in WT LGL cultured in IL-15 for 6 months (top middle and right). Cells were counterstained with DAPI (blue) for nuclear staining. Images shown here are representative of 3 different slide preparation with ~105 cells. Graphical quantification of these centrosomal abnormalities is shown immediately below as percentage of cells (mean ± SEM) presenting centrosomal abnormalities from 3 independent slide preparations. Scale bars, 5 μm. (C) Relative fold changes (mean ± SEM) in mRNA expression of AurkA and AurkB in splenocytes from LGL leukemic mice relative to values measured in fresh WT LGL. Quantification was by Real-time RT-PCR (n = 3 each). Each measurement was normalized against the level of 18S mRNA, and then values for AurkA and AurkB in fresh WT LGL were arbitrarily set at 1. (D) Relative fold changes (mean ± SEM) in mRNA expression of AurkA and AurkB for WT LGL cultured in IL-15 for 30 days, relative again to values measured in fresh WT LGL which are arbitrarily set at 1 (n = 3 each). (E) Relative fold changes (mean ± SEM) in mRNA expression of Myc in splenotyces from LGL leukemic mice (n = 3), and in WT mouse LGL cultured in IL-15 for 30 days. Both measurements are relative to values of Myc measured in fresh WT LGL that are arbitrarily set at 1. (F) WT LGL were grown in vitro with IL-15 for approximately 6 months, and then harvested and starved for 24 hours and then divided up to be re-stimulated with either IL-15 or PBS for 4 hours. ChIP assay was performed using an anti-Myc antibody and PCR primers amplifying the AurkA and AurkB promoter 5’ regulatory regions. See also Figure S1.
Figure 3
Figure 3. Aberrant DNA methylation and methytransferase activity contribute to IL-15 induced LGL leukemia
(A) Relative fold increase in global DNA methylation (GDM) levels in splenocytes from LGL leukemic mice (n=4) and in WT LGL cultured in IL-15 (n=3) for 30 days relative to values of GDM measured in fresh WT LGL (n=4), which is arbitrarily set at 1. Quantification was done by mass spectrophotometery and shown as mean ± SEM. (B) Relative fold changes in mRNA expression of Dnmt3b, in splenocytes from LGL leukemic mice (n = 3) and in WT LGL cultured in IL-15 (n=3) for 30 days relative to values of Dnmt3b measured in fresh WT LGL (n=3). Quantification was by Real-time RT-PCR and shown as the mean ± SEM. Each measurement was normalized against the level of 18S mRNA, and then values of Dnmt3b for fresh WT LGL were arbitrarily set at 1. (C) Fold changes (mean ± SEM) in mRNA expression of DNMT3B in three human LGL leukemia patient (Pt) samples, relative to values of DNMT3B measured in normal donors cells that were enriched for either CD56+ or CD8+ (n=4 each) and arbitrarily set at 1. Each sample was normalized to 18S mRNA. (D) Confocal analysis of Dnmt3b protein expression in mouse and human LGL leukemia relative to normal LGL. Assay was done by immuno-labeling the cells with anti-Dnmt3b antibody. Data are representative of at least four independent mice, patients and normal donors. Cells were counterstained with DAPI (blue) for nuclear staining. Scale bars, 10 μm. (E) WBC counts of different genotypes of adult mice generated from mating IL-15 Tg and DNMT3B Tg parents. The horizontal bar in each lane indicates the mean WBC count for 6-36 mice per group. Also included are four representative images from Wright-Giemsa staining of blood smears for each of the four genotypes, and an image of four whole spleens obtained from mice of each genotype. (F) Comparative survival of DNMT3B Tg and WT mice (both 100%), IL-15 Tg and IL-15/DNMT3B Tg mice. See also Figure S2.
Figure 4
Figure 4. Alteration of gene expression by IL-15 and in LGL leukemia
(A) Confocal analysis of fresh WT mouse LGL and WT mouse LGL cultured in IL-15 for 30 days was performed by immuno-labeling the cells with anti-Myc and anti-NF-κBp65 as above. Scale bars, 5 μm. (B) Confocal analysis of spleen samples from LGL leukemic mice and fresh WT LGL for Myc and NF-κB was performed by immuno-labeling of the cells with the respective antibody. Cells were counterstained with DAPI (blue) for nuclear staining. Data are representative of at least five independent mice evaluated for protein expression. Scale bars, 10 μm. (C) Confocal analysis of enriched LGL from normal human donor blood samples compared with LGL leukemia samples from patients. Immuno-staining was done by incubating the cells with anti-MYC and an anti-NF-κBp65 antibody. Data are representative of at least four independent normal donors and LGL leukemia patients evaluated for protein expression. Scale bars, 10 μm. (D) In vitro cultured WT LGL were grown with IL-15 for approximately eight months, then harvested and starved for 24 hours and then divided up to be re-stimulated with either IL-15 or PBS for four hours. A ChIP assay was performed using the indicated antibody. The gel image shows the PCR product of the indicated gene performed on ChIP DNA with primers designed for amplification along the miR-29b promoter/enhancer region. The data are representative of three independent experiments. (E) Fold decrease (mean ± SEM) in miR-29b transcript levels in splenocytes from LGL leukemic mice (n=4) and in WT LGL cultured in IL-15 (n=4) for 12 hours relative to value of miR-29b measured in fresh WT LGL (n=4) which is arbitrarily set at 1. Each sample was normalized to U6. (F) Fold changes (mean ± SEM) in expression of miR-29b transcript levels in human LGL leukemia samples, normalized to U6 and then quantified relative to values of miR-29b measured in normal donor cells that were enriched for either CD56+ or CD8+ (n=4 each) and then arbitrarily set at 1. (G) Fold changes (mean ± SEM, n=3) in expression of miR-29b in CD3-CD56+ normal human donor LGL from IL-15 stimulated and PBS treated control for 12 hours relative to values of miR-29b measured in unstimulated normal donor LGL and arbitrarily set at 1. Each measurement was normalized against the level of U6. See also Figure S3.
Figure 5
Figure 5. Mir-29b overexpression or repression alters LGL transformation
(A) Relative fold overexpression (mean ± SEM) of miR-29b in WT mouse LGL transfected with scrambled control or pre-miR-29b, relative to the value measured in mock transfected LGL (not shown), which is arbitrarily set at 1. Each sample was normalized to U6. (B) Relative fold changes (mean ± SEM, n=3) in mRNA expression of Dnmt3b in LGL shown in (A). Each measurement was normalized against the level of 18S mRNA, and then values of Dnmt3b for mock-transfected LGL cells were arbitrarily set at 1. (C) LGL similarly transfected with scrambled control or pre-miR-29b as shown in (A) were then plated at 1×10⁵/well in triplicate and cultured with IL-15 in a semisolid agar medium for 8-10 days after which CFU are detected and quantified in a cell transformation assay using a microtiter plate reader as described in Experimental Procedures. Percent transformation of pre-miR-29b transfected LGL relative to control (scrambled transfected LGL, arbitrarily set at 100%) is shown as mean ± SEM, n=3 each. (D) In vitro cultured mouse LGL were transfected with 50 pmole solution of LNA control or LNA miR-29b inhibitor oligonuleotide per manufacturer's instruction by electroporation. Cells were measured for miR-29b expression levels 24 hours post transfection. (E) WT mouse LGL were plated at 1×10⁵/well in triplicate and cultured with IL-15 in a semisolid agar medium for 8-10 days after which CFU are detected and quantified in a cell transformation assay using a microtiter plate reader as described in Experimental Procedures. Percent transformation of cells relative to LNA control (arbitrarily set at 100%) is shown as mean ± SEM, n=3 each.
Figure 6
Figure 6. In vitro and in vivo targeting of miR-29b transcriptional repression
(A) Fold increase in miR-29b transcript at 1 (white) and 2 (black) hours post in vitro bortezomib treatment (20μM). Both measurements normalized to U6 and then set relative to values of miR-29b measured in PBS treated LGL leukemia cells, which are arbitrarily set at 1. (B) Relative fold changes in mRNA expression of Dnmt3b in bortezomib (20nM) treated LGL leukemia samples at 24, 48 and 72 hour, normalized to 18S mRNA and then quantified relative to values of Dnmt3b in PBS treated LGL leukemia samples that are arbitrarily set at 1. Data for (A) and (B) are mean ± SEM (n=3). (C) Splenocytes from LGL leukemic mice were treated in vitro with either control (PBS) or bortezomib (20nM) for 24 hours and then immunoblotted for Dnmt3b and actin that was used as an internal control. (D) Relative fold changes (mean ± SEM) in mRNA expression of Idb4 in mouse LGL leukemia cells treated in vitro with bortezomib (20μM) at 24, 48 and 72 hour, normalized to 18S mRNA and then quantified relative to values of Idb4 in PBS treated LGL leukemia samples that are arbitrarily set at 1. (E) COBRA analysis for Idb4 promoter methylation in splenocytes from LGL leukemic mice that were treated in vitro for 72 hours with either control (PBS) or bortezomib (20nM). Amplification of the Idb4 promoter region and sequential COBRA analysis with a methylation sensitive restriction enzyme (BstU1) reveals only a partial loss of methylation at the Idb4 promoter in LGL leukemia cells treated with bortezomib (20μM), but not PBS. (F) Kaplan–Meier survival plot for ICR-SCID mice (n = 6–8/group) after intravenous injection of splenocytes from LGL leukemia mice. Disease-free survival in mice treated with empty liposomes, free-bortezomib and liposomal-bortezomib. See also Figure S4.
Figure 7
Figure 7
Schematic of the proposed network of IL-15-mediated transformation of WT LGL to LGL leukemia.

Comment in

References

    1. Aboud M, Golde DW, Bersch N, Rosenblatt JD, Chen IS. A colony assay for in vitro transformation by human T cell leukemia viruses type I and type II. Blood. 1987;70:432–436. - PubMed
    1. Ames BN, Gold LS, Willett WC. The causes and prevention of cancer. Proc Natl Acad Sci U S A. 1995;92:5258–5265. - PMC - PubMed
    1. Asadullah K, Haeussler-Quade A, Gellrich S, Hanneken S, Hansen-Hagge TE, Docke WD, Volk HD, Sterry W. IL-15 and IL-16 overexpression in cutaneous T-cell lymphomas: stage-dependent increase in mycosis fungoides progression. Exp Dermatol. 2000;9:248–251. - PubMed
    1. Azimi N, Brown K, Bamford RN, Tagaya Y, Siebenlist U, Waldmann TA. Human T cell lymphotropic virus type I Tax protein trans-activates interleukin 15 gene transcription through an NF-kappaB site. Proc Natl Acad Sci U S A. 1998;95:2452–2457. - PMC - PubMed
    1. Azimi N, Jacobson S, Leist T, Waldmann TA. Involvement of IL-15 in the pathogenesis of human T lymphotropic virus type I-associated myelopathy/tropical spastic paraparesis: implications for therapy with a monoclonal antibody directed to the IL-2/15R beta receptor. J Immunol. 1999;163:4064–4072. - PubMed

Publication types

MeSH terms

LinkOut - more resources