

Selective factor XIIa inhibition attenuates silent brain ischemia: application of molecular imaging targeting coagulation pathway
- PMID: 23153913
- PMCID: PMC3502014
- DOI: 10.1016/j.jcmg.2012.01.025
Selective factor XIIa inhibition attenuates silent brain ischemia: application of molecular imaging targeting coagulation pathway
Abstract
Objectives: The purpose of this study was use molecular imaging targeting coagulation pathway and inflammation to better understand the pathophysiology of silent brain ischemia (SBI) and monitor the effects of factor XIIa inhibition.
Background: SBI can be observed in patients who undergo invasive vascular procedures. Unlike acute stroke, the diffuse nature of SBI and its less tangible clinical symptoms make this disease difficult to diagnose and treat.
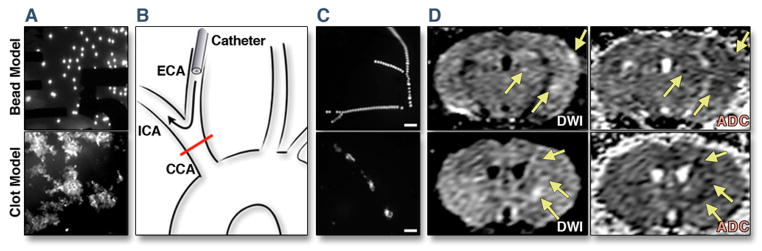
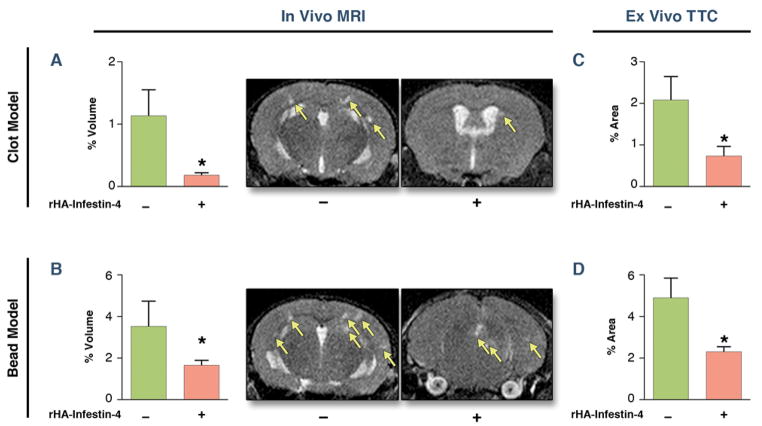
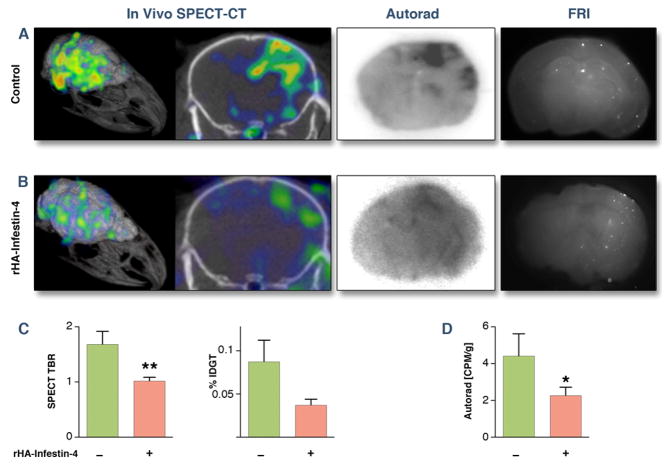
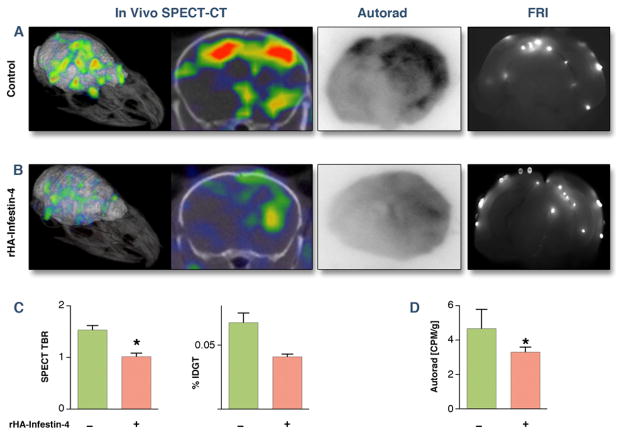
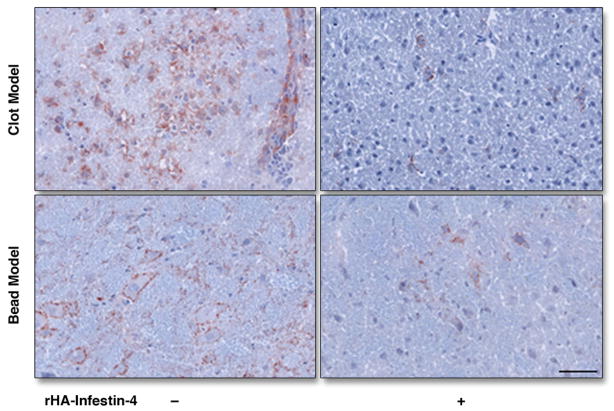
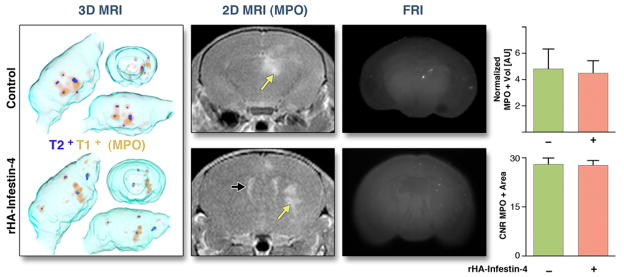
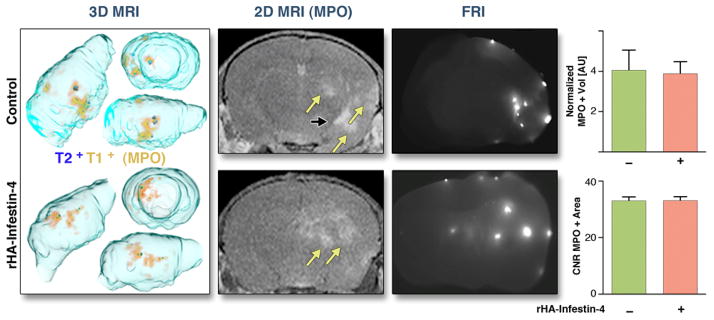
Methods: We induced SBI in mice by intra-arterial injection of fluorescently labeled microbeads or fractionated clot into the carotid artery. After SBI induction, diffusion-weighted magnetic resonance imaging was performed to confirm the presence of microinfarcts in asymptomatic mice. Molecular imaging targeting the downstream factor XIII activity (single-photon emission computed tomography/computed tomography) at 3 h and myeloperoxidase activity (magnetic resonance imaging) on day 3 after SBI induction were performed, without and with the intravenous administration of a recombinant selective factor XIIa inhibitor derived from the hematophagous insect Triatoma infestans (rHA-Infestin-4). Statistical comparisons between 2 groups were evaluated by the Student t test or Mann-Whitney U test.
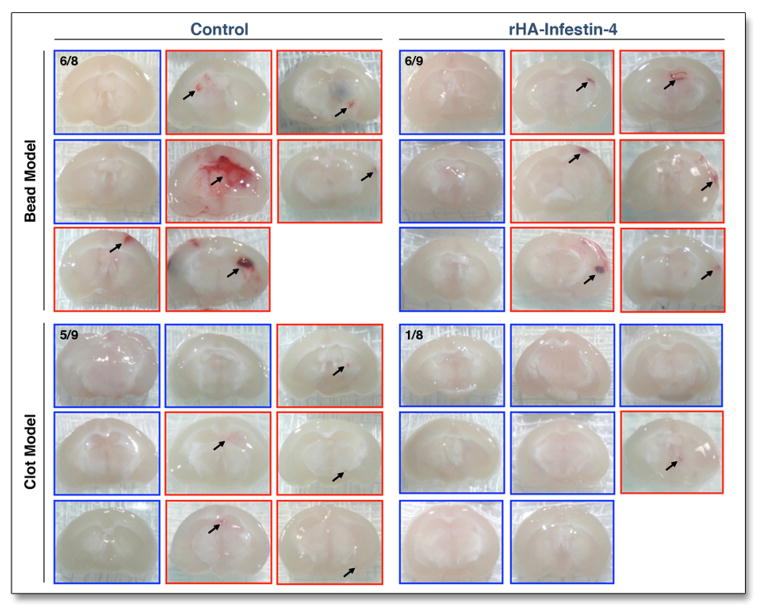
Results: In SBI-induced mice, we found abnormal activation of the coagulation cascade (factor XIII activity) and increased inflammation (myeloperoxidase activity) close to where emboli lodge in the brain. rHA-Infestin-4 administration significantly reduced ischemic damage (53% to 85% reduction of infarct volume, p < 0.05) and pathological coagulation (35% to 39% reduction of factor XIII activity, p < 0.05) without increasing hemorrhagic frequency. Myeloperoxidase activity, when normalized to the infarct volume, did not significantly change with rHA-Infestin-4 treatment, suggesting that this treatment does not further decrease inflammation other than that resulting from the reduction in infarct volume.
Conclusions: Focal intracerebral clotting and inflammatory activity are part of the pathophysiology underlying SBI. Inhibiting factor XIIa with rHA-Infestin-4 may present a safe and effective treatment to decrease the morbidity of SBI.
Copyright © 2012 American College of Cardiology Foundation. Published by Elsevier Inc. All rights reserved.
Figures
Similar articles
-
The Coagulation Factor XIIa Inhibitor rHA-Infestin-4 Improves Outcome after Cerebral Ischemia/Reperfusion Injury in Rats.PLoS One. 2016 Jan 27;11(1):e0146783. doi: 10.1371/journal.pone.0146783. eCollection 2016. PLoS One. 2016. PMID: 26815580 Free PMC article.
-
Factor XIIa inhibitor recombinant human albumin Infestin-4 abolishes occlusive arterial thrombus formation without affecting bleeding.Circulation. 2010 Apr 6;121(13):1510-7. doi: 10.1161/CIRCULATIONAHA.109.924761. Epub 2010 Mar 22. Circulation. 2010. PMID: 20308613
-
Factor XIIa inhibition by Infestin-4: in vitro mode of action and in vivo antithrombotic benefit.Thromb Haemost. 2014 Apr 1;111(4):694-704. doi: 10.1160/TH13-08-0668. Epub 2013 Dec 12. Thromb Haemost. 2014. PMID: 24336918
-
Extension of therapeutic window in ischemic stroke by selective mismatch imaging.Int J Stroke. 2019 Jun;14(4):351-358. doi: 10.1177/1747493019840936. Epub 2019 Apr 1. Int J Stroke. 2019. PMID: 30935350 Review.
-
Factor XII as a Therapeutic Target in Thromboembolic and Inflammatory Diseases.Arterioscler Thromb Vasc Biol. 2017 Jan;37(1):13-20. doi: 10.1161/ATVBAHA.116.308595. Epub 2016 Nov 10. Arterioscler Thromb Vasc Biol. 2017. PMID: 27834692 Review.
Cited by
-
Recent advances on plasmin inhibitors for the treatment of fibrinolysis-related disorders.Med Res Rev. 2014 Nov;34(6):1168-216. doi: 10.1002/med.21315. Epub 2014 Mar 21. Med Res Rev. 2014. PMID: 24659483 Free PMC article. Review.
-
The Coagulation Factor XIIa Inhibitor rHA-Infestin-4 Improves Outcome after Cerebral Ischemia/Reperfusion Injury in Rats.PLoS One. 2016 Jan 27;11(1):e0146783. doi: 10.1371/journal.pone.0146783. eCollection 2016. PLoS One. 2016. PMID: 26815580 Free PMC article.
-
Targeting coagulation factor XII as a novel therapeutic option in brain trauma.Ann Neurol. 2016 Jun;79(6):970-82. doi: 10.1002/ana.24655. Epub 2016 Apr 28. Ann Neurol. 2016. PMID: 27043916 Free PMC article.
-
Radionuclide Imaging of Atherothrombotic Diseases.Curr Cardiovasc Imaging Rep. 2019 May;12(5):17. doi: 10.1007/s12410-019-9491-7. Epub 2019 Mar 27. Curr Cardiovasc Imaging Rep. 2019. PMID: 31191793 Free PMC article.
-
New Triazole-Based Potent Inhibitors of Human Factor XIIa as Anticoagulants.ACS Omega. 2024 Feb 22;9(9):10694-10708. doi: 10.1021/acsomega.3c09335. eCollection 2024 Mar 5. ACS Omega. 2024. PMID: 38463342 Free PMC article.
References
-
- Bendszus M, Stoll G. Silent cerebral ischaemia: hidden fingerprints of invasive medical procedures. Lancet Neurol. 2006;5:364–72. - PubMed
-
- Kim DE, Kim JY, Schellingerhout D, et al. Protease imaging of human atheromata captures molecular information of atherosclerosis, complementing anatomic imaging. Arterioscler Thromb Vasc Biol. 2010;30:449–56. - PubMed
-
- Vermeer SE, Longstreth WTJ, Koudstaal PJ. Silent brain infarcts: a systematic review. Lancet Neurol. 2007;6:611–19. - PubMed
-
- Vermeer SE, Hollander M, van Dijk EJ, Hofman A, Koudstaal PJ, Breteler MM. Silent brain infarcts and white matter lesions increase stroke risk in the general population: the Rotterdam Scan Study. Stroke. 2003;34:1126–29. - PubMed
-
- Davie EW. A brief historical review of the waterfall/cascade of blood coagulation. J Biol Chem. 2003;278:50819–32. - PubMed
Publication types
MeSH terms
Substances
Grants and funding
LinkOut - more resources
Full Text Sources
Other Literature Sources
Medical
Research Materials
