. 2013 Feb 8;425(3):492-505.
doi: 10.1016/j.jmb.2012.11.003. Epub 2012 Nov 12.

Amyloid formation in heterogeneous environments: islet amyloid polypeptide glycosaminoglycan interactions

Affiliations

Amyloid formation in heterogeneous environments: islet amyloid polypeptide glycosaminoglycan interactions

Hui Wang et al. J Mol Biol. .

Abstract

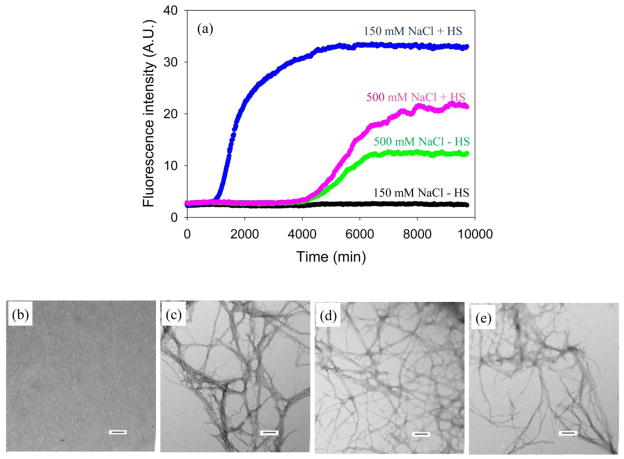
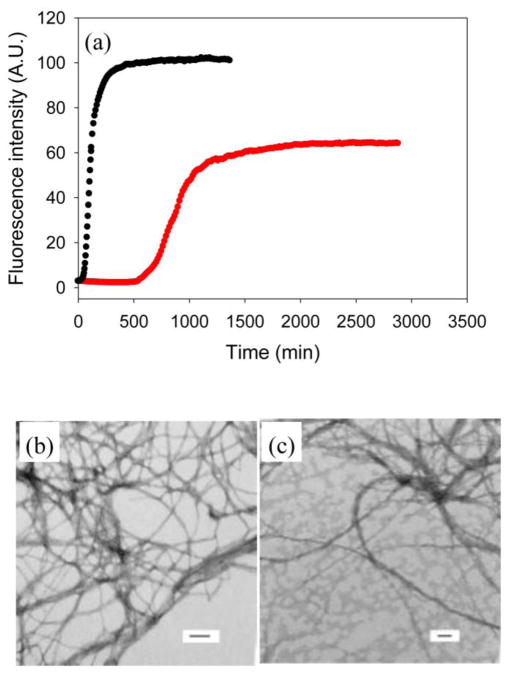
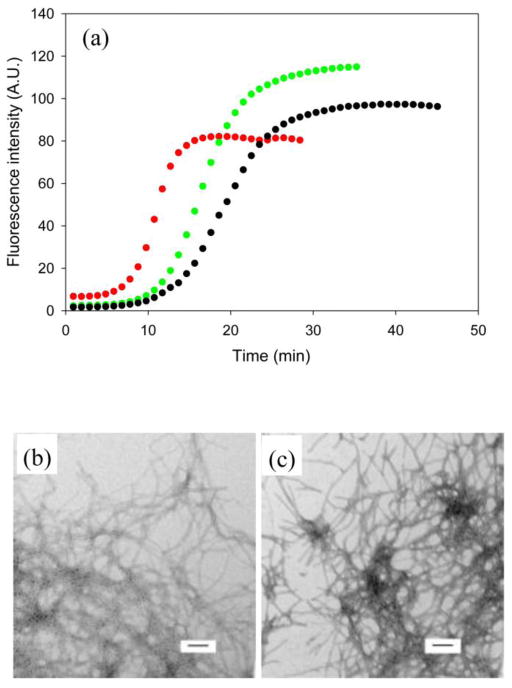
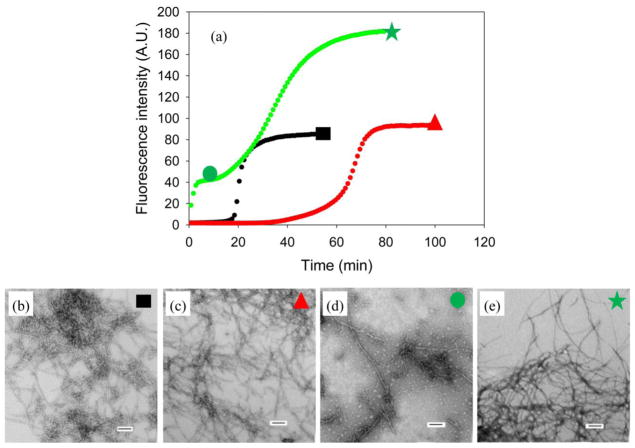
Amyloid formation plays an important role in a broad range of diseases, and the search for amyloid inhibitors is an active area of research. Amyloid formation takes places in a heterogeneous environment in vivo with the potential for interactions with membranes and with components of the extracellular matrix. Naturally occurring amyloid deposits are associated with sulfated proteoglycans and other factors. However, the vast majority of in vitro assays of amyloid formation and amyloid inhibition are conducted in homogeneous solution where the potential for interactions with membranes or sulfated proteoglycans is lacking and it is possible that different results may be obtained in heterogeneous environments. We show that variants of islet amyloid polypeptide (IAPP), which are non-amyloidogenic in homogeneous solution, can be readily induced to form amyloid in the presence of glycosaminoglycans (GAGs). GAGs are found to be more effective than anionic lipid vesicles at inducing amyloid formation on a per-charge basis. Several known inhibitors of IAPP amyloid formation are shown to be less effective in the presence of GAGs.


Figures

Figure 1
Figure 1
Sequence of wild type IAPP, I26P-IAPP and G24-N-methyl, I26-N-methyl-IAPP (NMe denotes N-methylation). Each peptide has an amidated C-terminus and a disulfide bond.
Figure 2
Figure 2
Amyloid formation by I26P-IAPP in the absence and presence of heparan sulfate. (a) Results of fluorescence-monitored thioflavin-T binding assays are displayed. Black, I26P-IAPP in the absence of heparan sulfate; red, I26P-IAPP in the presence of heparan sulfate. The insert shows an expanded plot of the first 50 mins. (b) TEM image of I26P-IAPP in the presence of heparan sulfate. (c) TEM image of I26P-IAPP in the absence of heparan sulfate. Aliquots were removed at the end of each kinetic experiment for TEM analysis. Scale bars represent 100 nm. The kinetic experiments were conducted in 20 mM Tris-HCl (pH 7.4), 2% HFIP (v/v) with continuous stirring at 25 °C. The concentration of I26P-IAPP was 16 μM. Heparan sulfate, when present, was at 1.3 μM.
Figure 3
Figure 3
Amyloid formation by NMe-G24, NMe-I26-IAPP in the absence and presence of heparan sulfate. (a) Results of fluorescence-monitored thioflavin-T binding assays are displayed. Black, NMe-G24, NMe-I26-IAPP in the absence of heparan sulfate; red, NMe-G24, NMe-I26-IAPP in the presence of heparan sulfate. The insert shows an expanded plot of the first 100 mins. (b) TEM image of NMe-G24, NMe-I26-IAPP in the presence of heparan sulfate. (c) TEM image of NMe-G24, NMe-I26-IAPP in the absence of heparan sulfate. Aliquots were removed at the end of each kinetic experiment for TEM analysis. Scale bars represent 100 nm. The kinetic experiments were conducted in 20 mM Tris-HCl (pH 7.4), 2% HFIP (v/v) with continuous stirring at 25 °C. The concentration of NMe-G24, NMe-I26-IAPP was 16 μM. Heparan sulfate, when present, was at 1.3 μM.
Figure 4
Figure 4
Heparan sulfate is associated with amyloid fibrils. FRET between fluorescein labeled heparin (FLH) and thioflavin-T bound to amyloid fibrils formed by I26P-IAPP. (a) Kinetic profile of I26P-IAPP in the presence of FLH monitored by FRET between FLH and thioflavin-T bound to amyloid fibrils. The fluorescence was measured using an excitation wavelength of 440 nm and an emission wavelegnth of 510 nm. Black, control experiment, I26P-IAPP in the presence of FLH, no thioflavin-T; red, I26P-IAPP in the presence of FLH and thioflavin-T. (b) TEM image of I26P-IAPP in the presence of FLH and thioflavin-T. An aliquot was removed at the end of the reaction for TEM analysis. (c) TEM image of I26P-IAPP in the presence of FLH, no thioflavin-T. An aliquot was removed at the end of the reaction for TEM analysis. Scale bars represent 100 nm. The kinetic experiments were conducted in 20 mM Tris-HCl (pH 7.4), 2% HFIP (v/v) with continuous stirring at 25 °C. The concentration of I26P-IAPP was 16 μM. FLH was at 1.3 μM.
Figure 5
Figure 5
I26P-IAPP amyloid formation in the presence and absence of heparan sulfate at different NaCl concentrations. (a) Results of fluorescence-monitored thioflavin-T binding assays are displayed. The kinetic profiles were collected with 20 mM Tris-HCl and either 150 mM or 500 mM NaCl at pH 7.4, no HFIP, without stirring at 25 °C. Black and blue curves were collected in a buffer with 170 mM total salt concentration (20 mM Tris+150 mM NaCl). Black, I26P-IAPP in the absence of heparan sulfate; blue, I26P-IAPP in the presence of heparan sulfate. Green and pink curves were collected in a buffer with 520 mM salt concentration (20 mM Tris+500 mM NaCl). Green, I26P-IAPP in the absence of heparan sulfate; pink, I26P-IAPP in the presence of heparan sulfate. (b) TEM image of I26P-IAPP in the absence of heparan sulfate with 150 mM NaCl in the buffer. (c) TEM image of I26P-IAPP in the presence of heparan sulfate with 150 mM NaCl in the buffer. (d) TEM image of I26P-IAPP in the absence of heparan sulfate with 500 mM NaCl in the buffer. (e) TEM image of I26P-IAPP in the presence of heparan sulfate with 500 mM NaCl in the buffer. Aliquots were removed at the end of each experiment for TEM analysis. Scale bars represent 100 nm. The concentration of I26P-IAPP was 16 μM. Heparan sulfate, when present, was at 1.3 μM.
Figure 6
Figure 6
Comparison of amyloid formation by I26P-IAPP in the presence of GAG and lipids. (a) Results of fluorescence-monitored thioflavin-T binding assays are displayed. Black, I26P-IAPP in the presence of heparan sulafte; red, I26P-IAPP in the presence of 100 nm DOPG vesicles. (b) TEM image of I26P-IAPP in the presence of heparan sulfate. (c) TEM image of I26P-IAPP in the presence of 100 nm DOPG vesicles. Aliquots were removed at the end of each reaction for TEM analysis. Scale bars represent 100 nm. The kinetic profiles were collected with 20 mM Tris at pH 7.4, no HFIP, no stirring at 25°C. The concentration of IAPP is 16 μM. Heparan sulfate, when present was at 0.97 μM. DOPG, when present, was at 48 μM. The concentration of heparan sulfate and DOPG were chosen so that the samples would contain the same number of negatively charged sites.
Figure 7
Figure 7
Comparison of I26P-IAPP amyloid formation in the presence of different GAGs. (a) Kinetic profiles. Black, I26P-IAPP in the presence of heparan sulfate; red, I26P-IAPP in the presence of chondroitin sulfate; green, I26P-IAPP in the presence of dermatan sulfate. (b) TEM image of I26P-IAPP in the presence of chondroitin sulfate. (c) TEM image of I26P-IAPP in the presence of dermatan sulfate. Aliquots were removed at the end of each reaction for TEM analysis. Scale bars represent 100 nm. The kinetic experiments were conducted in 20 mM Tris-HCl (pH 7.4), 2% HFIP (v/v) with continuous stirring at 25 °C. The concentration of I26P-IAPP was 16 μM, and the concentration of GAG was 1.3 μM.
Figure 8
Figure 8
Inhibition of IAPP amyloid formation by I26P-IAPP in the absence and presence of heparan sulfate. (a) The results of thioflavin-T binding assays are plotted. Black, wild type IAPP in the absence of heparan sulfate; red, a 1:1 mixture of wild type IAPP and I26P-IAPP in the absence of heparan sulfate; green, a 1:1 mixture of wild type IAPP and I26P-IAPP in the presence of heparan sulfate. (b) TEM image of wild type IAPP in the absence of heparan sulfate. An aliquot was removed at the end of the reaction for TEM analysis as indicated by the black rectangle in panel A. (c) TEM image of a 1:1 mixture of wild type IAPP and I26P-IAPP in the absence of heparan sulfate. An aliquot was removed at the end of the reaction for TEM analysis as indicated by the red triangle in panel A. (d) TEM image of a 1:1 mixture of wild type IAPP and I26P-IAPP in the presence of heparan sulfate in the first plateau. An aliquot was removed in the middle of the first plateau (10 mins) for TEM analysis as indicated by the green circle in panel A. (e) TEM image of a 1:1 mixture of wild type IAPP and I26P-IAPP in the presence of heparan sulfate. An aliquot was removed at the end of the reaction for TEM analysis as indicated by the green star in panel A. Scale bars represent 100 nm. The kinetic experiments were conducted in 20 mM Tris-HCl (pH 7.4), 2% HFIP (v/v) with continuous stirring at 25 °C. The concentration of wild type IAPP was 16 μM. Heparan sulfate, when present, was at 2.6 μM.
Figure 9
Figure 9
Heparan sulfate can induce amyloid formation by a mixture of IAPP and I26P-IAPP. The results of thioflavin-T binding assays are plotted. Red, a 1:1 mixture of wild type IAPP and I26P-IAPP in the absence of heparan sulfate; blue, a 1:1 mixture of wild type IAPP and I26P-IAPP in the presence of heparan sulfate, heparan sulfate was added at the time point as indicated by the black arrow.
Figure 10
Figure 10
Inhibition of IAPP amyloid formation by NMe-G24, NMe-I26-IAPP in the absence and presence of heparan sulfate. (a) The results of thioflavin-T binding assays are plotted. Black, wild type IAPP; red, a 1:1 mixture of wild type IAPP and NMe-G24, NMe-I26-IAPP in the absence of heparan sulfate; green, a 1:1 mixture of wild type IAPP and NMe-G24, NMe-I26-IAPP in the presence of heparan sulfate. (b) An expansion of the first 200 mins of panel A. The same color coding is used. (c) TEM image of a 1:1 mixture of wild type IAPP and NMe-G24, NMe-I26-IAPP in the absence of heparan sulfate. An aliquot was removed at the end of the reaction (563 min) for TEM analysis. (d) TEM image of a 1:1 mixture of wild type IAPP and NMe-G24, NMe-I26-IAPP in the presence of heparan sulfate in the first plateau. An aliquot was removed in the middle of the first plateau (17 min) for TEM analysis. (e) TEM image of a 1:1 mixture of wild type IAPP and NMe-G24, NMe-I26-IAPP in the presence of heparan sulfate. An aliquot was removed at the end of the reaction (333 min) for TEM analysis. Scale bars represent 100 nm. The kinetic experiments were conducted in 20 mM Tris-HCl (pH 7.4), 2% HFIP (v/v) with continuous stirring at 25 °C. The concentration of wild type IAPP was 16 μM. Heparan sulfate, when present, was at 2.6 μM.
Figure 11
Figure 11
Heparan sulfate interferes with the ability of EGCG to inhibit IAPP amyloid formation. (a) Results of fluorescence-monitored thioflavin-T binding assays are displayed. Black, IAPP in the presence of heparan sulfate; grey, a 1:1 mixture of IAPP and EGCG in the absence of heparan sulfate; red, a 1:1 mixture of IAPP and EGCG in the presence of heparan sulfate. (b) TEM image of an aliquot removed at the end of the experiment represented by the black curve in panel A, at the time point corresponding to the black diamond. (c) TEM image of an aliquot removed at the end of the experiment represented by the grey curve in panel A, at the time point corresponding to the grey circle. (d) TEM image of an aliquot removed from the sample represented by the red curve in panel A, at the time point corresponding to the red star. (e) TEM image of an aliquot removed at the end of the experiment represented by the red curve in panel A, at the time point corresponding to the red triangle. Scale bar represent 100 nm. Kinetic experiments were conducted under experimental conditions with 20 mM Tris-HCl, no HFIP and no stirring at 25 °C. The concentration of IAPP was 16 μM. Heparan sulfate, when present, was at 1.3 μM.
Figure 12
Figure 12
EGCG can dissociate amyloid fibrils formed by IAPP in the presence of heparan sulfate. (a) Results of fluorescence-monitored thioflavin-T binding assays are displayed. Black, IAPP in the presence of heparan sulfate; red, a 1:1 mixture of IAPP and EGCG in the presence of heparan sulfate, EGCG was added at the time point indicated by the red arrow. (b) TEM image of an aliquot taken at the end of the experiment represented by the red curve in panel A, at the time point corresponding to the red triangle. Scale bar represent 100 nm. Kinetic experiments were conducted under experimental conditions with 20 mM Tris-HCl, no HFIP and no stirring at 25 °C. The concentration of IAPP was 16 μM. Heparan sulfate was at 1.3 μM.

Similar articles

Cited by

References

    1. Vendruscolo M, Zurdo J, MacPhee CE, Dobson CM. Protein folding and misfolding: a paradigm of self-assembly and regulation in complex biological systems. Philos Trans R Soc Lond Ser A-Math Phys Eng Sci. 2003;361:1205–1222. - PubMed
    1. Sipe JD. Amyloidosis. Crit Rev Clin Lab Sci. 1994;31:325–354. - PubMed
    1. Kirkitadze MD, Bitan G, Teplow DB. Paradigm shifts in Alzheimer’s disease and other neuro degenerative disorders: The emerging role of oligomeric assemblies. J Neurosci Res. 2002;69:567–577. - PubMed
    1. Lorenzo A, Razzaboni B, Weir GC, Yankner BA. Pancreatic islet cell toxicity of amylin associated with type-2 diabetes mellitus. Nature. 1994;368:756–760. - PubMed
    1. Silveira JR, Raymond GJ, Hughson AG, Race RE, Sim VL, Hayes SF, Caughey B. The most infectious prion protein particles. Nature. 2005;437:257–261. - PMC - PubMed

Publication types

Substances