. 2013 Mar;20(3):465-77.
doi: 10.1038/cdd.2012.142. Epub 2012 Nov 16.

The Ca2+/Mn2+ ion-pump PMR1 links elevation of cytosolic Ca(2+) levels to α-synuclein toxicity in Parkinson's disease models

Affiliations

The Ca2+/Mn2+ ion-pump PMR1 links elevation of cytosolic Ca(2+) levels to α-synuclein toxicity in Parkinson's disease models

S Büttner et al. Cell Death Differ. 2013 Mar.

Abstract

Parkinson's disease (PD) is characterized by the progressive loss of dopaminergic neurons, which arises from a yet elusive concurrence between genetic and environmental factors. The protein α-synuclein (αSyn), the principle toxic effector in PD, has been shown to interfere with neuronal Ca(2+) fluxes, arguing for an involvement of deregulated Ca(2+) homeostasis in this neuronal demise. Here, we identify the Golgi-resident Ca(2+)/Mn(2+) ATPase PMR1 (plasma membrane-related Ca(2+)-ATPase 1) as a phylogenetically conserved mediator of αSyn-driven changes in Ca(2+) homeostasis and cytotoxicity. Expression of αSyn in yeast resulted in elevated cytosolic Ca(2+) levels and increased cell death, both of which could be inhibited by deletion of PMR1. Accordingly, absence of PMR1 prevented αSyn-induced loss of dopaminergic neurons in nematodes and flies. In addition, αSyn failed to compromise locomotion and survival of flies when PMR1 was absent. In conclusion, the αSyn-driven rise of cytosolic Ca(2+) levels is pivotal for its cytotoxicity and requires PMR1.


Figures

Figure 1
Figure 1
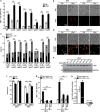
Heterologous expression of αSyn elevates basal [Ca2+]cyt and amplifies transient [Ca2+]cyt responses in yeast. (a) Determination of basal cytosolic Ca2+ levels using aequorin-based luminescence measurement of WT yeast cells expressing human αSyn for indicated time or harbouring the empty vector (Ctrl.). Mean±S.E.M., n=8; ***P<0.001 and **P<0.01. (b) Flow cytometric quantification of oxidative stress indicated by the superoxide-driven conversion of non-fluorescent dihydroethidium to fluorescent ethidium (DHE→Eth.) of WT yeast cells expressing human αSyn for indicated time or harbouring the empty vector (Ctrl.). Mean±S.E.M., n=8; ***P<0.001. (c) Survival determined by clonogenicity of WT yeast cells expressing human αSyn or harbouring the empty vector control for 24 h and 48 h. Cells were plated on YEPD agar plates. Mean±S.E.M., n=10; ***P<0.001. (d) Aequorin-equipped yeast cells harbouring the vector control or expressing αSyn for 16 h were challenged with 150 mM CaCl2 and transient [Ca2+]cyt responses were observed for 70 s. Data was normalized to maximum peak amplitude of control cells. Mean±S.E.M., n=6. (e) Western blot analysis of αSyn expression in WT cells. Cells were harvested at indicated time points after induction of galactose-driven expression. Blots were probed with antibodies directed against FLAG-epitope to detect FLAG-tagged αSyn and against glyceraldehyd-3-phosphate dehydrogenase (GAPDH) as loading control. (f) Fluorescence microscopic analysis of WT cells expressing GFP-tagged αSyn (αSynGFP) or harbouring the corresponding vector control (Ctrl.GFP) at indicated time points. (g) Determination of basal cytosolic Ca2+ levels using aequorin-based luminescence measurement of yeast cells expressing human αSyn or harbouring the empty vector (Ctrl.) after growth for 12 h, 20 h or 24 h on galactose media (promoter induction) supplemented or not with 2 mM ethylene glycol tetraacetic acid (EGTA). Data has been normalized to equally treated vector control cells. Mean±S.E.M., n=6; **P<0.01 and *P<0.05. (h) Flow cytometric quantification of oxidative stress by assessing the ROS-driven conversion of dihydroethidium to ethidium (DHE→Eth) upon expression of αSyn for indicated time and supplementation of media with 2 mM EGTA. Mean±S.E.M., n=4–8; ***P<0.001 and **P<0.01. (i) Survival determined by clonogenicity of yeast cells expressing αSyn or harbouring the empty vector control for 48 h and supplementation of galactose medium with 2 mM EGTA. Cells were plated on YEPD agar plates. Mean±S.E.M., n=12; ***P<0.001
Figure 2
Figure 2
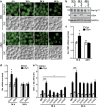
The antioxidant NAC inhibits αSyn cytotoxicity. (a) Survival determined by clonogenicity of yeast cells expressing αSyn or harbouring the empty vector. Galactose growth medium (for promoter induction) has been supplemented or not with 20 mM or 30 mM NAC as indicated and cells were plated on YEPD agar plates at day 1 and day 2 to determine survival. Mean±S.E.M., n=12–18. Significances have been calculated for day 2, with ***P<0.001 and **P<0.01. (b) Flow cytometric quantification of oxidative stress by assessing the ROS-driven conversion of dihydroethidium to ethidium (DHE→Eth) of cells described in (a). Mean±S.E.M., n=8. Significances have been calculated for day 2, with ***P<0.001 and *P<0.05. (c) Representative micrographs of dihydroethidium to ethidium (DHE→Eth) staining of cells expressing αSyn or harbouring the empty vector after supplementation of galactose growth medium with 20 mM NAC for 2 days as flow cytometrically quantified in (b). (d) Determination of basal cytosolic Ca2+ levels using aequorin-based luminescence measurement of yeast cells expressing αSyn or harbouring the empty vector after growth on galactose media supplemented or not with indicated concentrations of NAC for 20 h. Data has been normalized to equally treated vector control cells. Mean±S.E.M., n=8; **P<0.01 and *P<0.05
Figure 3
Figure 3
The Ca2+/Mn2+ ATPase Pmr1p mediates αSyn cytotoxicity. (a and b) Quantification via fluorescence reader (a) and representative micrographs (b) of ROS production by assessing the ROS-driven conversion of dihydroethidium to ethidium (DHE→Eth) upon expression of αSyn for 24 h in WT yeast cells and indicated deletion mutants. Mean±S.E.M., n=8; ***P<0.001 and **P<0.01. (c and d) Flow cytometric quantification (c) and representative micrographs (d) of externalization of phosphatidylserine (AnnV+) and loss of membrane integrity (PI+) by Annexin V/PI co-staining of WT cells and indicated deletion mutants expressing αSyn for 48 h. Mean±S.E.M., n=6; ***P<0.001. (e) Western blot analysis of αSyn expression in WT cells and indicated deletion mutants. Blots were probed with antibodies against FLAG-epitope to detect FLAG-tagged αSyn and against glyceraldehyd-3-phosphate dehydrogenase (GAPDH) as loading control. (f) Survival determined by clonogenicity of WT and Δpmr1 yeast cells expressing αSyn or harbouring the vector control after 24 h and 48 h of expression on galactose media and plating on YEPD agar plates. Mean±S.E.M., n=10; ***P<0.001. (g) Quantification of ROS accumulation (DHE→Eth) in yeast cells in which the promoter region of PMR1 has been replaced by a doxycycline-repressible promoter (TetO-PMR1). Doxycycline (Doxy) was added in indicated concentrations and αSyn was expressed for 24 h or 48 h. Mean±S.E.M., n=8; ***P<0.001. (h) Q-PCR-based quantification of PMR1 mRNA levels in yeast cells described in (g) after treatment with 10 μg/ml Doxycycline (Doxy) and αSyn expression for 12 h. Data have been normalized to mRNA levels of actin. Means±S.E.M., n=3. Asterisks indicate significance between untreated and Doxy-treated cells, ***P<0.001
Figure 4
Figure 4
Expression of αSyn causes a slight upregulation of PMR1 and CCH1 mRNA levels. (a) Representative micrographs of yeast cells expressing endogenously GFP-tagged Pmr1p in combination with αSyn or corresponding vector control at indicated time points after induction of αSyn expression. (b) Western blot analysis of cells described in (a) at indicated time points after induction of αSyn expression. Blots were probed with antibodies against GFP to detect Pmr1p-GFP fusion protein, against FLAG-epitope to detect FLAG-tagged αSyn and against glyceraldehyd-3-phosphate dehydrogenase (GAPDH) as loading control. (c and d) Q-PCR-based quantification of PMR1 mRNA levels (c) and of CCH1 and MID1 mRNA levels (d) in WT cells expressing αSyn or harbouring the empty vector control for 14 h or 24 h, respectively, normalized to actin mRNA levels. Means±S.E.M., n=6–9; *P<0.05. (e) Quantification of ROS accumulation (DHE→Eth) in WT yeast cells and indicated deletion mutants expressing αSyn for 16 h or 24 h using a fluorescence reader. Mean±S.E.M., n=6; ***P<0.001 and *P<0.05
Figure 5
Figure 5
Pmr1p is involved in αSyn-induced dysregulation of Ca2+ homeostasis. (a) Aequorin-luminescence-based determination of basal cytosolic Ca2+ levels in WT cells and indicated deletion mutants expressing αSyn for 20 h. Data was normalized to corresponding isogenic vector control. Mean±S.E.M., n=12; ***P<0.001; NS, not significant. (b) Aequorin-equipped WT and Δpmr1 yeast cells expressing αSyn or harbouring the vector control were challenged with 150 mM CaCl2 and transient [Ca2+]cyt responses were observed for 50 s. Mean±S.E.M., n=6. (c) Western blot analysis of aequorin expression and αSyn expression in WT cells and indicated deletion mutants. Blots were probed with antibodies directed against aequorin, against FLAG-epitope to detect FLAG-tagged αSyn and against glyceraldehyd-3-phosphate dehydrogenase (GAPDH) as loading control. (d) Aequorin-equipped WT and Δpmr1 cells constitutively expressing αSyn (using the expression vector pGGE181) or harbouring the empty pGGE181 vector (Ctrl.) were starved for glucose, supplemented with low doses of Ca2+ (10 mM) and subsequently challenged with 80 mM glucose. Transient [Ca2+]cyt responses were monitored. Data represent average recordings, n≥9. (e) Maximum [Ca2+]cyt peak amplitude after addition of 80 mM glucose as depicted in (d) in aequorin-equipped WT cells and indicated deletion mutants upon expression of αSyn. Mean±S.E.M., n≥9; ***P<0.001; NS, not significant
Figure 6
Figure 6
Expression of Pmr1p restores αSyn cytotoxicity and supresses manganese toxicity of PMR1-deficient cells. (a) Spotting assays of WT and Δpmr1 yeast cells expressing αSyn or harbouring the vector control. Cells were grown for 24 h in galactose media and spotted in fivefold serial dilutions onto glucose (αSyn expression repressed) and galactose (αSyn expression induced) agar plates supplemented or not with 2 mM or 4 mM Mn2+, respectively. (b) Spotting assays of WT and Δpmr1 yeast cells expressing either αSyn or Pmr1p alone or in combination or harbouring the corresponding vector controls. Cells were grown for 24 h in galactose media and spotted in fivefold serial dilutions onto glucose (Pmr1p and αSyn expression repressed) and galactose (Pmr1p and αSyn expression induced) agar plates supplemented or not with 4 mM Mn2+. (c) Quantification of clonogenic survival of cells described in (b) after plating on galactose agar plates supplemented or not with 4 mM Mn2+. Both Pmr1p as well as αSyn expression are driven by a galactose promoter. Mean±S.E.M., n=8–12; ***P<0.001 and **P<0.01; NS, not significant. Unless otherwise specified, asterisks indicate significances to similarly treated, isogenic control cells harbouring both empty vectors
Figure 7
Figure 7
Ca2+ rather than Mn2+ transport activity of Pmr1p contributes to αSyn toxicity. (a) Spotting assays of WT and Δpmr1 yeast cells expressing either Pmr1p or the point mutants Pmr1pD53A and Pmr1pQ783A alone or in combination with αSyn. Cells were grown for 24 h in galactose media and spotted in fivefold serial dilutions onto glucose (Pmr1p and αSyn expression repressed) and galactose (Pmr1p and αSyn expression induced) plates supplemented or not with 1 mM and 4 mM Mn2+. (b) Cells described in (a) were subjected to clonogenic survival plating on galactose plates supplemented or not with 1 mM Mn2+. Survival has been normalized to WT cells harbouring both empty vectors plated on galactose plates without manganese. Mean±S.E.M., n=12–16. (c) Western blot analysis of Pmr1p, Pmr1pD53A and Pmr1pQ783A overexpression as well as of αSyn expression in WT and Δpmr1 yeast cells. Blots were probed with antibodies directed against FLAG-epitope to detect FLAG-tagged Pmr1p variants and αSyn and against glyceraldehyd-3-phosphate dehydrogenase (GAPDH) as loading control
Figure 8
Figure 8
PMR1 is critical for αSyn neurotoxicity in nematodes and flies. (a) Survival of C. elegans dopaminergic neurons in WT or PMR-1-deficient (pmr-1(tm1840)) animals expressing GFP and α-Syn. Mean±S.E.M., n>250 individual animals; ***P<0.001. (b) Fluorescence-based quantification of cytoplasmic Ca2+ levels in WT or PMR-1-deficient (pmr-1(tm1840)) nematodes expressing the Ca2+ indicator GCaMP2.0 and α-Syn. Mean±S.E.M., n>150 dopaminergic neurons. ***P<0.001. (c and d) Survival of male (c) and female (d) WT flies and of flies either expressing human αSyn or an RNAi depleting SPoCk (the Drosophila homologue of PMR1) or both (driven by elav-GAL4) upon supplementation of food (10% sucrose) with 20 mM Mn2+. Means±S.E.M., n=12–20 with 35–40 flies per experiment; ***P<0.001. (e) Immunoblot analysis of brain lysats obtained from flies expressing human αSyn driven by elav-GAL4 with or without co-expression of an RNAi-depleting SPoCk using antibodies directed against human αSyn or Drosophila α-tubulin as loading control. (f) Climbing activity of female flies described in (d) after 24 h of Mn2+ treatment. Means±S.E.M., n=6–10 with 8 flies per experiment; ***P<0.001 and *P<0.05. (g and h) Total count of tyrosine hydroxylase (TH)-immunoreactive dopaminergic neurons (g) in the DM, PM and DL1 brain clusters of female flies expressing αSyn alone or in combination with an RNAi-depleting SPoCk after treatment with Mn2+ for 96 h. Representative confocal microscopy images of dissected brains immunostained for TH and for Bruchpilot (BRPNc82) to visualize brain structure are shown in (h). Neuronal counts were quantified by inspection of the individual planes of the z-stack. Means±S.E.M., n=5–10; **P<0.01 and *P<0.05

References

    1. Spillantini MG, Schmidt ML, Lee VM, Trojanowski JQ, Jakes R, Goedert M. Alpha-synuclein in Lewy bodies. Nature. 1997;388:839–840. - PubMed
    1. Kruger R, Kuhn W, Müller T, Woitalla D, Graeber M, Kösel S, et al. Ala30Pro mutation in the gene encoding alpha-synuclein in Parkinson's disease. Nat.Genet. 1998;18:106–108. - PubMed
    1. Singleton AB, Farrer M, Johnson J, Singleton A, Hague S, Kachergus J, et al. alpha-Synuclein locus triplication causes Parkinson's disease. Science. 2003;302:841. - PubMed
    1. Zarranz JJ, Alegre J, Gómez-Esteban JC, Lezcano E, Ros R, Ampuero I, et al. The new mutation, E46K, of alpha-synuclein causes Parkinson and Lewy body dementia. Ann.Neurol. 2004;55:164–173. - PubMed
    1. Farrer M, Kachergus J, Forno L, Lincoln S, Wang DS, Hulihan M, et al. Comparison of kindreds with parkinsonism and alpha-synuclein genomic multiplications. Ann. Neurol. 2004;55:174–179. - PubMed

Publication types

MeSH terms