. 2013 Jan;161(1):362-73.
doi: 10.1104/pp.112.205922. Epub 2012 Nov 15.

Regulation of miR399f transcription by AtMYB2 affects phosphate starvation responses in Arabidopsis

Affiliations

Regulation of miR399f transcription by AtMYB2 affects phosphate starvation responses in Arabidopsis

Dongwon Baek et al. Plant Physiol. 2013 Jan.

Abstract

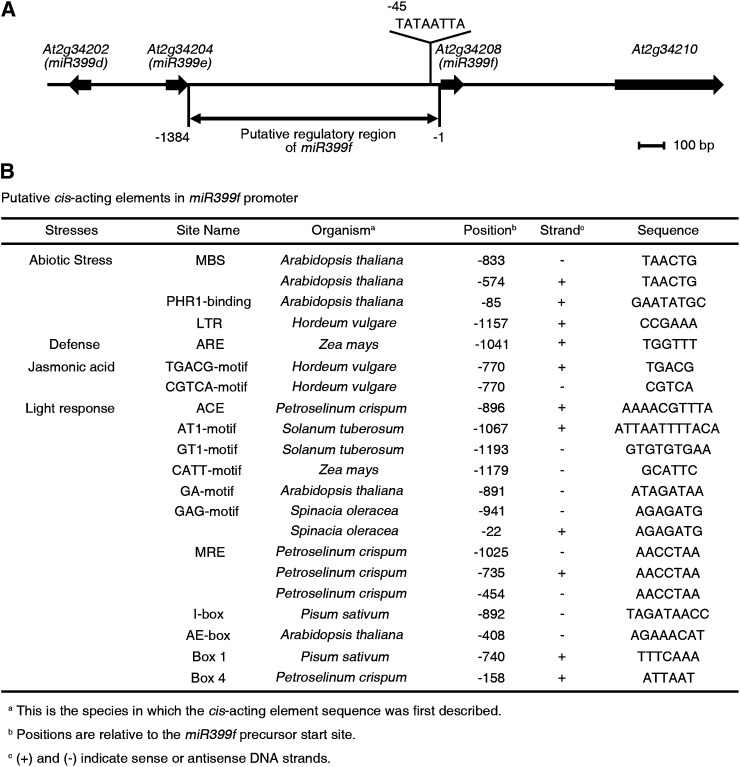
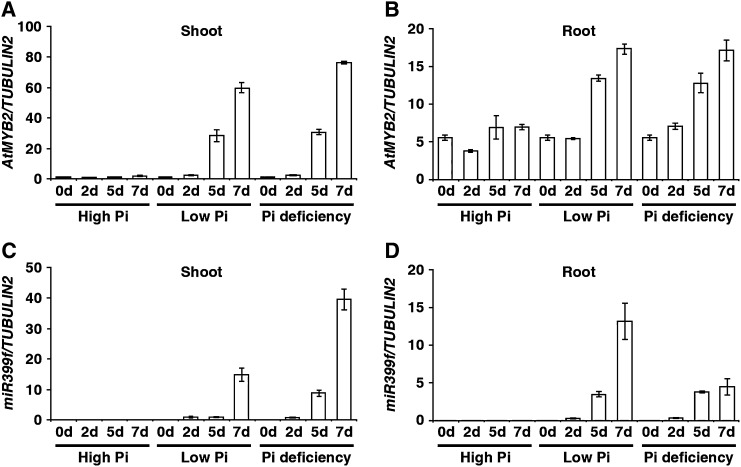
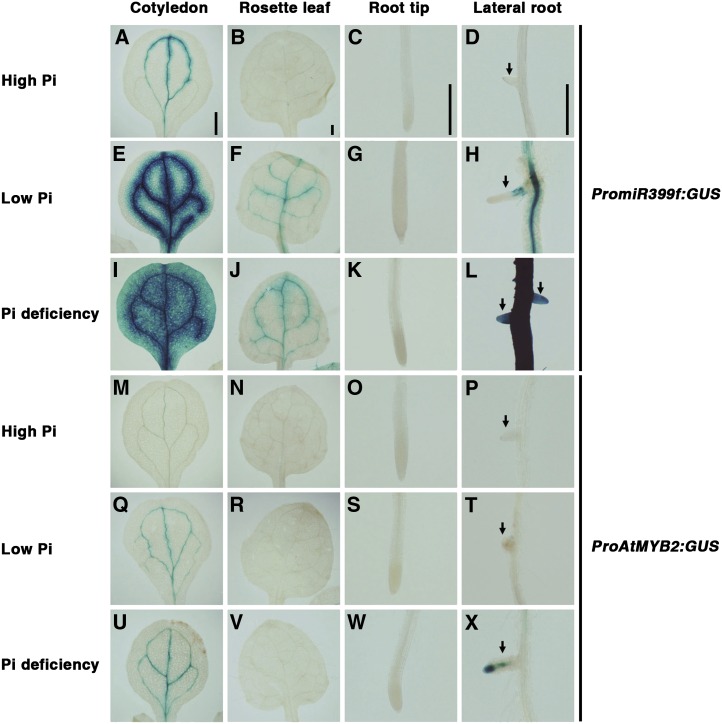
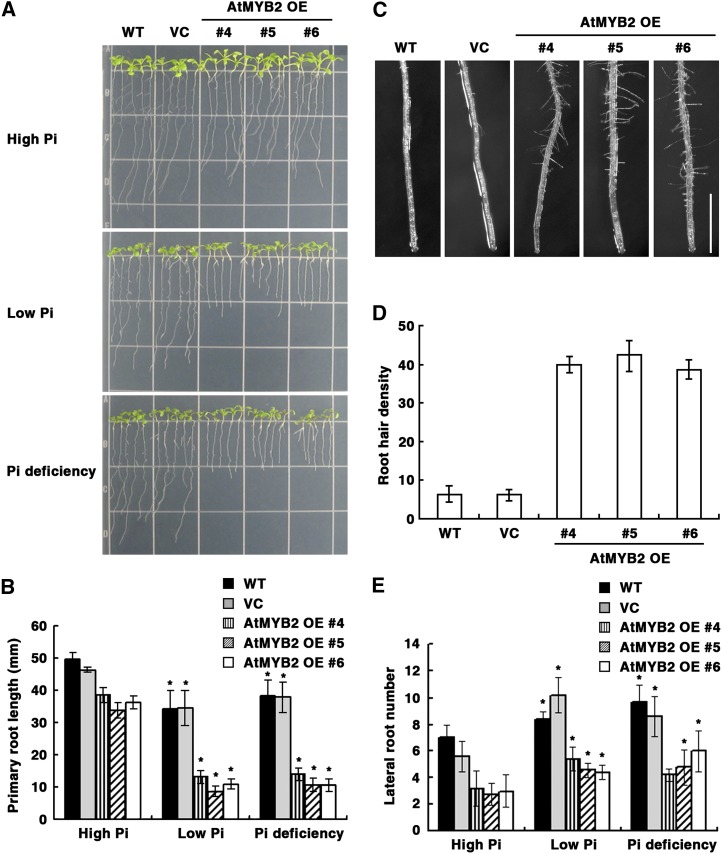
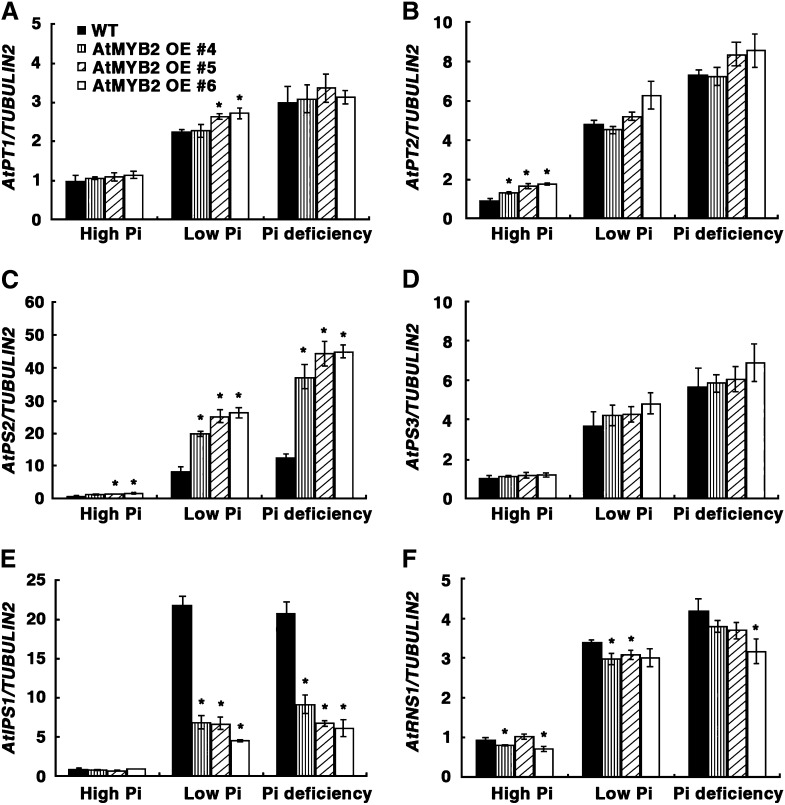
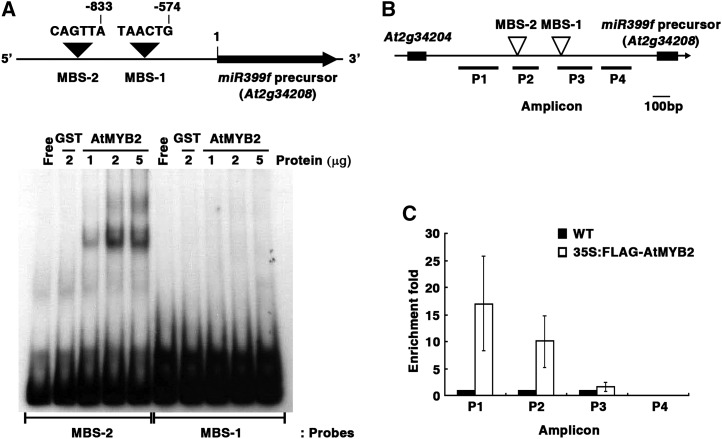
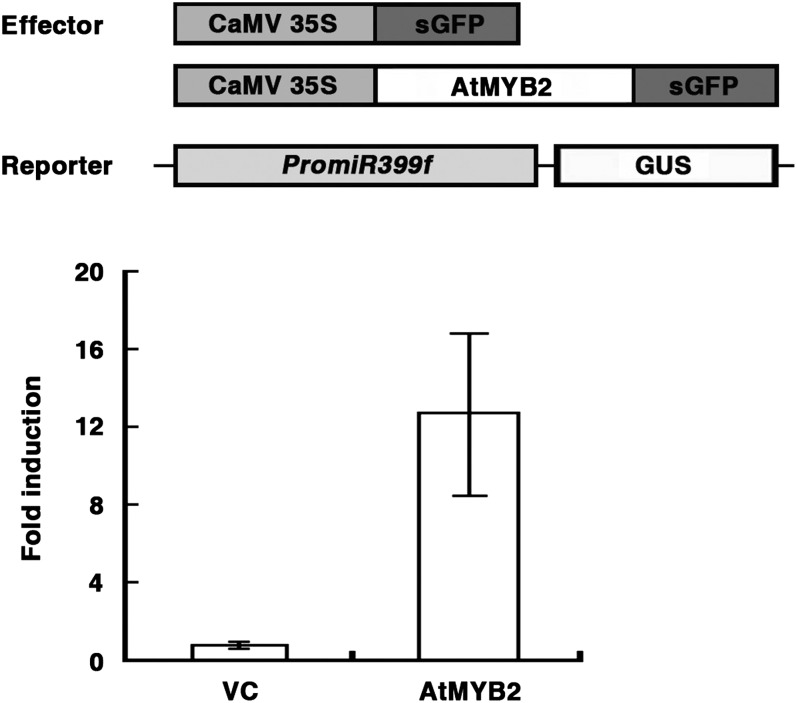
Although a role for microRNA399 (miR399) in plant responses to phosphate (Pi) starvation has been indicated, the regulatory mechanism underlying miR399 gene expression is not clear. Here, we report that AtMYB2 functions as a direct transcriptional activator for miR399 in Arabidopsis (Arabidopsis thaliana) Pi starvation signaling. Compared with untransformed control plants, transgenic plants constitutively overexpressing AtMYB2 showed increased miR399f expression and tissue Pi contents under high Pi growth and exhibited elevated expression of a subset of Pi starvation-induced genes. Pi starvation-induced root architectural changes were more exaggerated in AtMYB2-overexpressing transgenic plants compared with the wild type. AtMYB2 directly binds to a MYB-binding site in the miR399f promoter in vitro, as well as in vivo, and stimulates miR399f promoter activity in Arabidopsis protoplasts. Transcription of AtMYB2 itself is induced in response to Pi deficiency, and the tissue expression patterns of miR399f and AtMYB2 are similar. Both genes are expressed mainly in vascular tissues of cotyledons and in roots. Our results suggest that AtMYB2 regulates plant responses to Pi starvation by regulating the expression of the miR399 gene.


Figures

Figure 1.
Figure 1.
Putative cis-acting regulatory elements in the miR399f promoter. A, Genomic organization of miR399f (At2g34208) flanking regions. The location of the TATA-like sequence (TATAATTA) of the miR399f gene is indicated. B, Putative cis-acting regulatory sequences on the miR399 promoter. An area 1,384 bp upstream of the transcription start site was analyzed using PlantCARE. The selected matrix score for all cis-acting elements was 5 or greater. MBS, MYB2-binding site; LTR, low-temperature response; ARE, anaerobic response element; ACE, ACGT-containing element; MRE, MYB recognition element; AE-box, activating element box.
Figure 2.
Figure 2.
Expression of AtMYB2 and the miR399f precursor is induced in response to phosphate deficit. A to D, Wild-type plants were grown on MS medium for 7 d, transferred to high-Pi, low-Pi, or Pi-deficient growth medium, and allowed to grow further for 0, 2, 5, and 7 d. Transcript levels were measured by qRT-PCR in total RNA extracted from shoots and roots at the indicated time points. Transcript levels of AtMYB2 (A and B) and miR399f precursor (C and D), normalized to the transcript level of TUBULIN2, are shown. Bars represent means ± sd of three biological replicates with two technical replicates each.
Figure 3.
Figure 3.
Spatial expression patterns of miR399f and AtMYB2. Seeds of PromiR399f:GUS and ProAtMYB2:GUS transgenic lines, which express the GUS reporter from the miR399f and AtMYB2 promoters, respectively, were grown as described in Figure 5. Tissues were stained 7 d after transfer to high-Pi, low-Pi, or Pi-deficient medium. Blue color indicates GUS activity. A to L, Tissues of PromiR399f:GUS transgenic plants. M to X, Tissues of ProAtMYB2:GUS transgenic plants. Arrows indicate lateral roots. Bars = 0.5 mm.
Figure 4.
Figure 4.
OE of AtMYB2 induces miR399f expression and Pi accumulation. Wild type (WT) and three independent lines of CaMV35S:AtMYB2 (AtMYB2 OE) were grown in MS medium. Ten-day-old seedlings were analyzed. A and B, Expression levels of AtMYB2 (A) and UBC24 (B), normalized to the level of TUBULIN2. Transcript levels were analyzed in total RNA extracted from the seedlings by qRT-PCR. Bars represent means ± sd for three biological replicates with two technical replicates each. C, Northern-blot analysis of miR399f expression in total RNA. Ethidium bromide-stained 5S rRNA bands are shown as loading controls. D, Inorganic Pi concentrations were measured in the roots and shoots. Bars represent means ± sd for two biological replicates. Asterisks represent significant differences from the wild type (P ≤ 0.05 from a Student’s t test). F.W., Fresh weight.
Figure 5.
Figure 5.
AtMYB2 OE enhances Pi deficiency responses in root development and also affects root hair development. A, Seeds of the untransformed wild type (WT), empty vector control (VC) transformants, and three independent lines of AtMYB2 OE transformants were grown on MS agar medium for 5 d and then transferred to nutrient medium containing 1.25 mm (high Pi), 0.0125 mm (low Pi), or 0 mm (Pi deficiency) KH2PO4. Seedlings were photographed 7 d after transfer. B, Quantification of primary root lengths of the seedlings depicted in A. Bars represent means ± se of three replicates with 16 seedlings per replicate. Asterisks represent significant differences from the values of each line under the high-Pi condition (P ≤ 0.05 from a Student’s t test). C, Root hair development at tips of the primary root of seedlings grown in MS medium for 7 d. Bar = 1 mm. D, Quantification of root hair densities at the primary root tip of plants shown in C. Root density is the number of root hairs along 5 mm of each root above the tip. Bars represent means ± se of three replicates with 16 seedlings per replicate. E, Quantification of lateral root numbers per plant of the seedlings depicted in A. Bars represent means ± se of three replicates with 16 seedlings per replicate. Asterisks represent significant differences from the values of each line under the high-Pi condition (P ≤ 0.05 from a Student’s t test).
Figure 6.
Figure 6.
Expression patterns of Pi starvation-induced genes in AtMYB2 OE plants. Seeds of the untransformed wild type (WT) and three independent lines of AtMYB2 OE transformants were grown on MS agar medium for 7 d and then transferred to the high-Pi, low-Pi, or Pi-deficient medium described in Figure 4. Transcript levels of AtPT1 (A), AtPT2 (B), AtPS2 (C), AtPS3 (D), AtIPS1 (E), and AtRNS1 (F) were analyzed by qRT-PCR in total RNA extracted from the seedlings 7 d after transfer. The TUBULIN2 transcript level was used for normalization. Bars represent means ± sd of three biological replicates with two technical replicates each. Asterisks represent significant differences from the wild type (P ≤ 0.05 from a Student’s t test).
Figure 7.
Figure 7.
AtMYB2 binds to MBS-2 on the miR399f promoter region. A, Top, schematic representation of predicted MYB-binding sites (MBS-1 and MBS-2) in the miR399f promoter. Bottom, EMSA of the binding of recombinant AtMYB2 protein to oligonucleotides spanning the MBS-2 and MBS-1 regions. The autoradiogram shows resolved binding reactions of 32P-labeled DNA probes (MBS-2 and MBS-1) without protein (Free) or with the indicated amounts of AtMYB2-GST (AtMYB2) or GST (negative control). B, Schematic drawing of the miR399f locus and locations of the ChIP assay amplicons (P1–P4). C, ChIP assay for miR399f chromatin regions associated with AtMYB2. The ChIP assay was performed on total protein extracts of MS-grown 3-week-old seedlings of the untransformed wild type (WT) and CaMV35S:FLAG-AtMYB2 transformed Arabidopsis. Fold enrichment is the ratio of CaMV35S:FLAG-AtMYB2 to wild-type signal. Bars represent means ± sd for three technical replicates.
Figure 8.
Figure 8.
AtMYB2 enhances the miR399f promoter activity. Top, schematic representation of the effector and reporter constructs used in the transient expression assay of miR399f promoter activity. Each effector construct was introduced into atmyb2-3 protoplasts along with the reporter construct and an internal control CaMV35S:LUC construct by polyethylene glycol-mediated transformation. Bottom, GUS reporter activity in each sample was obtained after normalization to LUC activity. Fold induction is the ratio of the GUS activity of CaMV35S:AtMYB2-sGFP transformed protoplasts (AtMYB2) relative to the GUS activity of CaMV35S:sGFP transformed protoplasts (vector control [VC]). Bars represent means ± sd of three technical replicates.

References

    1. Abe H, Urao T, Ito T, Seki M, Shinozaki K, Yamaguchi-Shinozaki K. (2003) Arabidopsis AtMYC2 (bHLH) and AtMYB2 (MYB) function as transcriptional activators in abscisic acid signaling. Plant Cell 15: 63–78 - PMC - PubMed
    1. Abe H, Yamaguchi-Shinozaki K, Urao T, Iwasaki T, Hosokawa D, Shinozaki K. (1997) Role of Arabidopsis MYC and MYB homologs in drought- and abscisic acid-regulated gene expression. Plant Cell 9: 1859–1868 - PMC - PubMed
    1. Aung K, Lin SI, Wu CC, Huang YT, Su CL, Chiou TJ. (2006) pho2, a phosphate overaccumulator, is caused by a nonsense mutation in a microRNA399 target gene. Plant Physiol 141: 1000–1011 - PMC - PubMed
    1. Baek D, Nam J, Koo YD, Kim DH, Lee J, Jeong JC, Kwak SS, Chung WS, Lim CO, Bahk JD, et al. (2004) Bax-induced cell death of Arabidopsis is meditated through reactive oxygen-dependent and -independent processes. Plant Mol Biol 56: 15–27 - PubMed
    1. Baldwin JC, Karthikeyan AS, Raghothama KG. (2001) LEPS2, a phosphorus starvation-induced novel acid phosphatase from tomato. Plant Physiol 125: 728–737 - PMC - PubMed

Publication types

MeSH terms