. 2013 Jan 11;288(2):1295-306.
doi: 10.1074/jbc.M112.409250. Epub 2012 Nov 15.

Inhibition of glycogen synthase kinase-3 ameliorates β-amyloid pathology and restores lysosomal acidification and mammalian target of rapamycin activity in the Alzheimer disease mouse model: in vivo and in vitro studies

Affiliations

Inhibition of glycogen synthase kinase-3 ameliorates β-amyloid pathology and restores lysosomal acidification and mammalian target of rapamycin activity in the Alzheimer disease mouse model: in vivo and in vitro studies

Limor Avrahami et al. J Biol Chem. .

Abstract

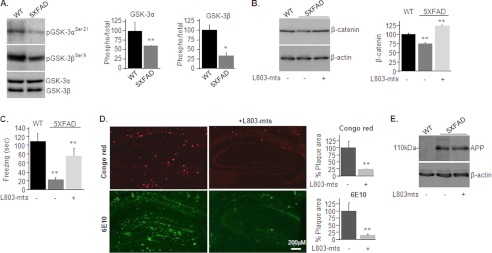
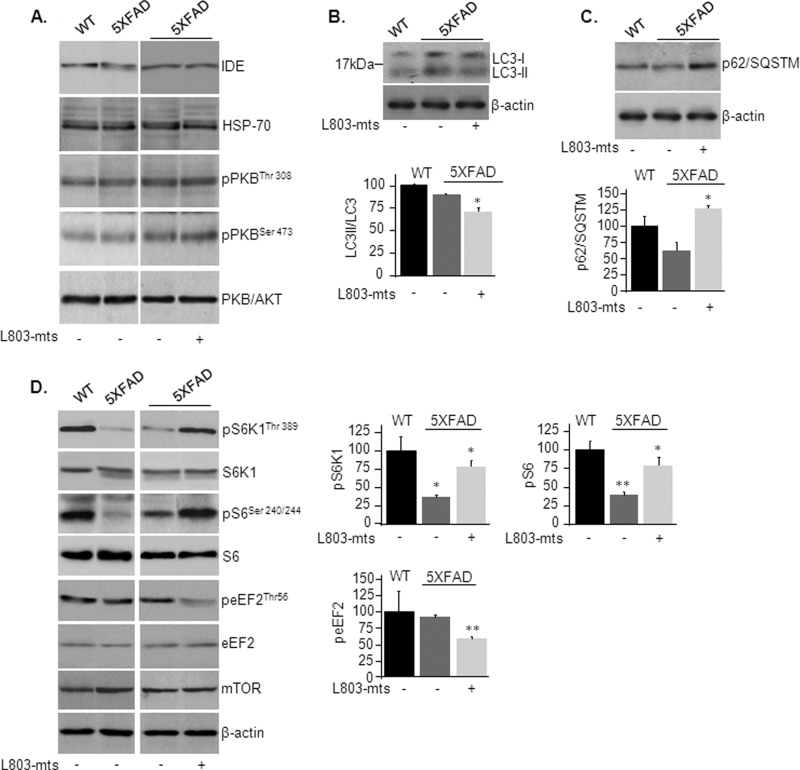
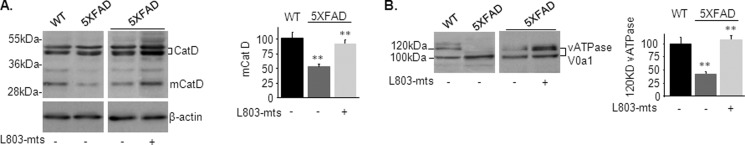
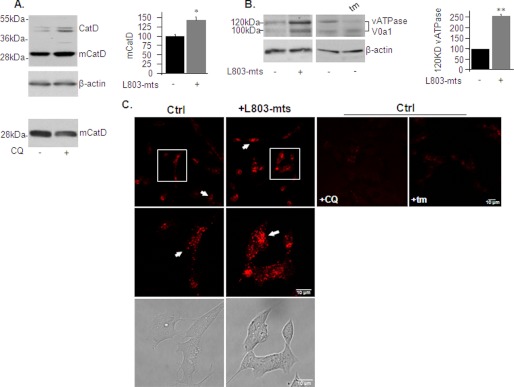
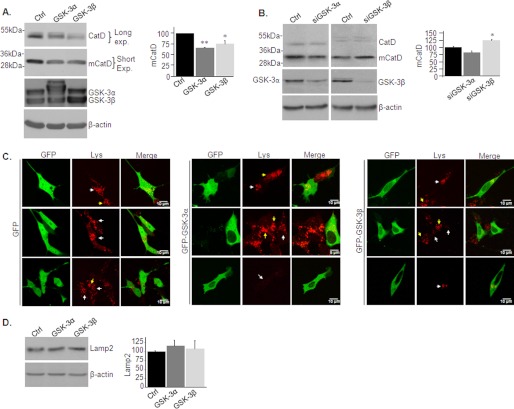
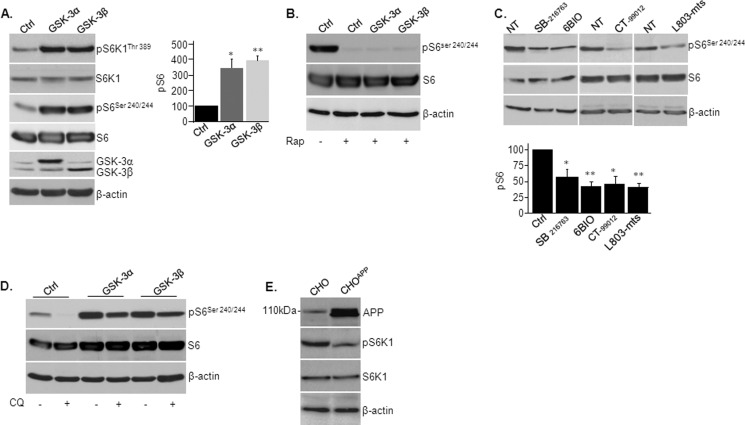
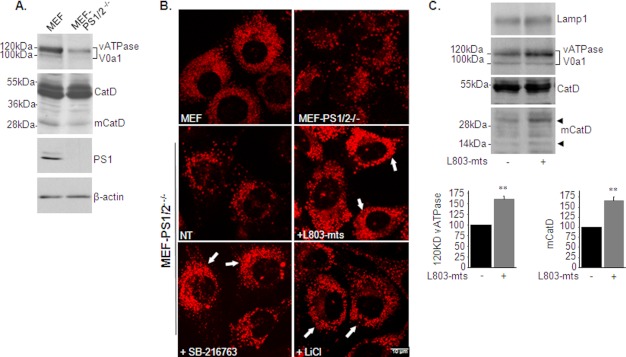
Accumulation of β-amyloid (Aβ) deposits is a primary pathological feature of Alzheimer disease that is correlated with neurotoxicity and cognitive decline. The role of glycogen synthase kinase-3 (GSK-3) in Alzheimer disease pathogenesis has been debated. To study the role of GSK-3 in Aβ pathology, we used 5XFAD mice co-expressing mutated amyloid precursor protein and presenilin-1 that develop massive cerebral Aβ loads. Both GSK-3 isozymes (α/β) were hyperactive in this model. Nasal treatment of 5XFAD mice with a novel substrate competitive GSK-3 inhibitor, L803-mts, reduced Aβ deposits and ameliorated cognitive deficits. Analyses of 5XFAD hemi-brain samples indicated that L803-mts restored the activity of mammalian target of rapamycin (mTOR) and inhibited autophagy. Lysosomal acidification was impaired in the 5XFAD brains as indicated by reduced cathepsin D activity and decreased N-glycoyslation of the vacuolar ATPase subunit V0a1, a modification required for lysosomal acidification. Treatment with L803-mts restored lysosomal acidification in 5XFAD brains. Studies in SH-SY5Y cells confirmed that GSK-3α and GSK-3β impair lysosomal acidification and that treatment with L803-mts enhanced the acidic lysosomal pool as demonstrated in LysoTracker Red-stained cells. Furthermore, L803-mts restored impaired lysosomal acidification caused by dysfunctional presenilin-1. We provide evidence that mTOR is a target activated by GSK-3 but inhibited by impaired lysosomal acidification and elevation in amyloid precursor protein/Aβ loads. Taken together, our data indicate that GSK-3 is a player in Aβ pathology. Inhibition of GSK-3 restores lysosomal acidification that in turn enables clearance of Aβ burdens and reactivation of mTOR. These changes facilitate amelioration in cognitive function.


Figures

FIGURE 1.
FIGURE 1.
L803-mts reduces Aβ plaque loads and improves cognitive performance in the 5XFAD mouse model. A, phosphorylation and expression levels of GSK-3α/β in brain samples of WT and 5XFAD mice as determined by immunoblot analysis. B, β-catenin levels in brain samples from WT and L803-mts-treated or nontreated 5XFAD mice as determined by immunoblot analysis. Densitometry analyses of indicated bands or calculated ratios are shown on the right for each panel. C, freezing time duration determined in WT mice and in L803-mts-treated or nontreated 5XFAD mice, as evaluated in the contextual fear conditioning test. D, representative histological images of paraformaldehyde-fixed hemi-brain sections obtained from L803-mts-treated or nontreated 5XFAD mice. The upper panels show a Congo red stain, and the lower panels show an immunostaining using anti-Aβ antibody (6E10). The percentage of plaque load area is shown on the right. E, expression levels of APP in brain samples from WT and L803-mts-treated or nontreated 5XFAD mice as determined by immunoblot analysis. Densitometry analyses for all panels are the means ± S.E. of five or six animals. *, p < 0.05; **, p < 0.005. Equal protein loads were verified by β-actin blots (B and E).
FIGURE 2.
FIGURE 2.
L803-mts reactivates mTOR and inhibits autophagy in the 5XFAD mice. A, phosphorylation and/or expression levels of insulin-degrading enzyme (IDE), Hsp70, and AKT/PKB in brain samples from WT and L803-mts-treated or nontreated 5XFAD mice as determined by immunoblot analysis. B, LC3-I and LC3-II levels in brain samples from WT and L803-mts-treated or nontreated 5XFAD mice as determined by immunoblot analysis. Calculated ratios of LC3-II/total LC3 are shown in the lower panel. C, levels of p62/SQSTM in brain samples from WT and L803-mts-treated or nontreated 5XFAD mice as determined by immunoblot analysis. Densitometry analyses are shown in the lower panel. D, phosphorylation of mTOR targets S6K1, S6, and eEF2 in brain samples from WT and L803-mts-treated or nontreated 5XFAD mice as determined by immunoblot analysis. Expression of total protein and total mTOR is also shown. Densitometry analyses of indicated bands are shown on the right. For all panels, the results are the means ± S.E. of five or six animals. *, p < 0.05; **, p < 0.005. Equal protein loads were verified by β-actin blots (B–D).
FIGURE 3.
FIGURE 3.
L803-mts restores impaired lysosomal acidification in the 5XFAD mouse brain. A, levels of precursor CatD (46–52 kDa) and the proteolytic product mCatD (32 kDa) in brain samples from WT and L803-mts-treated or nontreated 5XFAD mice as determined by immunoblot analysis. β-Actin levels are also shown. B, glycosylated (120 kDa) and nonglycosylated (100 kDa) v-ATPase V0a1 in brain samples from WT and L803-mts-treated or nontreated 5XFAD mice as determined by immunoblot analysis. Densitometry analysis of indicated proteins is shown on the right of each panel. The results are the means ± S.E. of five or six animals. *, p < 0.05; **, p < 0.005.
FIGURE 4.
FIGURE 4.
L803-mts increases lysosomal acidification in SHSY-5Y cells. A, SHSY-5Y cells were treated with L803-mts (40 μm, 5 h), and the levels of CatD (46–52 kDa) and mCatD (32 kDa) were determined by immunoblot analysis. Treatment of cells with chloroquine (CQ) (30 μm, 3 h) is shown in the bottom panel. The β-actin levels are also shown. B, SHSY-5Y cells were treated as in A or treated with tunicamycin (tm) (5 μg/ml, 2 h). Levels of glycosylated or nonglycosylated v-ATPase V0a1 were determined by immunoblot analysis. The β-actin levels are also shown. Densitometry analysis of indicated proteins is shown on the right. The results are the means of three independent experiments ± S.E. *, p < 0.05; **, p < 0.005. C, SHSY-5Y cells were treated with L803-mts, chloroquine (CQ), or tunicamycin (tm) as described. The cells were stained with LysoTracker Red (Lys) and imaged by confocal microscopy. White arrows mark lysosomal red vesicles (top panels). Zooms of the boxed areas in the top panels are shown in the middle panels. Bright filled cell images are shown in the bottom panels. The fluorescence images present Z-projection image stacks (23 images). Scale bars represent 10 μm. Ctrl, control.
FIGURE 5.
FIGURE 5.
GSK-3 impairs lysosomal acidification in SHSY-5Y cells. A, SHSY-5Y cells were infected with adenovirus coding for GSK-3α or GSK-3β. The levels of CatD (46–52 kDa) and mCatD (32 kDa) were determined by immunoblot analysis. Long and short exposures are shown to allow detection of CatD and mCatD within the linear range. Control cells were infected with a β-gal-coding adenovirus (Ctrl). Expression of GSK-3α/β are shown in the middle and right panels. B, SHSY-5Y cells were transfected with siRNA targeting GSK-3α or GSK-3β. The levels of CatD (46–52 kDa) and mCatD (32 kDa) were determined by immunoblot analysis. Control cells were transfected with scrambled control siRNA (Ctrl). Densitometry analysis of indicated proteins is shown on the right of each panel. The results are the means of three independent experiments ± S.E. *, p < 0.05; **, p < 0.005. C, SH-SY5Y cells were transfected with GFP-GSK-3α or GFP-GSK-3β constructs. Control cells were transfected with a GFP coding construct. The cells were stained with LysoTracker Red (Lys) and imaged by confocal microscopy. Representative images are shown as indicated. The arrows indicate acidic lysosomes in the transfected cells (white arrows) or in the nontransfected cells (yellow arrows). The fluorescence images in the top panels represent Z-projection image stacks (23 images). The scale bars represent 5 or 10 μm. D, levels of Lamp2 were determined in cells from C. Equal protein loads were verified by β-actin blots (A, B, and D).
FIGURE 6.
FIGURE 6.
Regulation of mTOR activity by GSK-3, lysosomes, and APP. A, SHSY-5Y cells were infected with adenovirus coding for GSK-3α or GSK-3β. Phosphorylation levels of indicated mTOR targets were determined by immunoblot analysis. Densitometry analysis of indicated proteins is shown at the right. B, SHSY-5Y cells were infected with adenovirus coding for GSK-3α or GSK-3β and were treated with rapamycin (Rap) (50 nm, 2 h). Phosphorylation levels of S6 were determined by immunoblot analysis. Control cells (Ctrl) were infected with a β-gal-coding adenovirus. C, SHSY-5Y cells were treated with GSK-3 inhibitors SB-216763 (10 μm), CT-99012 (20 μm), 6-Bio (5 μm), and L803-mts (40 μm) for 5 h. The phosphorylation levels of S6 were determined by immunoblot analysis. NT, nontreated. D, SHSY-5Y cells infected with adenovirus coding for GSK-3α or GSK-3β and were treated with chloroquine (CQ) (30 μm, 2 h). Phosphorylation levels of S6 was determined by immunoblot analysis. E, phosphorylation levels of S6K1 were determined in CHO-APP751 and control CHO cells by immunoblot analysis. Equal protein loads were verified by β-actin blots.
FIGURE 7.
FIGURE 7.
L803-mts restores lysosomal acidification in PS1/2-deficient cells. A, levels of glycosylated (120 kDa) and nonglycosylated (100 kDa) v-ATPase V0a1, CatD (48–50 kDa), and mCatD (32 kDa) were determined in MEF and MEF-PS1/2−/− cells by immunoblot analysis. B, MEF and MEF-PS1/2−/− cells were stained with LysoTracker Red and imaged by confocal microscopy (top panels). MEF-PS1/2−/− cells were treated with L803-mts (40 μm), SB-216763 (5 μm), and LiCl (20 mm) for 4 h. The cells were stained with LysoTracker Red and imaged by confocal microscopy (bottom panels). The scale bars represent 10 μm. C, MEF-PS1/2−/− cells were treated with L803-mts (40 μm), SB-216763 (5 μm), and LiCl (20 mm). The lysosomes were partially purified as described under “Experimental Procedures.” Lysosome precipitates were immunoblotted for Lamp1, v-ATPase V0a1, CatD, and mCatD. The faint band corresponding to the 14-kDa mCatD is shown.
FIGURE 8.
FIGURE 8.
Molecular mechanisms controlling GSK-3, lysosomes, mTOR, and Aβ burdens in the 5XFAD brain. In brains of untreated mice, GSK-3 is activated by Aβ peptides. Hyperactive GSK-3 and mutant PS1 impair lysosomal acidification. This, in turn, accelerates accumulation of Aβ burdens. GSK-3 activates mTOR, but mTOR is also inhibited by the disruption in lysosome activity and by accumulated APP/Aβ burdens. The “net” effect on mTOR activity is inhibition. In L803-mts-treated mice, inhibition of GSK-3 restores lysosomal acidification and in addition prevents the deleterious effect of mutant PS1 on lysosomal acidification (by yet unknown mechanism). The normalization in lysosomal activity results in reduced Aβ burdens. Lowering of Aβ burdens and restoring lysosomal activity enable reactivation of mTOR, which inhibits autophagy. Minus signs mark inhibition, plus signs mark activation, and dashed arrows indicate processes reported in the literature.

References

    1. Selkoe D. J. (2001) Alzheimer's disease. Genes, proteins, and therapy. Physiol. Rev. 81, 741–766 - PubMed
    1. De Strooper B. (2010) Proteases and proteolysis in Alzheimer disease. A multifactorial view on the disease process. Physiol. Rev. 90, 465–494 - PubMed
    1. Hardy J. (2009) The amyloid hypothesis for Alzheimer's disease. A critical reappraisal. J. Neurochem. 110, 1129–1134 - PubMed
    1. Näslund J., Haroutunian V., Mohs R., Davis K. L., Davies P., Greengard P., Buxbaum J. D. (2000) Correlation between elevated levels of amyloid β-peptide in the brain and cognitive decline. JAMA 283, 1571–1577 - PubMed
    1. Karran E., Mercken M., De Strooper B. (2011) The amyloid cascade hypothesis for Alzheimer's disease. An appraisal for the development of therapeutics. Nat. Rev. Drug Discov. 10, 698–712 - PubMed

Publication types