. 2012;7(11):e49232.
doi: 10.1371/journal.pone.0049232. Epub 2012 Nov 14.

Quiescent fibroblasts are more active in mounting robust inflammatory responses than proliferative fibroblasts

Affiliations

Quiescent fibroblasts are more active in mounting robust inflammatory responses than proliferative fibroblasts

Bo-Rui Chen et al. PLoS One. 2012.

Abstract

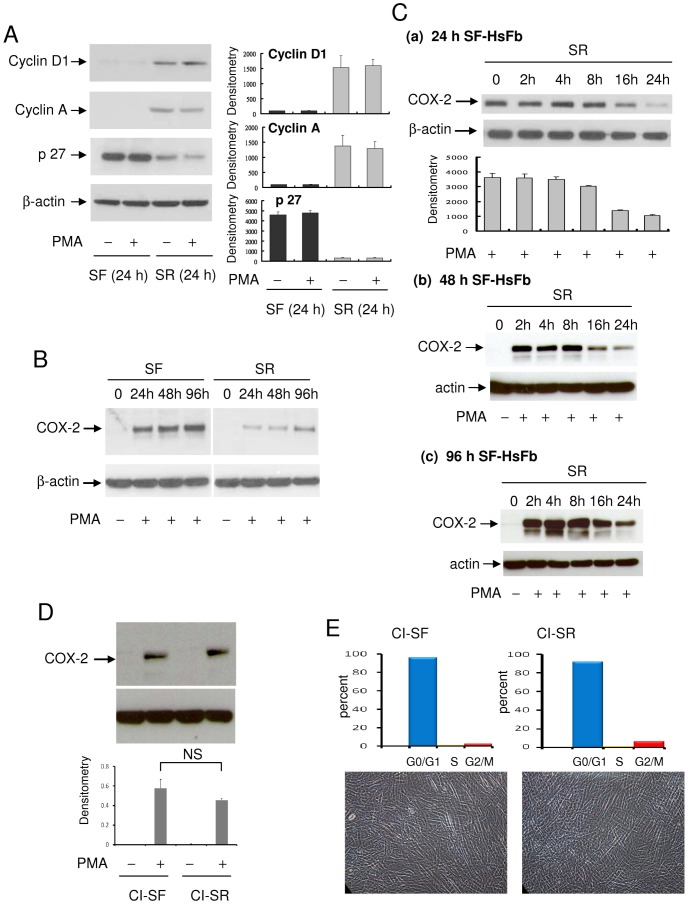
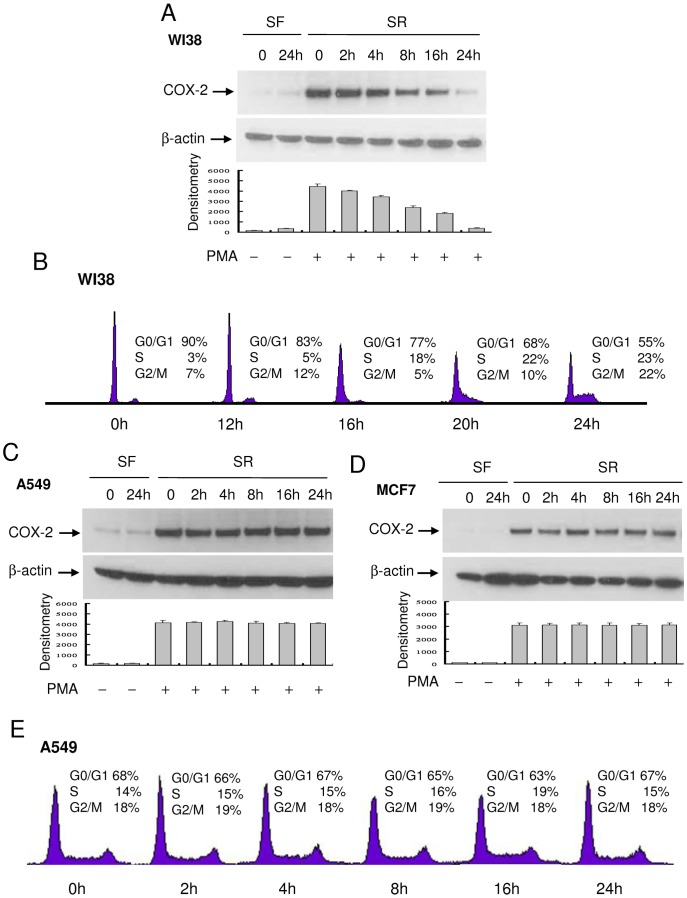
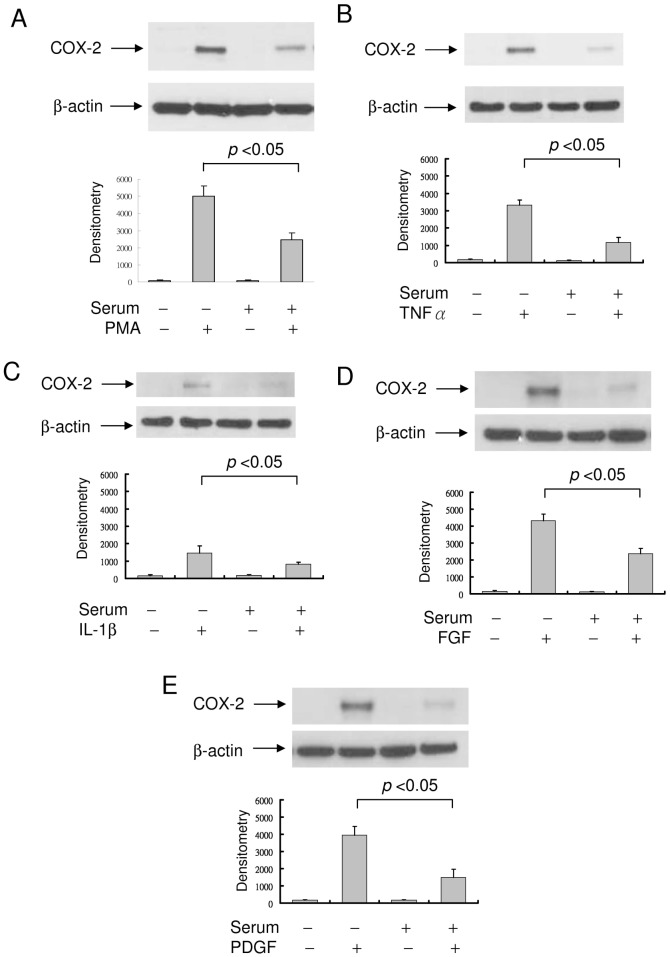
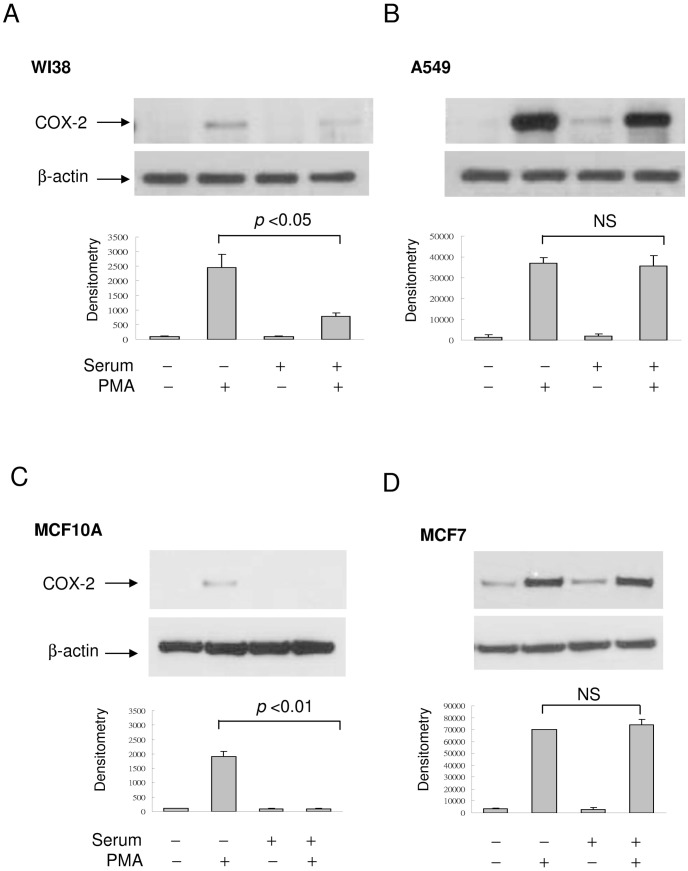
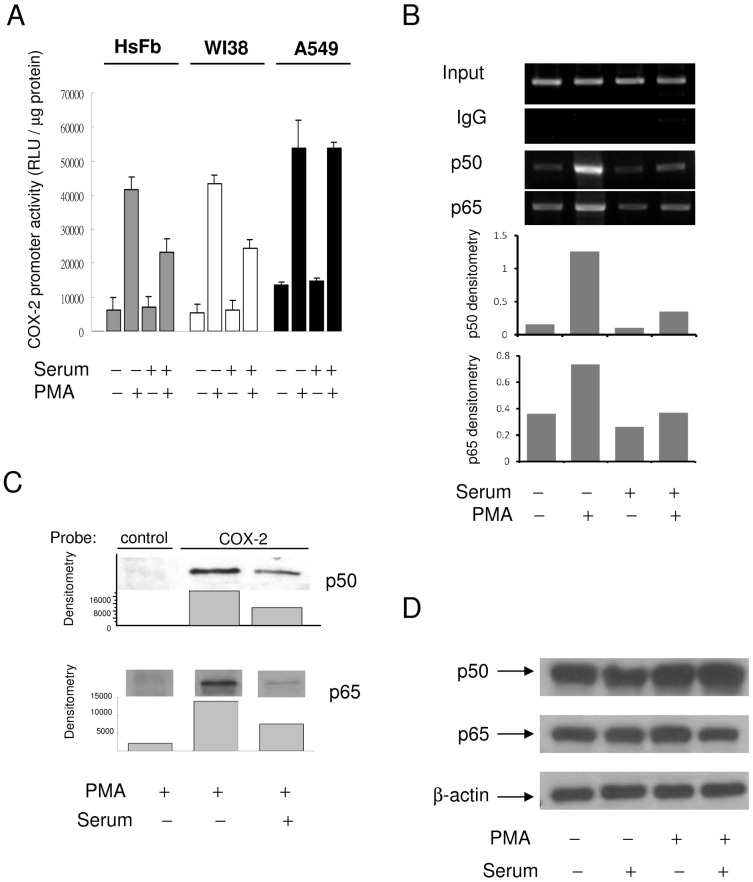
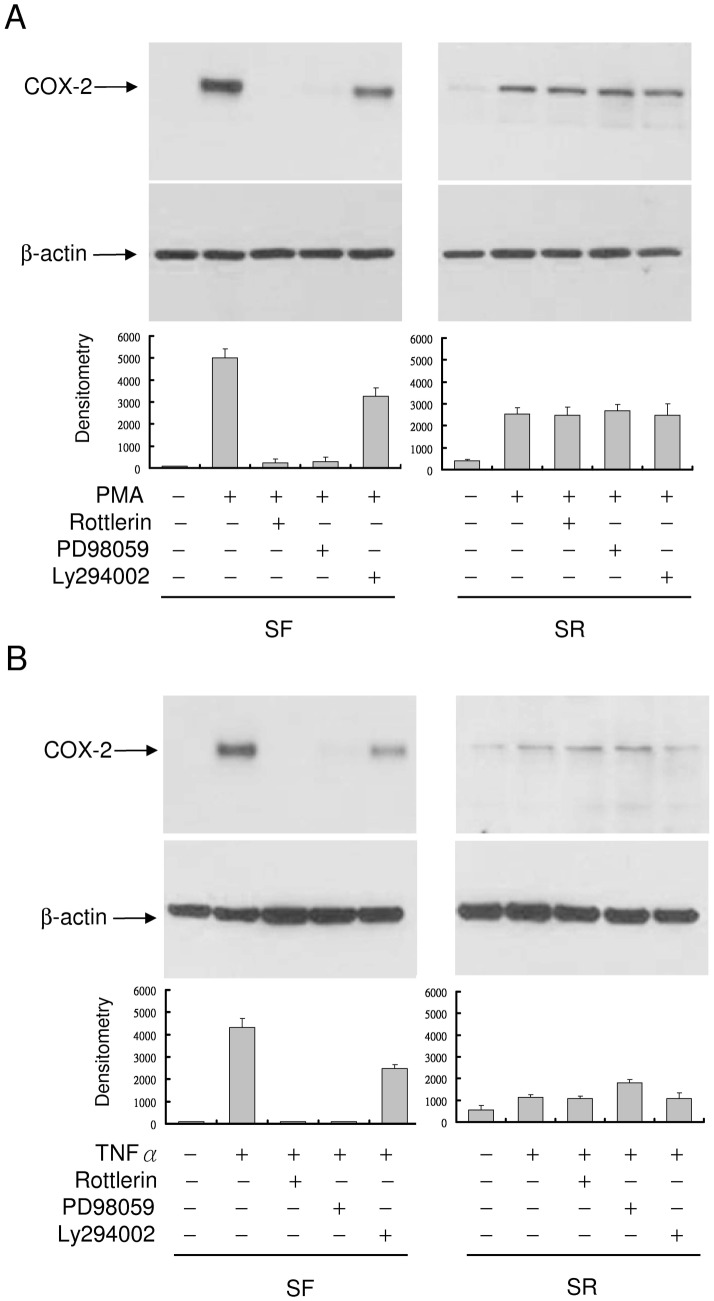
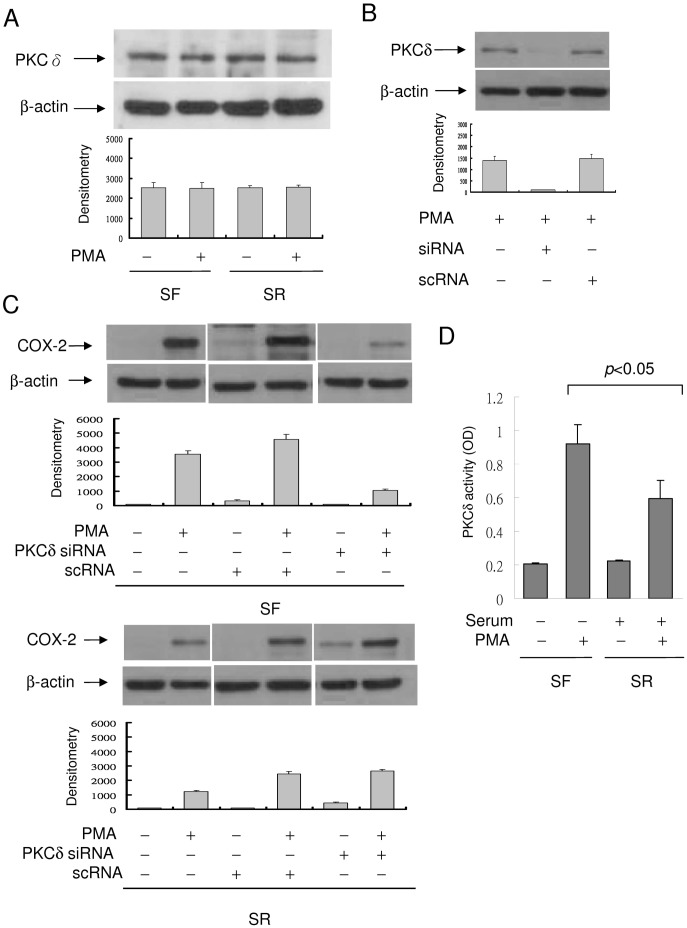
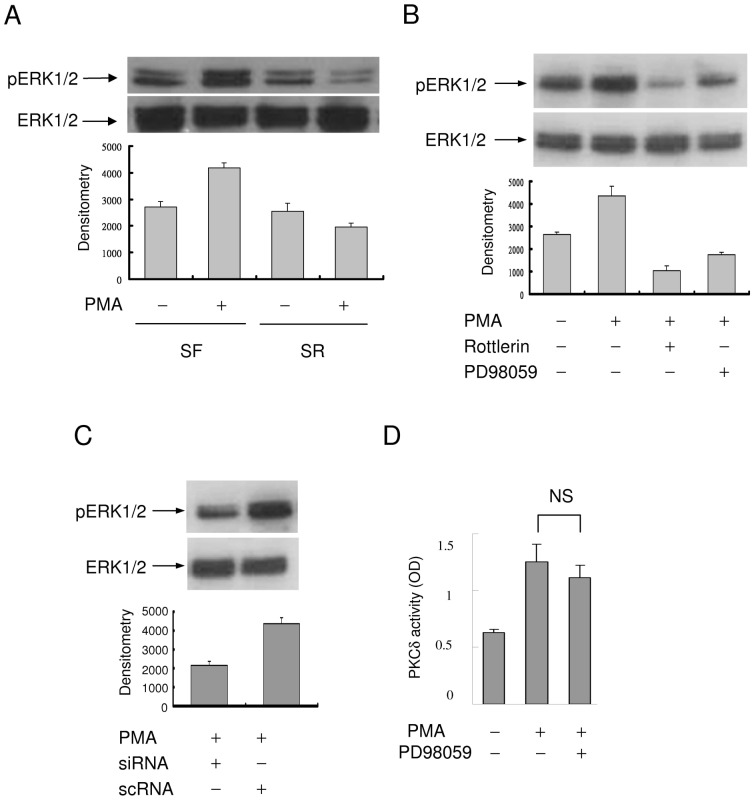
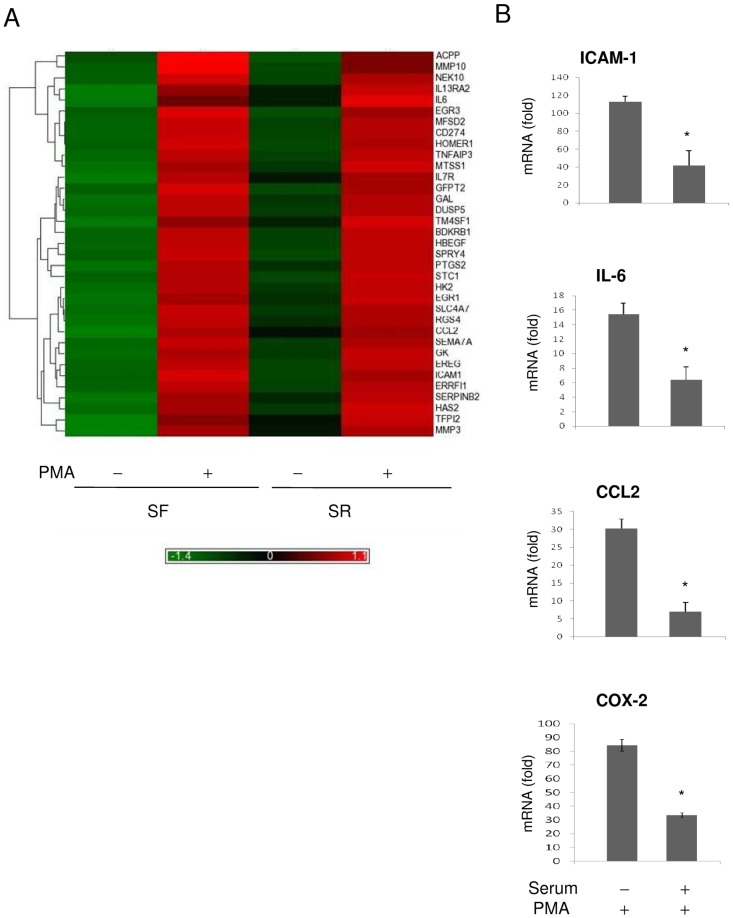
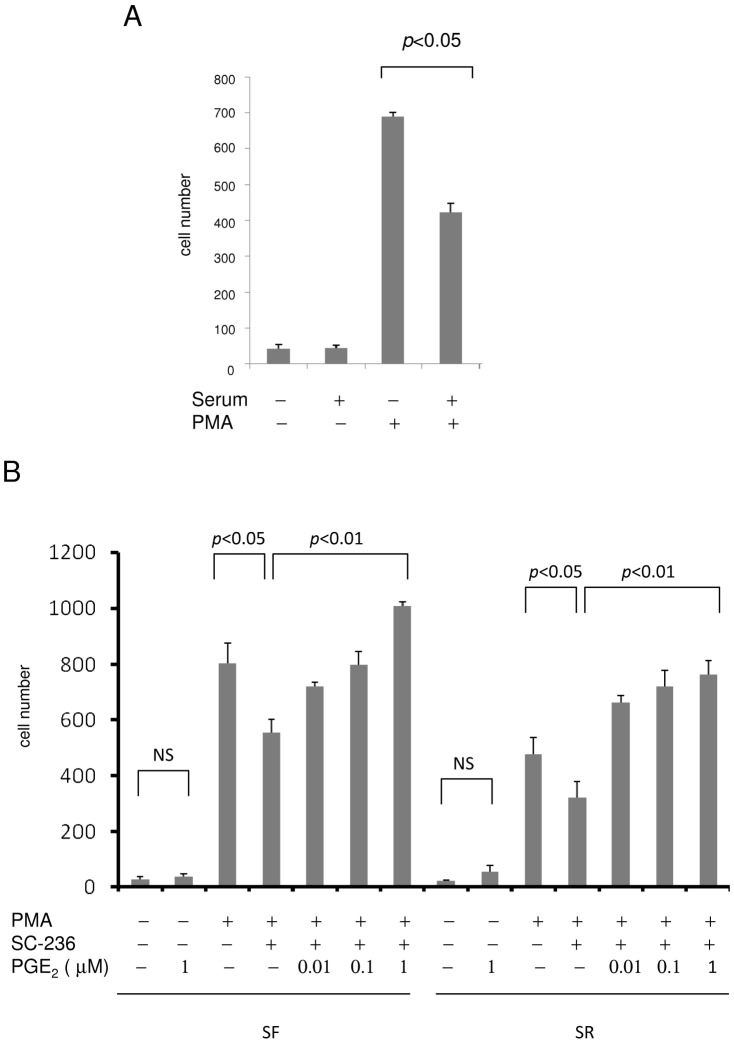
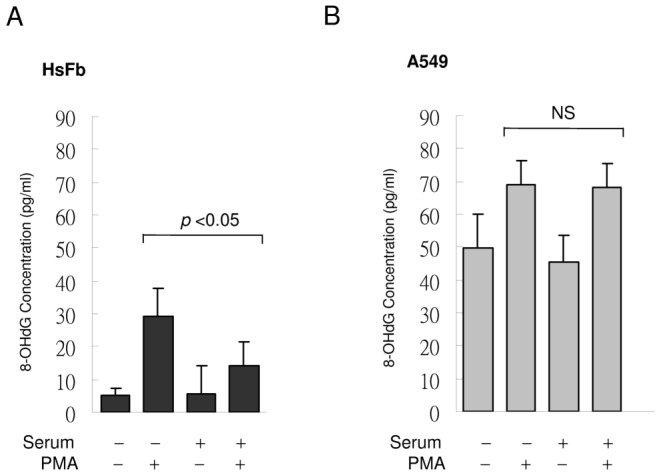
Quiescent cells are considered to be dormant. However, recent studies suggest that quiescent fibroblasts possess active metabolic profile and certain functional characteristics. We previously observed that serum-starved quiescent fibroblasts respond to proinflammatory stimuli by robust expression of cyclooxygenase-2 (COX-2), which declines after the quiescent fibroblasts are driven to proliferation. In this study, we elucidated the underlying signaling and transcriptional mechanism and identified by microarray genes with similar differential expression. By using pharmacological inhibitors coupled with gene silencing, we uncovered the key role of protein kinase C δ (PKCδ) and extracellular signal regulated protein kinase 1/2 (ERK1/2) signaling in mediating COX-2 expression in quiescent cells. Surprisingly, COX-2 expression in proliferative cells was not blocked by PKCδ or ERK1/2 inhibitors due to intrinsic inhibition of PKCδ and ERK1/2 in proliferative cells. Restrained COX-2 transcription in proliferative cells was attributable to reduced NF-κB binding. Microarray analysis identified 35 genes whose expressions were more robust in quiescent than in proliferative cells. A majority of those genes belong to proinflammatory cytokines, chemokines, adhesive molecules and metalloproteinases, which require NF-κB for transcription. Quiescent fibroblasts had a higher migratory activity than proliferative fibroblasts as determined by the transwell assay. Selective COX-2 inhibition reduced migration which was restored by prostaglandin E(2). As COX-2 and inflammatory mediators induce DNA oxidation, we measured 8-hydroxydeoxyguanosine (8-OHdG) in quiescent vs. proliferative fibroblasts. PMA-induced 8-OHdG accumulation was significantly higher in quiescent than in proliferative fibroblasts. These findings indicate that quiescent fibroblasts (and probably other quiescent cells) are at the forefront in mounting inflammatory responses through expression of an array of proinflammatory genes via the PKCδ/ERK1/2 signaling pathway.


Conflict of interest statement

Competing Interests: The authors have declared that no competing interests exist.

Figures

Figure 1
Figure 1. Cell cycle-dependent control of COX-2 expression.
(A) Cyclin D1, cyclin A and p27 in HsFb cultured in serum-free (SF) medium for 24 h vs. 24 h SR-HsFb were analyzed by Western blotting. SR denotes culture of washed SF-HsFb in medium containing 2.5% fetal bovine serum (FBS). The left panel shows representative blots and the right shows densitometry analysis. The error bars denote mean ± SD (n = 3). (B) PMA-induced COX-2 proteins in HsFb cultured in SF medium for 24, 48 or 96 h. The 24 h, 48 h, or 96 h SF-HsFb were washed and incubated in medium containing 2.5% FBS for 24 h. At the indicated time points, PMA (100 nM) was added for 4 h and COX-2 proteins were analyzed by Western blotting. (C) Time course of PMA-induced COX-2 expression in (a) 24 h, (b) 48 h and (c) 96 h SF-HsFb replenished with 2.5% FBS for various time periods. At the indicated time point, cells were treated with PMA for 4 h and COX-2 proteins were analyzed by Western blotting. Error bars denote mean ± SEM (n = 3). (D) Confluent HsFb cultured in 0.1% FBS for 72 h followed by SF-medium for 24 h (designated contact inhibited SF-HsFb, CI-SF) were washed and replenished with 2.5% FBS for 24 h (designated CI-SR HsFb). CI-SF and CI-SR HsFbs were treated with PMA for 4 h and COX-2 proteins were analyzed. Upper panel shows a representative Western blot and the lower panel mean ± SEM of densitometry of Western blots (n = 3). (E) Cell cycle analysis by flow cytometry. Upper panel, distribution of G0/G, S and Gs/M cells and lower panel, photograph of CI-SF vs. CI-SR HsFb. Nagnification: ×200.
Figure 2
Figure 2. Kinetics of PMA-induced COX-2 expression and cell cycle progression.
(A) WI38, (C) A549 and (D) MF7 cells cultured in SF-medium for 24 h were washed and incubated in medium containing 2.5% FBS. At the indicated time point, cells were treated with PMA for 4 h and COX-2 proteins in the cell lysate were analyzed by Western blotting. Upper panels show representative blots and lower panels, densitometry analysis. Error bars indicate mean ± SEM (n = 3). (B) and (E) WI38 or A549 cells were treated identically as above. At the indicated time points, cells at different phases of cell cycle were analyzed by flow cytometry as previously described .
Figure 3
Figure 3. COX-2 expression in SF- vs. SR-HsFb.
(A) PMA-induced COX-2 proteins in SF- vs. SR-HsFb. Upper panel, representative blot and lower panel, densitometry analysis. Error bars denote mean ± SEM (n = 3). (B)(E) COX-2 proteins in SF- vs. SR-HsFb treated with TNFα, IL-1β (10 ng/ml), fibroblast growth factor-2 (FGF, 10 ng/ml) or platelet-derived growth factor BB (PDGF, 10 ng/ml) for 4 h. Upper panels show representative Western blots and lower panels, densitometry analysis. Error bars indicate mean ± SEM (n = 3).
Figure 4
Figure 4. COX-2 expression in cancer vs. normal cells.
(A)&(B) PMA-induced COX-2 proteins in SF- & SR-WI38 lung fibroblasts vs. A549 lung cancer cells. (C)&(D) PMA-induced COX-2 expression in SF- & SR-MCF10A breast epithelial cells vs. MCF7 breast cancer cells. The error bars denote mean ± SEM (n = 3).
Figure 5
Figure 5. Differential COX-2 transcriptional activation in SF- vs. SR-cells.
(A) COX-2 promoter activity in SF vs. SR HsFb, WI38 and A549 cells. Each bar denotes mean ± SEM (n = 3). (B) and (C) NF-κB (p50/p65) binding to COX-2 promoter region analyzed by (B) ChIP and (C) streptavidin pulldown assay. (D) p50 and p65 NF-κB protein levels in SF- vs. SR-HsFb treated with and without PMA.
Figure 6
Figure 6. Inhibition of COX-2 expression by rottlerin in SF- but not SR-HsFb.
(A) SF- or SR-HsFb were pretreated with rottlerin, PD98059 or Ly294002 followed by treatment with PMA for 4 h. COX-2 proteins were analyzed by Western blotting. (B) SF- and SR-HsFb were treated with the pharmacological inhibitors followed by TNFα. Upper panels show representative Western blots and the lower panel, densitometry analysis (mean ± SEM, n = 3).
Figure 7
Figure 7. Suppression of PMA-induced COX-2 expression by PKCδ siRNA.
(A) Analysis of PKCδ protein levels in SF- and SR-HsFb with or without PMA treatment. PKCδ protein level was not different between SF- and SR-cells. (B) SF-HsFb were transfected with PKCδ siRNA or a control scRNA. PKCδ expression in the transfected cells was analyzed by Western blotting. (C) SF-HsFb (upper panel) and SR-HsFb (lower panel) were transfected with PKCδ siRNA or scRNA. PMA-induced COX-2 expression was analyzed by Western blotting. The blots were quantified by densitometry (mean ± SEM, n = 3). (D) PKCδ activity in SF- vs. SR-HsFb treated with PMA was determined by immunoprecipitation (IP) to isolate PKCδ proteins and analyzed the PKC catalytic activity of the IP-isolated PKCδ.
Figure 8
Figure 8. ERK1/2 activation in SF- vs. SR-HsFb.
(A) Phosphorylated ERK1/2 (pERK1/2) and total ERK1/2 were analyzed by Western blotting. (B) SF-HsFb were treated with rottlerin or PD98059 followed by PMA. pERK1/2 and ERK1/2 were analyzed by Western blotting. (C) Analysis of pERK1/2 and ERK1/2 in SF-HsFb transfected with PKCδ siRNA or control scRNA. (D) SF-HsFb were treated with PD98059 followed by PMA. PKCδ activity was analyzed. Error bars denote mean ± SEM (n = 3). NS denotes statistically insignificant.
Figure 9
Figure 9. Gene expression profiling in SF- vs. SR-HsFb.
(A) Heat map shows the genes with differential expression between SF- and SR-HsFb treated with PMA. Gene names are listed at the right margin of the map. (B) Validation by quantitative PCR. mRNA levels of several proinflammatory genes in SF- vs. SR-HsFb were measured by qPCR. Error bars are mean ± SEM (n = 3). * p<0.05 compared to SF-cells.
Figure 10
Figure 10. Migration of SF- vs. SR-HsFb.
(A) SF- or SR-HsFb were treated with PMA for 6 h and cells migrated to the under surface were counted. (B) SF-HsFb or SR-HsFb were treated with SC236 (1 uM) for 30 min followed by PMA for 4 h. Cells were applied to the transwell migration assay. For the PGE2 rescue experiments, PGE2 was added together with SC236 before stimulation with PMA. Error bars refer to mean ± SEM (n = 3).
Figure 11
Figure 11. 8-OHdG levels in SF- vs. SR-HsFb and A549 cells.
(A) SF- or SR-HsFb were treated with PMA for 4 h and 8-OHdG was measured. (B) SF- and SR-A549 cells were treated similarly to (A). Each bar denotes mean ± SEM (n = 3). NS denote statistically non-significant.

References

    1. Fuge EK, Braun EL, Werner-Washburne M (1994) Protein synthesis in long-term stationary-phase cultures of Saccharomyces cerevisiae. J Bacteriol 176: 5802–5813. - PMC - PubMed
    1. Werner-Washburne M, Braun E, Johnston GC, Singer RA (1993) Stationary phase in the yeast Saccharomyces cerevisiae. Microbiol Rev 57: 383–401. - PMC - PubMed
    1. Coller HA, Sang L, Roberts JM (2006) A new description of cellular quiescence. PLoS Biol 4: e83. - PMC - PubMed
    1. Lemons JM, Feng XJ, Bennett BD, Legesse-Miller A, Johnson EL, et al. (2010) Quiescent fibroblasts exhibit high metabolic activity. PLoS Biol 8: e1000514. - PMC - PubMed
    1. Smith WL, DeWitt DL, Garavito RM (2000) Cyclooxygenases: structural, cellular, and molecular biology. Annu Rev Biochem 69: 145–182. - PubMed

Publication types

MeSH terms