. 2012 Nov 17:13:635.
doi: 10.1186/1471-2164-13-635.

Novel β-catenin target genes identified in thalamic neurons encode modulators of neuronal excitability

Affiliations

Novel β-catenin target genes identified in thalamic neurons encode modulators of neuronal excitability

Marta B Wisniewska et al. BMC Genomics. .

Abstract

Background: LEF1/TCF transcription factors and their activator β-catenin are effectors of the canonical Wnt pathway. Although Wnt/β-catenin signaling has been implicated in neurodegenerative and psychiatric disorders, its possible role in the adult brain remains enigmatic. To address this issue, we sought to identify the genetic program activated by β-catenin in neurons. We recently showed that β-catenin accumulates specifically in thalamic neurons where it activates Cacna1g gene expression. In the present study, we combined bioinformatics and experimental approaches to find new β-catenin targets in the adult thalamus.

Results: We first selected the genes with at least two conserved LEF/TCF motifs within the regulatory elements. The resulting list of 428 putative LEF1/TCF targets was significantly enriched in known Wnt targets, validating our approach. Functional annotation of the presumed targets also revealed a group of 41 genes, heretofore not associated with Wnt pathway activity, that encode proteins involved in neuronal signal transmission. Using custom polymerase chain reaction arrays, we profiled the expression of these genes in the rat forebrain. We found that nine of the analyzed genes were highly expressed in the thalamus compared with the cortex and hippocampus. Removal of nuclear β-catenin from thalamic neurons in vitro by introducing its negative regulator Axin2 reduced the expression of six of the nine genes. Immunoprecipitation of chromatin from the brain tissues confirmed the interaction between β-catenin and some of the predicted LEF1/TCF motifs. The results of these experiments validated four genes as authentic and direct targets of β-catenin: Gabra3 for the receptor of GABA neurotransmitter, Calb2 for the Ca(2+)-binding protein calretinin, and the Cacna1g and Kcna6 genes for voltage-gated ion channels. Two other genes from the latter cluster, Cacna2d2 and Kcnh8, appeared to be regulated by β-catenin, although the binding of β-catenin to the regulatory sequences of these genes could not be confirmed.

Conclusions: In the thalamus, β-catenin regulates the expression of a novel group of genes that encode proteins involved in neuronal excitation. This implies that the transcriptional activity of β-catenin is necessary for the proper excitability of thalamic neurons, may influence activity in the thalamocortical circuit, and may contribute to thalamic pathologies.


Figures
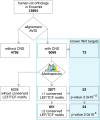
Figure 1
Figure 1
Bioinformatics identification of putative LEF1/TCF target genes. The diagram presents the successive steps to select putative LEF1/TCF targets, beginning from the group of human-rat orthologs in the Ensembl database. Groups of genes are in rectangles, and computational procedures are in diamonds. In the blue frame, the crossing of our in silico-selected genes with known Wnt/β-catenin targets is shown. The p values (Fisher’s Exact test) confirmed the enrichment of genes with at least one and at least two LEF1/TCF binding sites (predicted with Matinspector using Genomatix family V$LEFF) with the known targets.
Figure 2
Figure 2
Gene profiling in the forebrain. Scatterplots show mean gene expression fold changes between the thalamus, hippocampus, and cortex by RT-qPCR. p values (Student’s t-test) revealed statistical significance for all fold changes > 2 and < 0.5. A logarithmic scale is used. Red frames surround the plot areas of at least two-fold higher expression in a given brain region compared with the other two regions, gray frames - of at least two-fold lower. (A) Expression of VGCC genes in the thalamus vs. cortex (x-axis) and hippocampus (y-axis). (Left plot) VGCC genes defined as putative LEF1/TCF targets. (Right plot) Remainder of the VGCC genes. The proportions of highly expressed genes in the group of putative LEF1/TCF targets (left plot) and in the non-target group (right plot) were compared using Fisher’s Exact test, indicating a nonrandom association (p = 0.021). (B) Expression of all putative neuronal LEF1/TCF targets in the thalamus vs. cortex (x-axis) and hippocampus (y-axis). Notice that many genes are highly expressed in the thalamus. (C) Expression of all putative neuronal LEF1/TCF targets. (Left plot) Cortex vs. thalamus (x-axis) and hippocampus (y-axis). (Right plot) Hippocampus vs. thalamus (x-axis) and cortex (y-axis). Notice that this group of genes is not preferentially expressed in the cortex or hippocampus. n = 6 independent biological samples.
Figure 3
Figure 3
Expression analysis of putative LEF1/TCF targets in the forebrain. Volcano plots arrange genes along the dimensions of (x) mean expression fold difference between two brain structures and (y) p value (Student’s t-test). A logarithmic scale is used. Red frames surround the plot area, in which the expression in the thalamus is at least two-fold higher than in the other structures, and the difference is statistically significant (p < 0.05). The genes inside the frames are considered likely LEF1/TCF targets in the thalamus. On every plot, the genes that met the criterion of a statistically significant two-fold expression difference between the two structures are labeled. Those that are higher in the thalamus vs. cortex and hippocampus are in green. n = 6 independent biological samples.
Figure 4
Figure 4
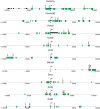
Positions of LEF1/TCF motifs in the conserved noncoding sequences in the genomic flanks of the transcription start sites of genes selected for experimental validation. The schemes represent Drd3, Gabra3, Glra1, Grid2, Cacna1g, Cacna2d2, Kcna6, Kcnh8, and Calb2 genes. The plots are on the gene strand, nucleotide positions are given relative to the transcription start site (TSS) of each gene, as defined in the Ensemble version used. For Gabra3, an alternative TSS prediction, marked with the asterix, based on the NCBI Reference Sequence NM_017069.3, is also shown. CNSs are represented as green rectangles. Positions of LEF1/TCF motifs (analyzed only in the CNSs) are marked as red bars, above or below the axis depending on the strand. Exons within the analyzed flanks (for majority of the genes – only the first exons) are shown as black rectangles on the axis. Amplicons used in the ChiP assay are shown as numbered thick black lines.
Figure 5
Figure 5
ChIP analysis of histone acetylation and β-catenin binding to LEF1/TCF motifs of the candidate target genes. (A) The graph shows the mean percentage of input chromatin precipitated with an anti-H3Ac antibody. Fragments of the Gapdh promoter (Gapdh-P) and exon (Gapdh-E) were used to determine the signal levels in the case of open and closed chromatin, respectively. The blue area indicates the level of signal for closed chromatin, assessed based on the precipitation of the exonic fragment of Gapdh. (B) Mean percentage of input chromatin precipitated with an anti-β-catenin antibody. The blue area indicates the level of background, determined with normal IgG. In some cases β-catenin binding to chromatin was not detected (ND). n = 4 independent biological samples. Error bars indicate SD. ***p < 0.001, **p < 0.01, *p < 0.05 (ANOVA).
Figure 6
Figure 6
Expression analysis of the candidate target genes in thalamic neurons (loss-of-function experiment). (A) Subcellular localization of β-catenin in thalamic neurons in vitro in control (Gfp-expressing; upper panel) and Axin2-expressing (lower panel) cultures. Neuronal marker NeuN is stained red. β-catenin is green, and nuclei are blue. The arrows point to nuclear β-catenin-positive neurons. Scale bar = 20 μm. The percentage of β-catenin-positive neurons in every culture is indicated, with p values of the differences (Fisher’s Exact test). (B) Expression of the candidate LEF1/TCF1 targets Cacna1g, Cacna2d2, Kcna6, Kcnh8, Drd3, Gabra3, Glra1, Grid2, and Calb2, neuronal marker Map2, negative control Cacna1h, and positive control Lef1 in thalamic cultures transduced with Axin2-expressing adenoviral vector compared with control (Gfp-expressing cultures). The expression levels are relative to the level of Gapdh. The graph shows the means of all of the results relative to the control, set at 1. Drd3 mRNA was not detected (ND). n = 9 independent biological samples. Error bars indicate SD. ***p < 0.001, **p < 0.01, *p < 0.05 (Student’s t-test).

Similar articles

Cited by

References

    1. Brembeck FH, Rosario M, Birchmeier W. Balancing cell adhesion and Wnt signaling, the key role of beta-catenin. Curr Opin Genet Dev. 2006;16(1):51–59. - PubMed
    1. Valenta T, Hausmann G, Basler K. The many faces and functions of beta-catenin. EMBO J. 2012;31(12):2714–2736. - PMC - PubMed
    1. Huang H, He X. Wnt/beta-catenin signaling: new (and old) players and new insights. Curr Opin Cell Biol. 2008;20(2):119–125. - PMC - PubMed
    1. Clevers H, Nusse R. Wnt/beta-catenin signaling and disease. Cell. 2012;149(6):1192–1205. - PubMed
    1. Clevers H. Wnt/beta-catenin signaling in development and disease. Cell. 2006;127(3):469–480. - PubMed

Publication types

MeSH terms

LinkOut - more resources