. 2012 Nov 16;14(6):R148.
doi: 10.1186/bcr3358.

ERbeta1 represses basal breast cancer epithelial to mesenchymal transition by destabilizing EGFR

ERbeta1 represses basal breast cancer epithelial to mesenchymal transition by destabilizing EGFR

Christoforos Thomas et al. Breast Cancer Res. .

Abstract

Introduction: Epithelial to mesenchymal transition (EMT) is associated with the basal-like breast cancer phenotypes. 60% of basal-like cancers have been shown to express wild-type estrogen receptor beta (ERbeta1). However, it is still unclear whether the ERbeta expression is related to EMT, invasion and metastasis in breast cancer. In the present study, we examined whether ERbeta1 through regulating EMT can influence invasion and metastasis in basal-like cancers.

Methods: Basal-like breast cancer cells (MDA-MB-231 and Hs578T) in which ERbeta1 was either overexpressed or downregulated were analyzed for their ability to migrate and invade (wound-healing assay, matrigel-coated Transwell assay) as well as for the expression of EMT markers and components of the EGFR pathway (immunoblotting, RT-PCR). Coimmunoprecipitation and ubiquitylation assays were employed to examine whether ERbeta1 alters EGFR protein degradation and the interaction between EGFR and the ubiquitin ligase c-Cbl. The metastatic potential of the ERbeta1-expressing MDA-MB-231 cells was evaluated in vivo in a zebrafish xenotransplantation model and the correlation between ERbeta1 and E-cadherin expression was examined in 208 clinical breast cancer specimens by immunohistochemistry.

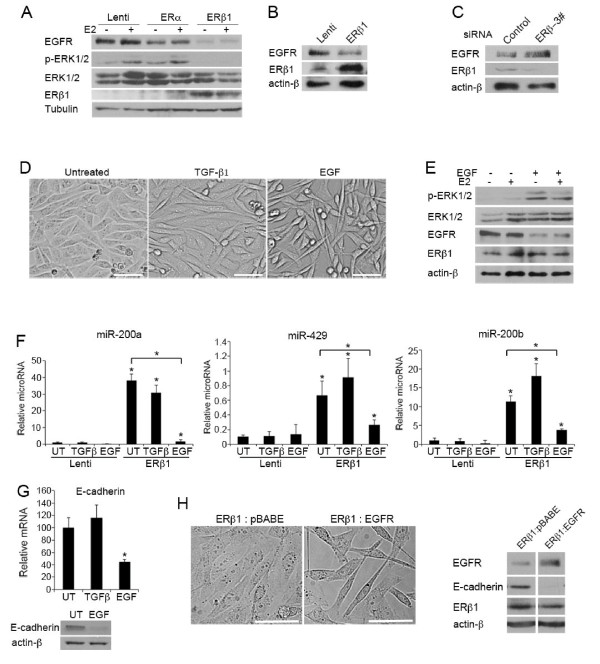
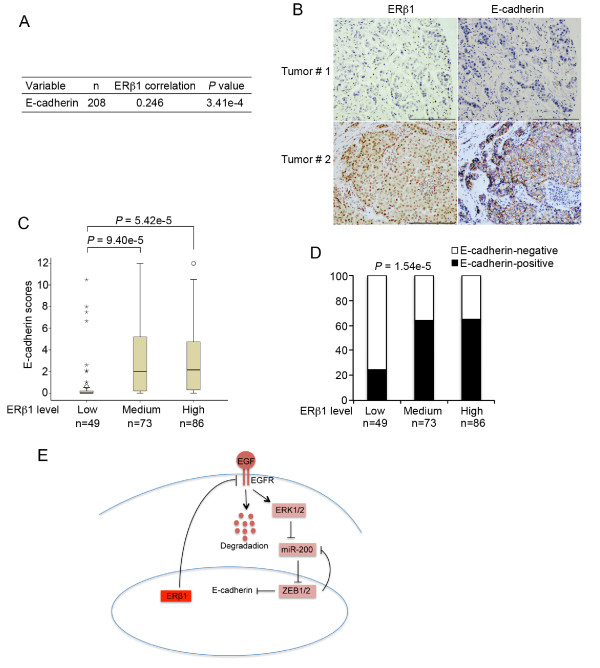
Results: Here we show that ERbeta1 inhibits EMT and invasion in basal-like breast cancer cells when they grow either in vitro or in vivo in zebrafish. The inhibition of EMT correlates with an ERbeta1-mediated upregulation of miR-200a/b/429 and the subsequent repression of ZEB1 and SIP1, which results in increased expression of E-cadherin. The positive correlation of ERbeta1 and E-cadherin expression was additionally observed in breast tumor samples. Downregulation of the basal marker EGFR through stabilization of the ubiquitin ligase c-Cbl complexes and subsequent ubiquitylation and degradation of the activated receptor is involved in the ERbeta1-mediated repression of EMT and induction of EGFR signaling abolished the ability of ERbeta1 to sustain the epithelial phenotype.

Conclusions: Taken together, the results of our study strengthen the association of ERbeta1 with the regulation of EMT and propose the receptor as a potential crucial marker in predicting metastasis in breast cancer.


Figures

Figure 1
Figure 1
ERβ1 inhibits invasion and migration in breast cancer cells by regulating EMT. (A) Control (Lenti), ERα- and ERβ1-expressing MDA-MB-231 cells following incubation with EtOH or 17β-estradiol (E2) for 24 h (scale bars, 50 μm). (B) Control (Lenti) and ERβ1-expressing Hs578T cells (upper panel) and Hs578T cells that were transiently transfected with a siRNA targeting luciferase (Control) or a specific ERβ siRNA (siRNA 3#) (lower panel) were photographed (scale bars, 100 μM). (C) Control (Lenti), ERα- and ERβ1-expressing MDA-MB-231 cells were incubated with EtOH or E2 and assessed for invasion by using matrigel-coated Transwell chambers. The cells that were translocated to the lower surface of the filter were shown (left panel) (scale bars, 500 μm). The graph shows the mean (cell number per field) of three separate experiments with the standard error of the mean (SEM) and P-value (*) ≤0.05% indicated. (D) Control (Lenti) and ERβ1-expressing MDA-MB-231 cells were incubated with E2 for 24 h and assessed for migration using wound-healing assay. The bar graph shows the mean (cells migrated into the wound) of three separate experiments with SEM and P-value (*) ≤0.05% indicated. (E) E-cadherin protein levels in control (Lenti), ERα- or ERβ1-expressing MDA-MB-231 cells. (F) E-cadherin expression was analyzed by immunoblotting in MDA-MB-231 cells transfected with control or ERβ siRNA (3#) (upper panel) and qPCR in MDA-MB-231 cells transfected with control or three specific ERβ siRNAs (lower panel). The graph indicates the mean of three separate experiments with SEM and P-value (*) ≤0.05%. (G) E-cadherin was visualized by immunofluorescence in control (Lenti) and ERβ1-expressing cells (scale bars, 20 μm).
Figure 2
Figure 2
ERβ1 induces the expression of E-cadherin by up-regulating members of the microRNA 200 family and repressing the expression of ZEB-1 and SIP-1. (A) E-cadherin mRNA levels in control (Lenti), ERα- and ERβ1-expressing MDA-MB-231 cells following incubation with or without E2 for 24 h. The graph shows the mean of three separate experiments with SEM and P-value (*) ≤0.05% indicated. (B) Left panel: protein levels of EMT markers in control (Lenti), ERα- and ERβ1-expressing MDA-MB-231 cells following incubation with or without E2 for 24 h. Right panel: E- and N-cadherin protein levels in control (Lenti) and ERβ1-expressing Hs578T cells. (C) ZEB-1 and SIP-1 protein levels in control (Lenti), ERα- and ERβ1-expressing MDA-MB-231 cells (upper panel) and in control and ERβ1-expressing Hs578T cells (lower panel). (D) Control, ERα- and ERβ1-expressing MDA-MB-231 cells were analyzed for miR-200a, miR-200b and miR-429 expression by qPCR. The graphs show data as fold change compared with the untreated Lenti cells (mean of three separate experiments with SEM and P-value (*) ≤0.05% indicated). (E) MDA-MB-231 cells were transiently transfected with control or ERβ siRNA (3#) and analyzed for miR-200a, miR-200b and miR-429 expression by qPCR. The graphs show the mean of three separate experiments with SEM and P-value (*) ≤0.05% indicated. (F) ERβ1-expressing MDA-MB-231 cells were transfected with inhibitors of miR-200a, miR-200b and miR-429 or a negative control inhibitor. Cells were photographed and analyzed for E-cadherin expression by qPCR (scale bars, 50 μm). The level of functional knockdown of miR-200a-b-429 was examined by a miR-200a-b-429-regulated reporter assay. The graphs show the mean of three separate experiments with SEM and P-value (*) ≤0.05% indicated.
Figure 3
Figure 3
EGFR promotes EMT and its down-regulation is involved in ERβ1-induced E-cadherin expression. (A) EGFR, total ERK1/2 and phospho-ERK1/2 levels in control (Lenti), ERα- and ERβ1-expressing MDA-MB-231 cells following incubation with or without E2 for 24 h. (B) EGFR protein levels in control (Lenti) and ERβ1-expressing Hs578T cells. (C) EGFR protein levels in MDA-MB-231 cells transiently transfected with control or ERβ siRNA (3#). (D) ERβ1-expressing MDA-MB-231 cells were incubated in absence or presence of 5 ng/ml TGF-β1 or 10 ng/ml EGF for 24 h and photographed (scale bars, 50 μm). (E) ERβ1-expressing MDA-MB-231 cells were incubated in absence or presence of 10 ng/ml EGF for 24 h and analyzed for the expression of EGFR, total ERK1/2 and phospho-ERK1/2 by immunoblotting. Note that the decreased EGFR levels following EGF treatment is due to increased degradation. (F) miR-200a, miR-200b and miR-429 levels in control (Lenti) and ERβ1-expressing MDA-MB-231 cells following incubation with 5 ng/ml TGF-β1 or 10 ng/ml EGF for 24 h. The graph shows the data as fold change compared with the untreated Lenti cells (mean of three separate experiments (± SEM) with P-value (*) ≤0.05%). (G) E-cadherin mRNA and protein levels in ERβ1-expressing MDA-MB-231 cells following incubation with 5 ng/ml TGF-β1 or 10 ng/ml EGF for 24 h. The graph shows the mean of three separate experiments with SEM and P-value (*) ≤0.05% indicated. (H) ERβ1-expressing MDA-MB-231 cells were stably co-transfected with an empty pBABE vector (ERβ1:pBABE cells) or the pBABE-EGFR plasmid (ERβ1:EGFR cells), photographed and analyzed for EGFR, E-cadherin and ERβ1 expression by immunoblotting (scale bars, 50 μm).
Figure 4
Figure 4
ERβ1 induces ubiquitylation and degradation of EGFR. (A) Control (Lenti) and ERβ1-expressing MDA-MB-231 cells were incubated in the presence of 100 μM cycloheximide and 10 ng/ml EGF for the indicated times and analyzed for EGFR expression by immunoblotting. Treatment with EGF induces phosphorylation of EGFR and this accounts for the retarded electrophoretic mobility of EGFR at times 0.5 to 2. Lower panel: the graph represents the quantification of EGFR protein abundance from three independent experiments with SEM and P-value (*) ≤0.05% indicated. (B) Control (Lenti) and ERβ1-expressing MDA-MB-231 cells were incubated in absence or presence of 1 μM MG-132 for 6 h and analyzed for EGFR expression by immunoblotting. Lower panel: the bar graph represents the quantification of EGFR protein levels with SEM and P-value (*) ≤0.05% indicated. (C) Control (Lenti) and ERβ1-expressing MDA-MB-231 and Hs578T cells were incubated in the presence of 10 ng/ml EGF for 20 minutes. Lysates were immunoprecipitated with anti-EGFR antibody, followed by immunoblotting with the indicated antibodies. The bottom panel is the input control of cell lysates. (D) MDA-MB-231 cells were transiently transfected with control or ERβ siRNA (3#). 72 h after the transfection, cells were incubated with 10 ng/ml EGF for 20 minutes and analyzed as described in C. (E) Control (Lenti) and ERβ1-expressing MDA-MB-231 cells were serum starved, challenged with 10 ng/ml EGF for the indicated times and lysed under nondenaturing conditions. EGFR immunoprecipitates were probed with antibodies against EGFR and c-Cbl. The bottom panel is the input control of cell lysates.
Figure 5
Figure 5
ERβ1 inhibits MDA-MB-231 tumor cell invasion, dissemination and micrometastasis in vivo. Control (Lenti) and ERβ1-expressing MDA-MB-231 cells were stably transfected with pAmCyan or pCMCV-DsRed vector. A tumor cell suspension containing equal numbers of either DsRed-Lenti:AmCyan-ERβ1 cells (A) or AmCyan-Lenti:DsRed-ERβ1 cells (B) were injected into perivitelline space of 48 hpf embryos and tumor cell invasion and dissemination were detected using fluorescent microscopy at 5 dpi. The upper panels show the zebrafish 3 hpi. Arrowheads indicate disseminated tumor cells (Scale bar, 500 μm). (C and D) High magnification micrographs of A and B, respectively (scale bar, 100 μm). (E) Table showing the number of zebrafish injected with either DsRed-Lenti:AmCyan-ERβ1 or AmCyan-Lenti:DsRed-ERβ1 MDA-MB-231 cells, the number of zebrafish with disseminated human tumor cells and the number of the zebrafish with disseminated cells in different regions of the body. (F) DsRed-Lenti, AmCyan-Lenti, DsRed-ERβ1 and AmCyan-ERβ1 MDA-MB-231 cells were analyzed for ERβ1 expression by immunoblotting. (BF, blue filter; RF, red filter; GF, green filter).
Figure 6
Figure 6
ERβ1 levels positively correlate with E-cadherin in breast cancers. (A) Pearson's correlation of ERβ1 expression with expression of E-cadherin. N equals the number of patients for whom data were available. (B) Representative images of ERβ1 and E-cadherin expression in two serial sections of the same tumor from two cases. Scale bars represent 200 μM. (C) ERβ1 and E-cadherin were box-plotted in the 208 breast cancer patients. The patients were divided into three groups based on ERβ1 expression scores in the tumors, representing low, medium and high expression of ERβ1. Any outliers were marked with a circle and extreme cases with an asterisk. Data were analyzed using one-way ANOVA test with Games-Howell's correction. (D) The percentage of E-cadherin-positive tumors was analyzed in the three groups of patients as described in C. Data were analyzed using Pearson's χ2 test. (E) Proposed mechanism for how ERβ1 regulates EMT and influences invasion in breast cancer. EGFR promotes EMT in basal cells by activating ERK1/2, which in turn, by inducing the expression of ZEB1/2, results in the down-regulation of E-cadherin. This process requires repression of the expression of members of miR-200 family. By inducing the degradation of EGFR, ERβ1 sustains ERK1/2 inactive, up-regulates miR200a-b and miR-429, down-regulates ZEB1/2 and induces the expression of E-cadherin.

Similar articles

Cited by

References

    1. Perou CM, Sorlie T, Eisen MB, van de Rijn M, Jeffrey SS, Rees CA, Pollack JR, Ross DT, Johnsen H, Akslen LA, Fluge O, Pergamenschikov A, Williams C, Zhu SX, Lonning PE, Borresen-Dale AL, Brown PO, Botstein D. Molecular portraits of human breast tumours. Nature. 2000;14:747–752. doi: 10.1038/35021093. - DOI - PubMed
    1. Prat A, Perou CM. Deconstructing the molecular portraits of breast cancer. Mol Oncol. 2011;14:5–23. doi: 10.1016/j.molonc.2010.11.003. - DOI - PMC - PubMed
    1. Curtis C, Shah SP, Chin SF, Turashvili G, Rueda OM, Dunning MJ, Speed D, Lynch AG, Samarajiwa S, Yuan Y, Graf S, Ha G, Haffari G, Bashashati A, Russell R, McKinney S, Langerod A, Green A, Provenzano E, Wishart G, Pinder S, Watson P, Markowetz F, Murphy L, Ellis I, Purushotham A, Borresen-Dale AL, Brenton JD, Tavare S, Caldas C. et al.The genomic and transcriptomic architecture of 2,000 breast tumours reveals novel subgroups. Nature. 2012;14:346–352. - PMC - PubMed
    1. Sorlie T, Tibshirani R, Parker J, Hastie T, Marron JS, Nobel A, Deng S, Johnsen H, Pesich R, Geisler S, Demeter J, Perou CM, Lonning PE, Brown PO, Borresen-Dale AL, Botstein D. Repeated observation of breast tumor subtypes in independent gene expression data sets. Proc Natl Acad Sci USA. 2003;14:8418–8423. doi: 10.1073/pnas.0932692100. - DOI - PMC - PubMed
    1. Rakha E, Ellis I, Reis-Filho J. Are triple-negative and basal-like breast cancer synonymous? Clin Cancer Res. 2008;14:618–619. author reply 618. - PubMed

Publication types

MeSH terms

Substances