

doi: 10.1186/gb-2012-13-11-r104.
InSilico DB genomic datasets hub: an efficient starting point for analyzing genome-wide studies in GenePattern, Integrative Genomics Viewer, and R/Bioconductor
- PMID: 23158523
- PMCID: PMC3580496
- DOI: 10.1186/gb-2012-13-11-r104
Item in Clipboard
InSilico DB genomic datasets hub: an efficient starting point for analyzing genome-wide studies in GenePattern, Integrative Genomics Viewer, and R/Bioconductor
Genome Biol.
.
Abstract
Genomics datasets are increasingly useful for gaining biomedical insights, with adoption in the clinic underway. However, multiple hurdles related to data management stand in the way of their efficient large-scale utilization. The solution proposed is a web-based data storage hub. Having clear focus, flexibility and adaptability, InSilico DB seamlessly connects genomics dataset repositories to state-of-the-art and free GUI and command-line data analysis tools. The InSilico DB platform is a powerful collaborative environment, with advanced capabilities for biocuration, dataset sharing, and dataset subsetting and combination. InSilico DB is available from https://insilicodb.org.
Figures

Navigation and browse interface. (a) Navigation pane, accessible at all times by clicking on the InSilico DB logo (see below). (b) The InSilico DB Browse & Export interface. The result after querying InSilico DB for the term 'Estrogen' is displayed. The main functions are indicated: 1, the InSilico DB logo is a link to access the navigation bar; 2, user information and feedback form; 3, search and find genomic datasets; 4, filter datasets, refine search results, manage and share sample collections; 5, results panel allowing the user to drill-down into information referring to desired datasets, and export it into supported analysis tools.
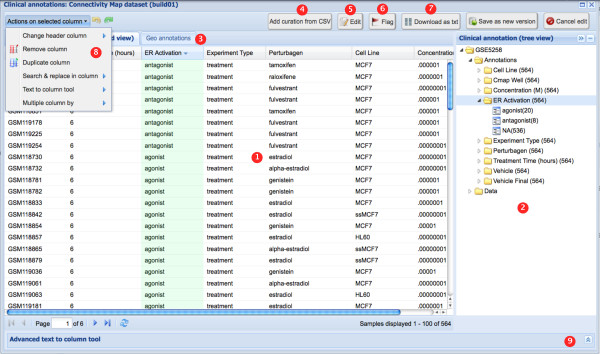
Viewing and editing clinical annotations. Clinical annotations of the C-MAP dataset. 1, spreadsheet view with headers representing clinical factors (for example, 'Perturbagen' or 'Cell Line'), and rows representing measurements and their associated values (for example, 'estradiol' or 'MCF7'). 2, Tree view condensed representation of the clinical annotations allowing fast identification of the number of samples annotated with a given clinical factor and clinical value (number in parentheses). 3, Central panel containing a second tab with additional meta-information. For GEO datasets, this second tab (named 'GEO annotations') links back to the original GEO web page dedicated to the dataset. 4, Curations upload button. 5, Edit curations. 6, Flag a curation - for example, in case of errors in the samples' annotations. 7, Download a curation. 8 and 9, After clicking on the 'Edit' button, the spreadsheet becomes fully editable and advanced tools ease the process of structuring annotations. Here, the curation of the C-MAP dataset is enriched with analysis results: the 'ER status' clinical factor is added with 'agonist' or 'antagonist' as values.
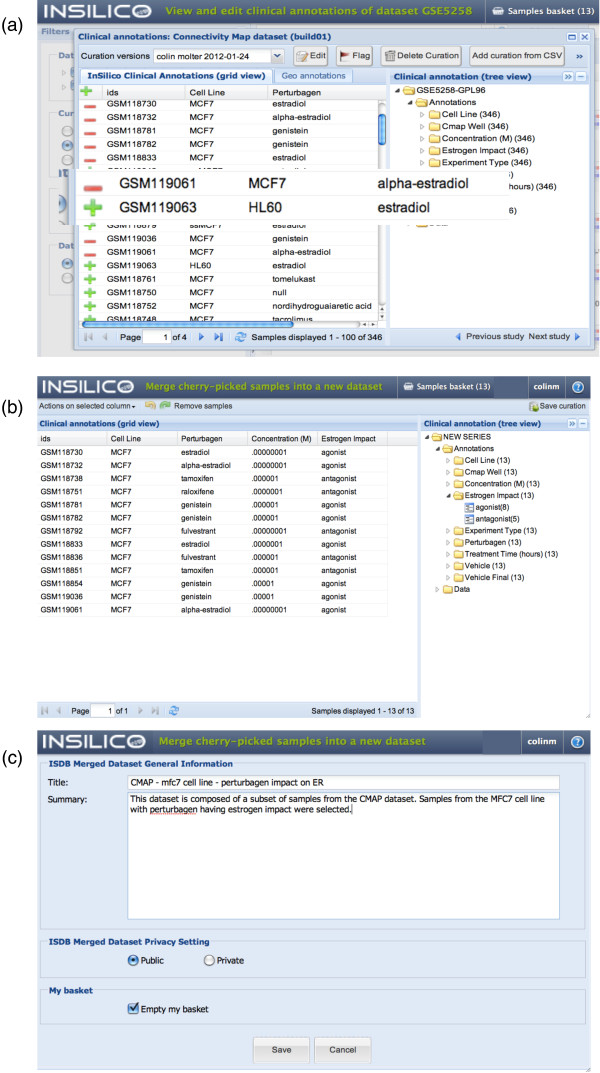
Meta-dataset creation process. Process of grouping specific selected profiles. (a) Press the green '+' (plus sign) toggle button to add samples to the 'Samples basket', and subsequently press the red '-' (minus sign) toggle button to remove samples. (b) In the samples basket, clinical annotations can be refined and standardized as explained in the 'Clinical annotations and biocuration' section. Additionally, samples can be removed using the 'tree view' actions. (c) To save, the user specifies a title, a summary and the desired privacy for the new dataset.
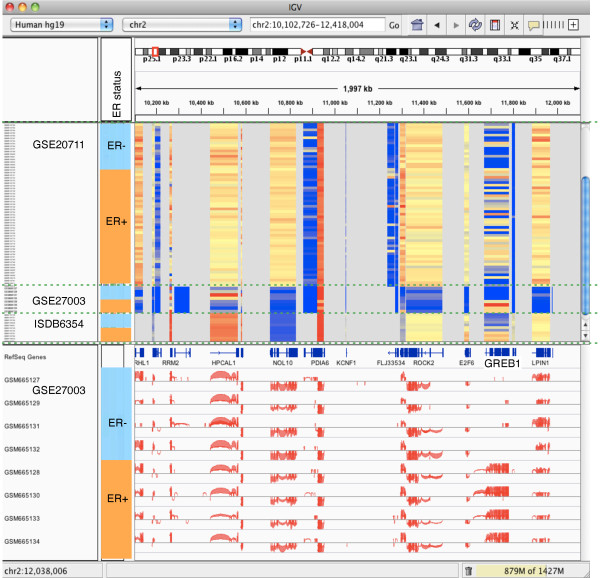
Visualizing microarray and RNA-Seq gene expression data with IGV. Joint visualization in IGV of three datasets: two microarray (GSE20711 and ISDB6354) and one RNA-Seq (GSE27003). The three datasets share the ER pathway activation status annotation (ER+/ER-). The top part of the central panel displays gene expression heatmaps. The bottom view displays the splice variants for the RNA-Seq dataset. The view is zoomed in on the locus containing an example gene, GREB1, in chromosome 2 that is regulated in the two microarray datasets.

Comparing signatures from differentially expressed genes between ER+/ER- samples in three conditions. (a) Venn diagram showing the intersections of the signatures of the top 500 differentially expressed genes related to the ER pathway activation status for two microarray datasets (GSE20711 from Dedeurwaerder et al. [45], and ISDB6354 from Lamb et al. [8]) and one RNA-Seq dataset (GSE27003 from Sun et al. [46]) (for a full list of intersecting genes, see Additional file 3). (b) Top 5 curated gene sets associated with the 64 genes at the intersections obtained from MSigDB.
References
-
- Golub TR, Slonim DK, Tamayo P, Huard C, Gaasenbeek M, Mesirov JP, Coller H, Loh ML, Downing JR, Caligiuri MA, Bloom eld CD, Lander ES. Molecular classification of cancer: class discovery and class prediction by gene expression monitoring. Science. 1999;286:531–537. - PubMed
-
- Detours V, Dumont JE, Bersini H, Maenhaut C. Integration and cross-validation of high-throughput gene expression data: comparing heterogeneous data sets. FEBS Lett. 2003;546:98–102. - PubMed
-
- van Staveren WCG, Weiss Sol s DY, Hebrant A, Detours V, Dumont JE, Maenhaut C. Human cancer cell lines: Experimental models for cancer cells in situ? For cancer stem cells?. Biochim Biophys Acta. 2009;1795:92–103. - PubMed
-
- Tomas G, Tarabichi M, Gacquer D, Hebrant A, Dom G, Dumont JE, Keutgen X, Fahey T, Maenhaut C, Detours V. A general method to derive robust organ-specific gene expression-based differentiation indices: application to thyroid cancer diagnostic. Oncogene. 2012;31:4490–4498. - PubMed
Publication types
MeSH terms
LinkOut - more resources
Full Text Sources
Other Literature Sources
Miscellaneous
