. 2012 Nov 18;4(11):86.
doi: 10.1186/gm387. eCollection 2012.

Comprehensive analysis of the genome transcriptome and proteome landscapes of three tumor cell lines

Affiliations

Comprehensive analysis of the genome transcriptome and proteome landscapes of three tumor cell lines

Pelin Akan et al. Genome Med. .

Abstract

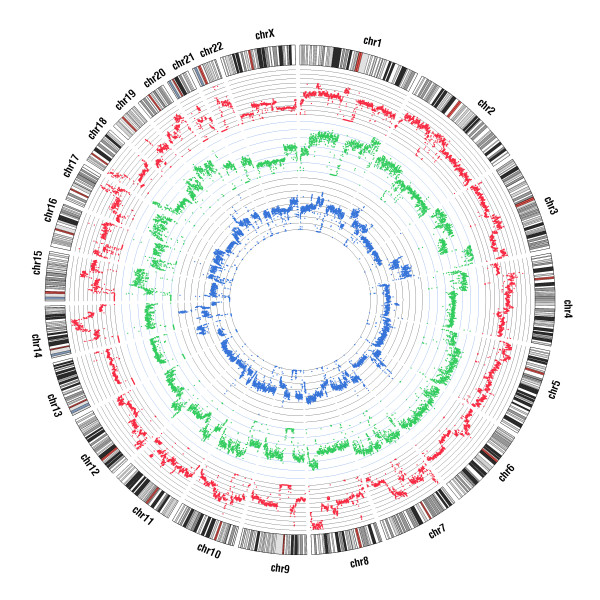
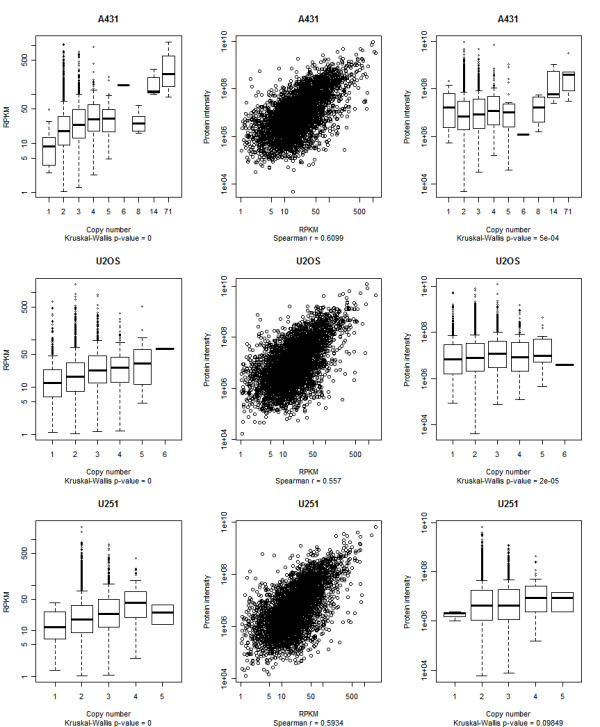
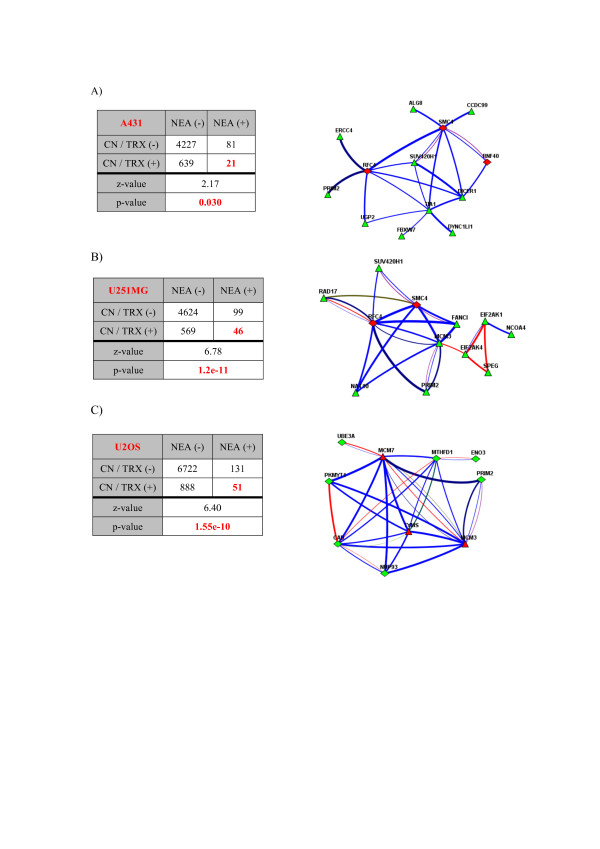
We here present a comparative genome, transcriptome and functional network analysis of three human cancer cell lines (A431, U251MG and U2OS), and investigate their relation to protein expression. Gene copy numbers significantly influenced corresponding transcript levels; their effect on protein levels was less pronounced. We focused on genes with altered mRNA and/or protein levels to identify those active in tumor maintenance. We provide comprehensive information for the three genomes and demonstrate the advantage of integrative analysis for identifying tumor-related genes amidst numerous background mutations by relating genomic variation to expression/protein abundance data and use gene networks to reveal implicated pathways.


Figures

Figure 1
Figure 1
Whole genome read coverage plots of A431 (blue), U251MG (green) and U2OS (red) cell lines in Circos format. The coverage profile was computed for windows of 250 kb. For each cell line, the middle line corresponds to no copy number change, and data points above represent amplifications and those below represent losses. The outermost circle represents the chromosomes with cytogenetic bands.
Figure 2
Figure 2
Correlations between gene copy number, transcription, and protein abundance. Within each cell line, correlations between the three values were estimated for the 4,554 genes that had protein intensity data. Each row shows data for one of the three cell lines. Left panels: non-parametric ANOVA with gene copy number as the factor and the RPKM values as the response (the box shows the 25th, 50th, and 75th percentiles. The length of the error bars is equal to 1.5 times the interquartile range and the quoted P-values refer to the Kruskal-Wallis ANOVA test). Middle panels: relationship between RPKM values and protein intensity. Right panels: same as left panels but with protein intensity as the response.
Figure 3
Figure 3
Complex amplification of EGFR and PPARGC1A loci. (a) The region within the curly bracket is the tandemly duplicated unit in reverse orientation. It contains a 639 kb region (chr7: 54,973,500-55,632,000, red arrow, carrying the EGFR gene) and its inverted partial duplicate that contains the 1.3 Mb region on chr4 (chr4: 22,864,000-24-249,500, white box, carrying the PPARGC1A gene) and shorter regions from chromosomes 1, 21 and 3 (green, blue and purple boxes). (b) A431 cells in the metaphase, pink probes target amplified EGFR (340 kb), green probes target the centromere of chromosome 7. EGFR is located in chromosome 7 as well as in two minute chromosomes. (c) The probes targeting the PPARGC1A locus (chr4p15) and EGFR are visualized together, confirming the co-localization of these two heavily amplified loci in the minute chromosomes.
Figure 4
Figure 4
Contingency tables for genes identified using two different filtering schemes. (a) A431, (b) U251MG and (c) U2OS cell lines. CN/TRX (+) denotes genes for which the average Spearman coefficient over all three cell lines for the relationship between copy number and transcription is >0.8. NEA (+) denotes genes exhibiting enriched connectivity to genes carrying damaging mutations in the same cell line (NEA z-score >1.96). These criteria were selected to optimize the 'sensitivity/specificity' trade-off after having considered several alternatives (Figure S4 in Additional file 1). In the network diagrams in the same cell line order, red triangles denote CNA genes coupled with more than five links to genes carrying damaging SNVs in the same line, denoted as green diamonds. The color scheme for the connections is: red lines for physical protein interaction, blue lines for mRNA co-expression, green lines for protein co-expression, purple lines for sub-cellular co-localization, khaki lines for coherence of Gene Ontology annotation, deep bluish green lines for links in a KEGG pathway, and deep blue lines for known members of the same complex.
Figure 5
Figure 5
Mapping of genomic alterations in three cell lines to most basic signaling pathways from the KEGG database, KEGG cancer super-pathway 05200, and the group of 623 genes associated with cancer by Ding et al. [42]. Yellow boxes, U251MG; blue boxes, A431; purple boxes, U2OS. A single line summarizes the network connections between each pair of gene sets, with the line's width reflecting the number of links in the global network connecting individual genes from the two functional gene sets (3...189). Only relations significant by NEA are shown (P-value <0.05, FDR <0.10). Edge opacity and edge width reflect the number of individual gene-gene links behind the relation (also printed in brown at each edge). Mapping between experimentally determined gene sets of cell lines is highlighted in red. AI, allelic imbalance; MTOR, mammalian target of rapamycin; TGF, transforming growth factor; VEGF, vascular endothelial growth factor.

References

    1. Uhlen M, Oksvold P, Fagerberg L, Lundberg E, Jonasson K, Forsberg M, Zwahlen M, Kampf C, Wester K, Hober S, Wernerus H, Bjorling L, Ponten F. Towards a knowledge-based Human Protein Atlas. Nat Biotechnol. 2010;28:1248–1250. doi: 10.1038/nbt1210-1248. - DOI - PubMed
    1. Giard DJ, Aaronson SA, Todaro GJ, Arnstein P, Kersey JH, Dosik H, Parks WP. In vitro cultivation of human tumors: establishment of cell lines derived from a series of solid tumors. J Natl Cancer Inst. 1973;51:1417–1423. - PubMed
    1. Westermark B, Ponten J, Hugosson R. Determinants for the establishment of permanent tissue culture lines from human gliomas. Acta Pathol Microbiol Scand A. 1973;81:791–805. - PubMed
    1. Ponten J, Saksela E. Two established in vitro cell lines from human mesenchymal tumours. Int J Cancer. 1967;2:434–447. doi: 10.1002/ijc.2910020505. - DOI - PubMed
    1. Ottaviani G, Jaffe N. The epidemiology of osteosarcoma. Cancer Treat Res. 2009;152:3–13. doi: 10.1007/978-1-4419-0284-9_1. - DOI - PubMed

LinkOut - more resources