

Preventing preterm births: analysis of trends and potential reductions with interventions in 39 countries with very high human development index
- PMID: 23158883
- PMCID: PMC3572865
- DOI: 10.1016/S0140-6736(12)61856-X
Preventing preterm births: analysis of trends and potential reductions with interventions in 39 countries with very high human development index
Abstract
Background: Every year, 1·1 million babies die from prematurity, and many survivors are disabled. Worldwide, 15 million babies are born preterm (<37 weeks' gestation), with two decades of increasing rates in almost all countries with reliable data. The understanding of drivers and potential benefit of preventive interventions for preterm births is poor. We examined trends and estimate the potential reduction in preterm births for countries with very high human development index (VHHDI) if present evidence-based interventions were widely implemented. This analysis is to inform a rate reduction target for Born Too Soon.
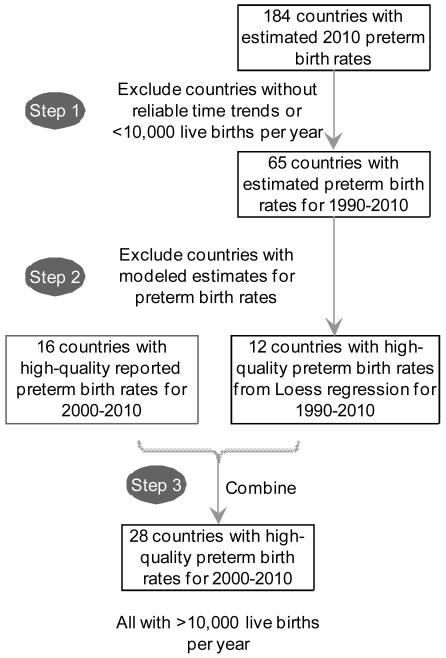
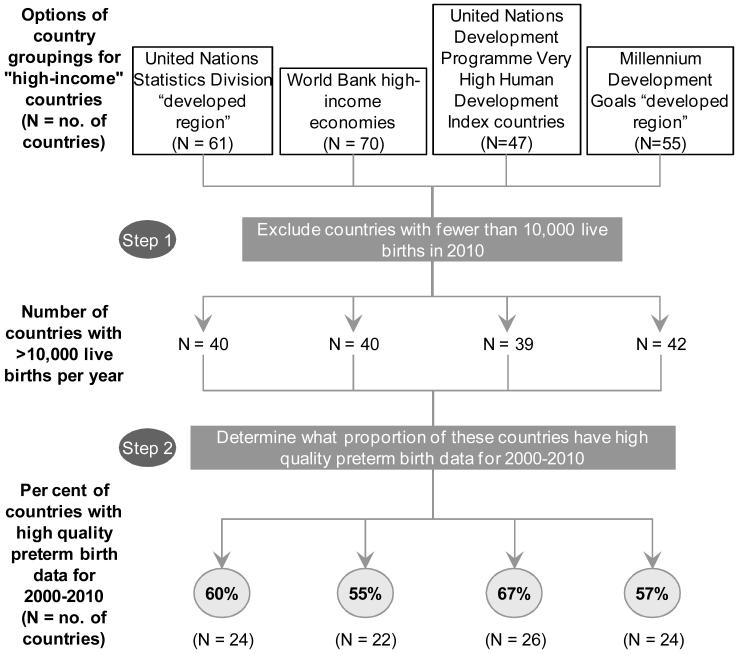
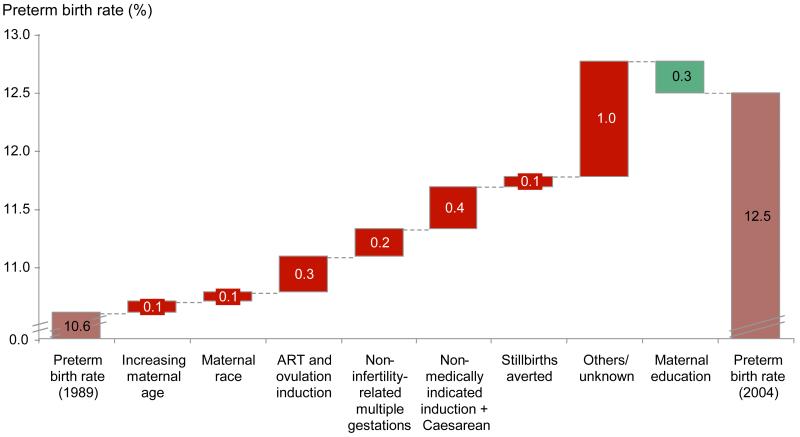
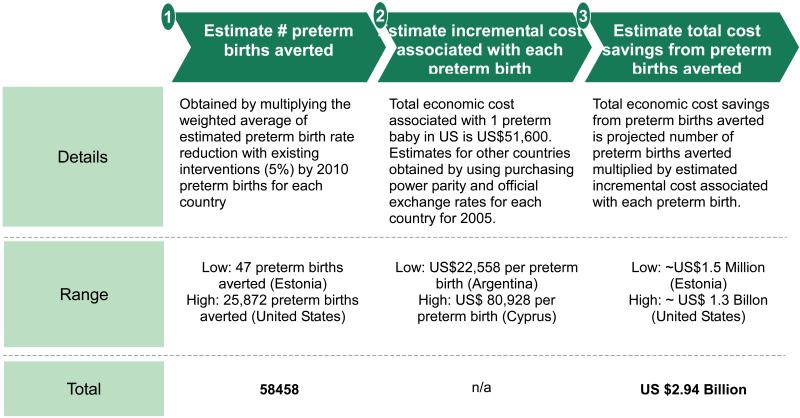
Methods: Countries were assessed for inclusion based on availability and quality of preterm prevalence data (2000-10), and trend analyses with projections undertaken. We analysed drivers of rate increases in the USA, 1989-2004. For 39 countries with VHHDI with more than 10,000 births, we did country-by-country analyses based on target population, incremental coverage increase, and intervention efficacy. We estimated cost savings on the basis of reported costs for preterm care in the USA adjusted using World Bank purchasing power parity.
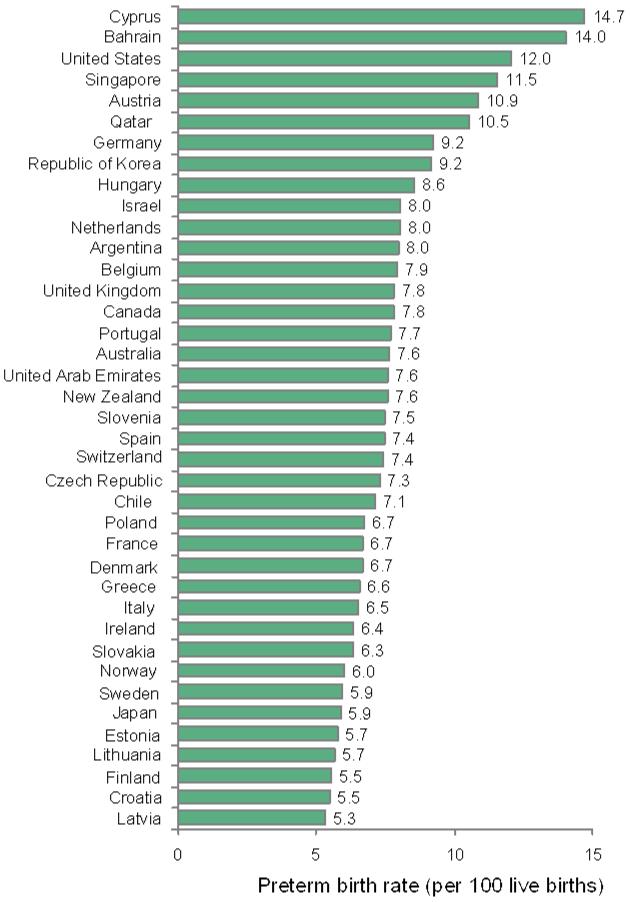
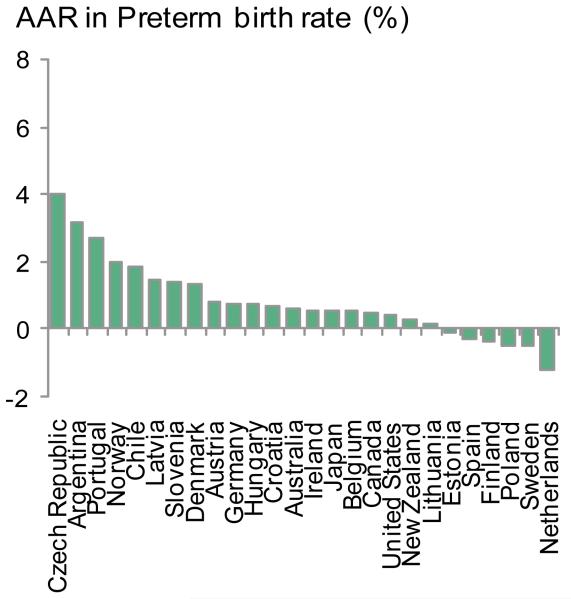
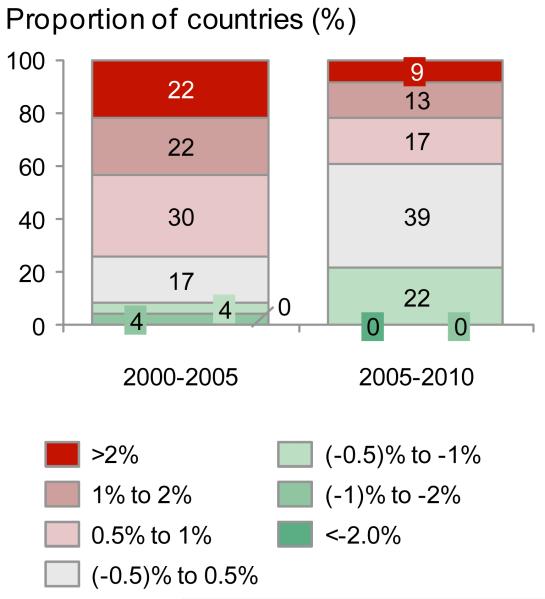
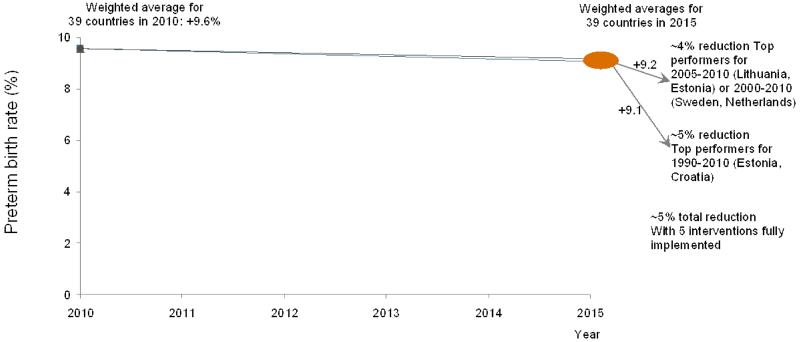
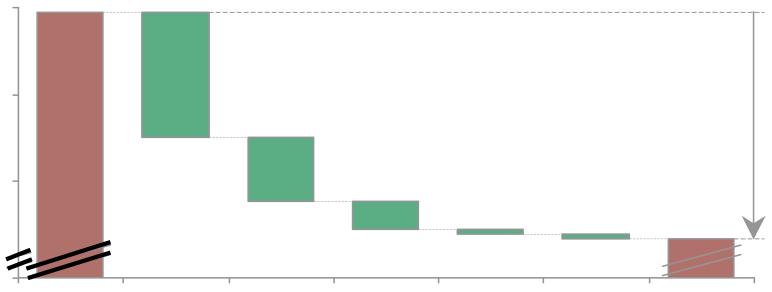
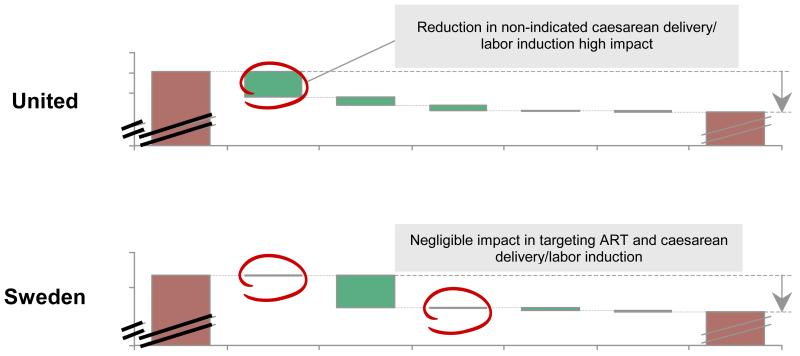
Findings: From 2010, even if all countries with VHHDI achieved annual preterm birth rate reductions of the best performers for 1990-2010 (Estonia and Croatia), 2000-10 (Sweden and Netherlands), or 2005-10 (Lithuania, Estonia), rates would experience a relative reduction of less than 5% by 2015 on average across the 39 countries. Our analysis of preterm birth rise 1989-2004 in USA suggests half the change is unexplained, but important drivers include non-medically indicated labour induction and caesarean delivery and assisted reproductive technologies. For all 39 countries with VHHDI, five interventions modelling at high coverage predicted a 5% relative reduction of preterm birth rate from 9·59% to 9·07% of livebirths: smoking cessation (0·01 rate reduction), decreasing multiple embryo transfers during assisted reproductive technologies (0·06), cervical cerclage (0·15), progesterone supplementation (0·01), and reduction of non-medically indicated labour induction or caesarean delivery (0·29). These findings translate to roughly 58,000 preterm births averted and total annual economic cost savings of about US$3 billion.
Interpretation: We recommend a conservative target of a relative reduction in preterm birth rates of 5% by 2015. Our findings highlight the urgent need for research into underlying mechanisms of preterm births, and development of innovative interventions. Furthermore, the highest preterm birth rates occur in low-income settings where the causes of prematurity might differ and have simpler solutions such as birth spacing and treatment of infections in pregnancy than in high-income countries. Urgent focus on these settings is also crucial to reduce preterm births worldwide.
Funding: March of Dimes, USA, Eunice Kennedy Shriver National Institute of Child Health and Human Development, and National Institutes of Health, USA.
Copyright © 2013 Elsevier Ltd. All rights reserved.
Figures
Comment in
-
Prevention of preterm birth--why can't we do any better?Lancet. 2013 Jan 19;381(9862):184-5. doi: 10.1016/S0140-6736(12)61956-4. Epub 2012 Nov 16. Lancet. 2013. PMID: 23158880 No abstract available.
-
Preterm births in countries with a very high human development index.Lancet. 2013 Apr 20;381(9875):1355. doi: 10.1016/S0140-6736(13)60875-2. Lancet. 2013. PMID: 23601940 No abstract available.
-
Preterm births in countries with a very high human development index.Lancet. 2013 Apr 20;381(9875):1355. doi: 10.1016/S0140-6736(13)60876-4. Lancet. 2013. PMID: 23601941 No abstract available.
-
Preterm births in countries with a very high human development index.Lancet. 2013 Apr 20;381(9875):1355-1356. doi: 10.1016/S0140-6736(13)60877-6. Lancet. 2013. PMID: 23601942 No abstract available.
-
Preterm births in countries with a very high human development index - Authors' reply.Lancet. 2013 Apr 20;381(9875):1356-1357. doi: 10.1016/S0140-6736(13)60878-8. Lancet. 2013. PMID: 23601943 No abstract available.
References
-
- Liu L, Johnson HL, Cousens S, Perin J, Scott S, Lawn JE, et al. Global, regional, and national causes of child mortality: an updated systematic analysis for 2010 with time trends since 2000. Lancet. 2012;379(9832):2151–61. - PubMed
-
- Lawn JE, Cousens S, Zupan J. 4 million neonatal deaths: when? Where? Why? Lancet. 2005;365(9462):891–900. - PubMed
-
- Blencowe H, Cousens S, Oestergaard MZ, Chou D, Moller A-B, Narwal R, et al. National, regional, and worldwide estimates of preterm birth rates in the year 2010 with time trends since 1990 for selected countries: a systematic analysis and implications. The Lancet. 2012;379(9832):2162–72. - PubMed
-
- March of Dimes, PMNCH, Save the Children, WHO. Born Too Soon . In: The Global Action Report on Preterm Birth. Howson CP, Kinney MV, Lawn JE, editors. World Health Organization; Geneva: 2012.
Publication types
MeSH terms
Substances
Grants and funding
LinkOut - more resources
Full Text Sources
Other Literature Sources
