. 2012 Nov 21;151(5):994-1004.
doi: 10.1016/j.cell.2012.09.045. Epub 2012 Nov 15.

Facilitators and impediments of the pluripotency reprogramming factors' initial engagement with the genome

Affiliations

Facilitators and impediments of the pluripotency reprogramming factors' initial engagement with the genome

Abdenour Soufi et al. Cell. .

Abstract

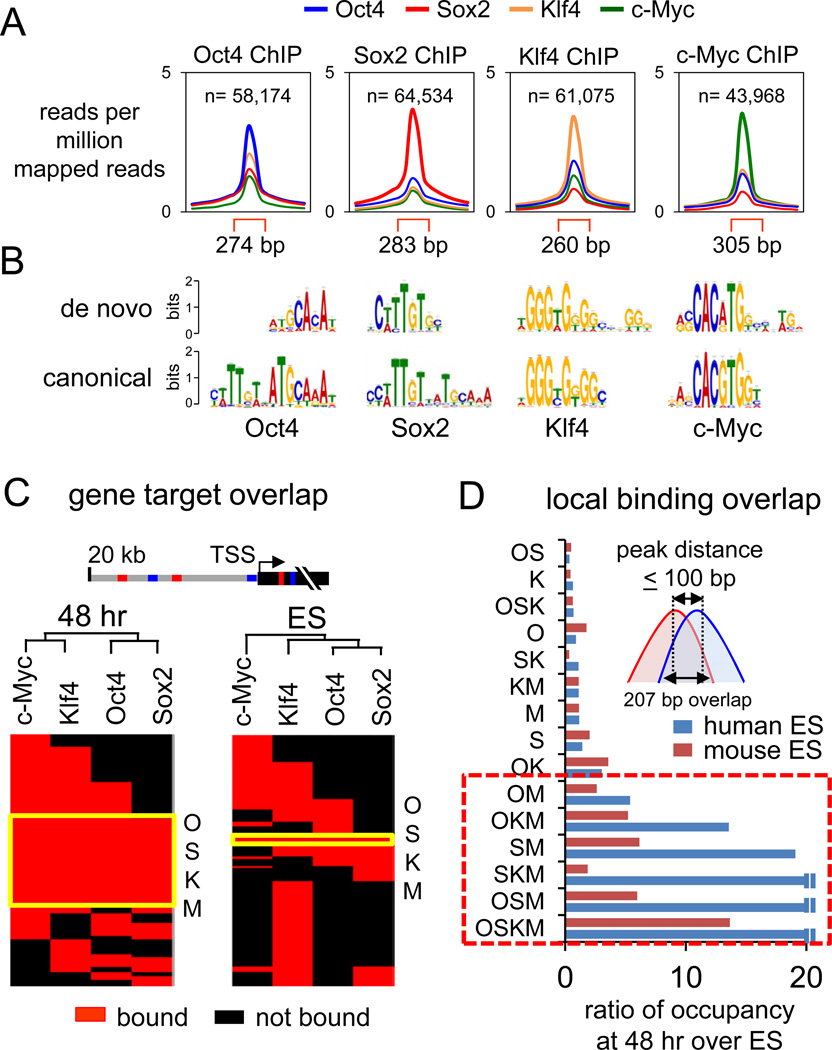
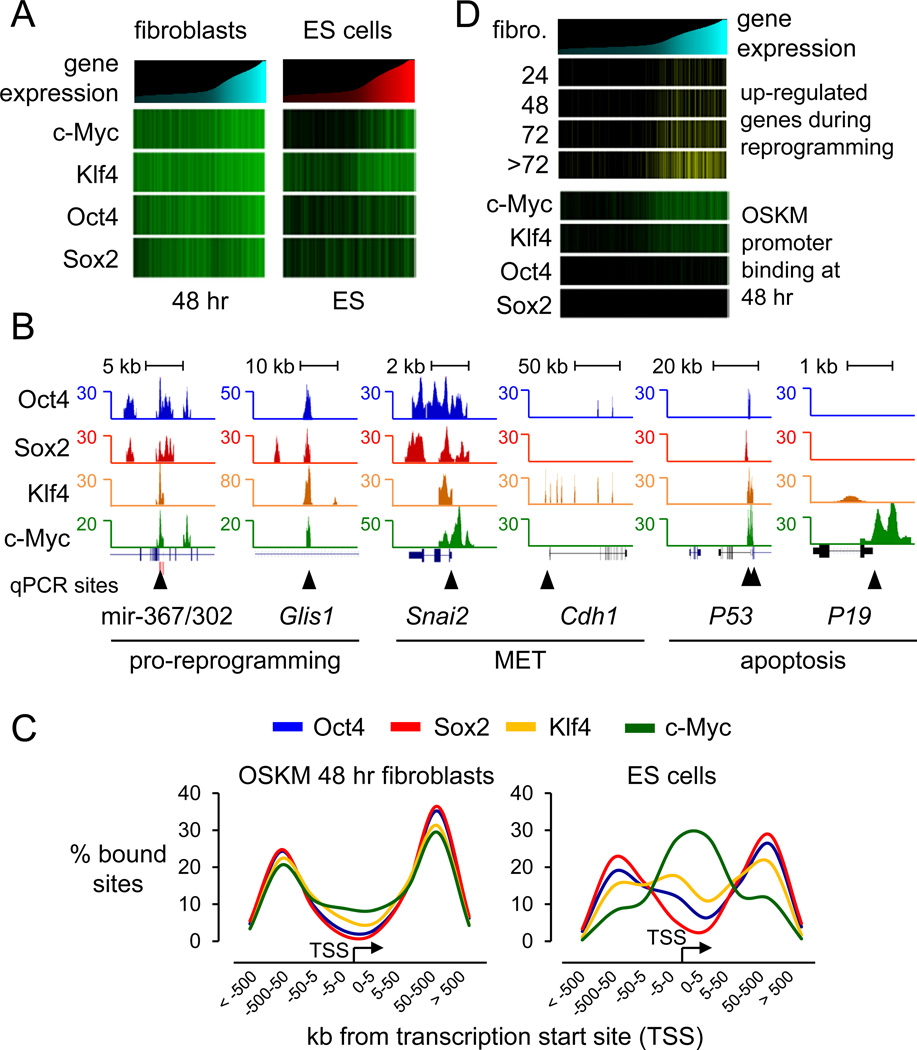
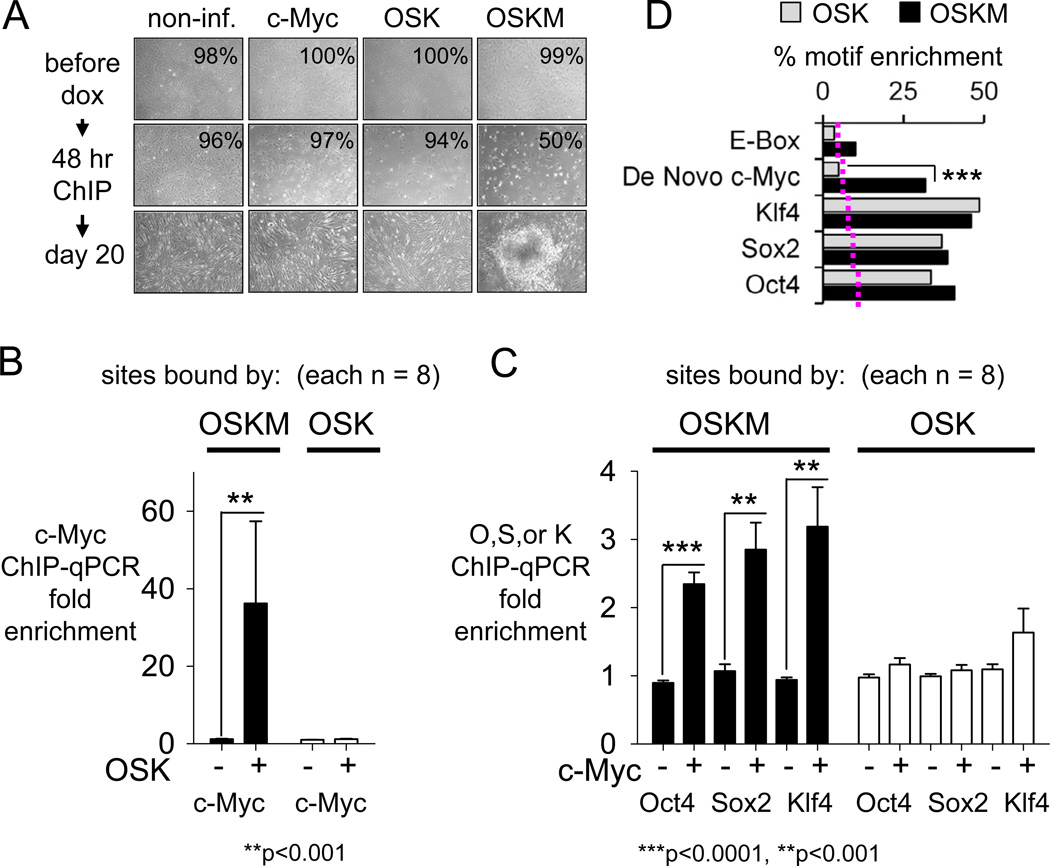
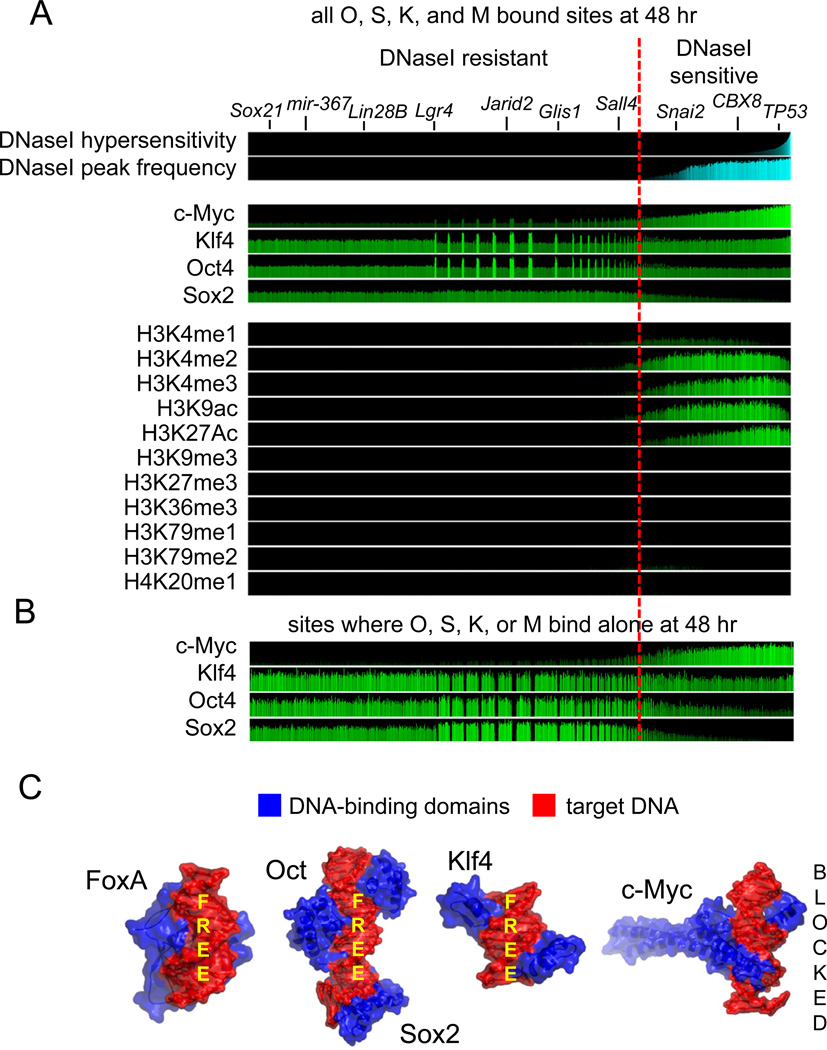
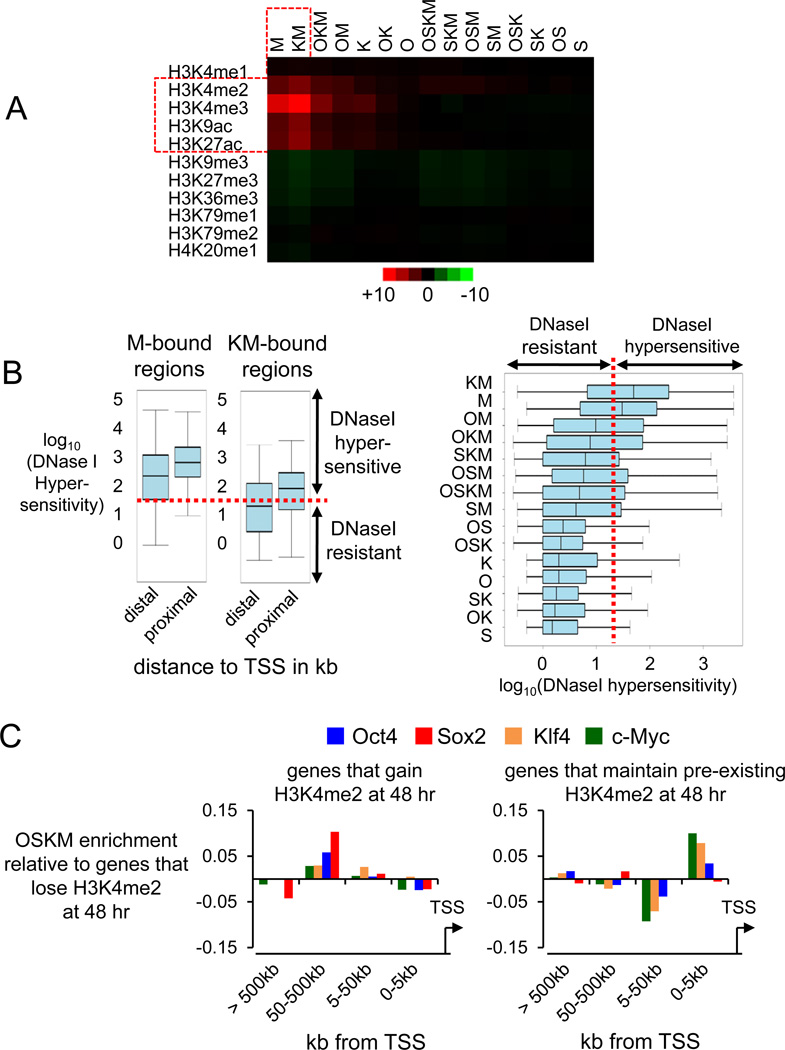
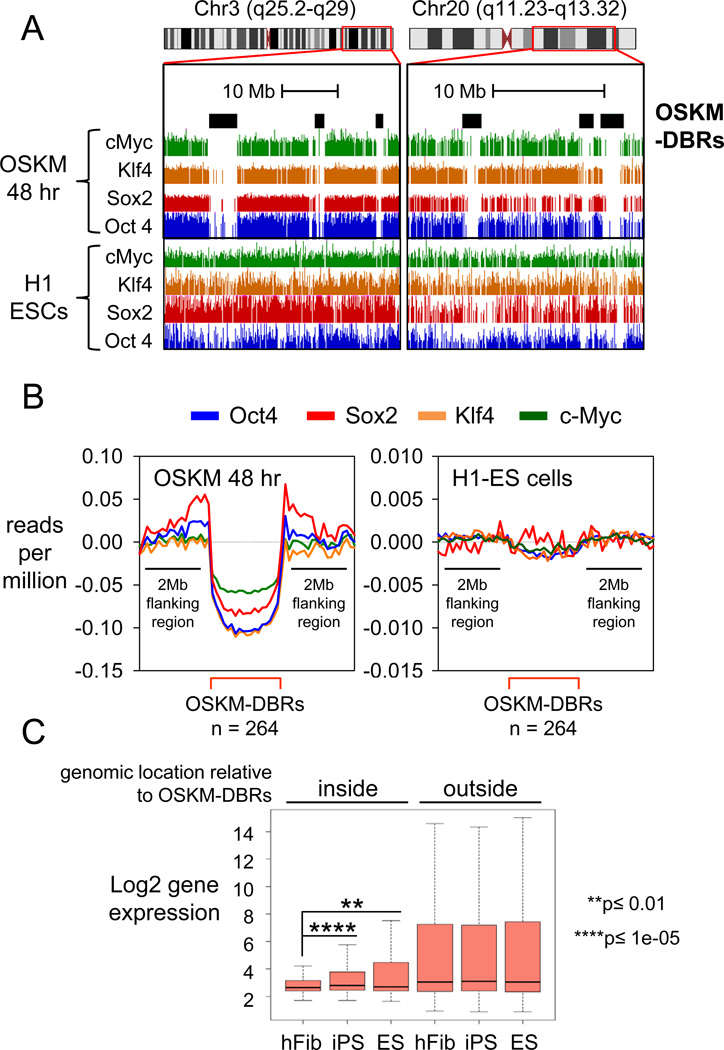
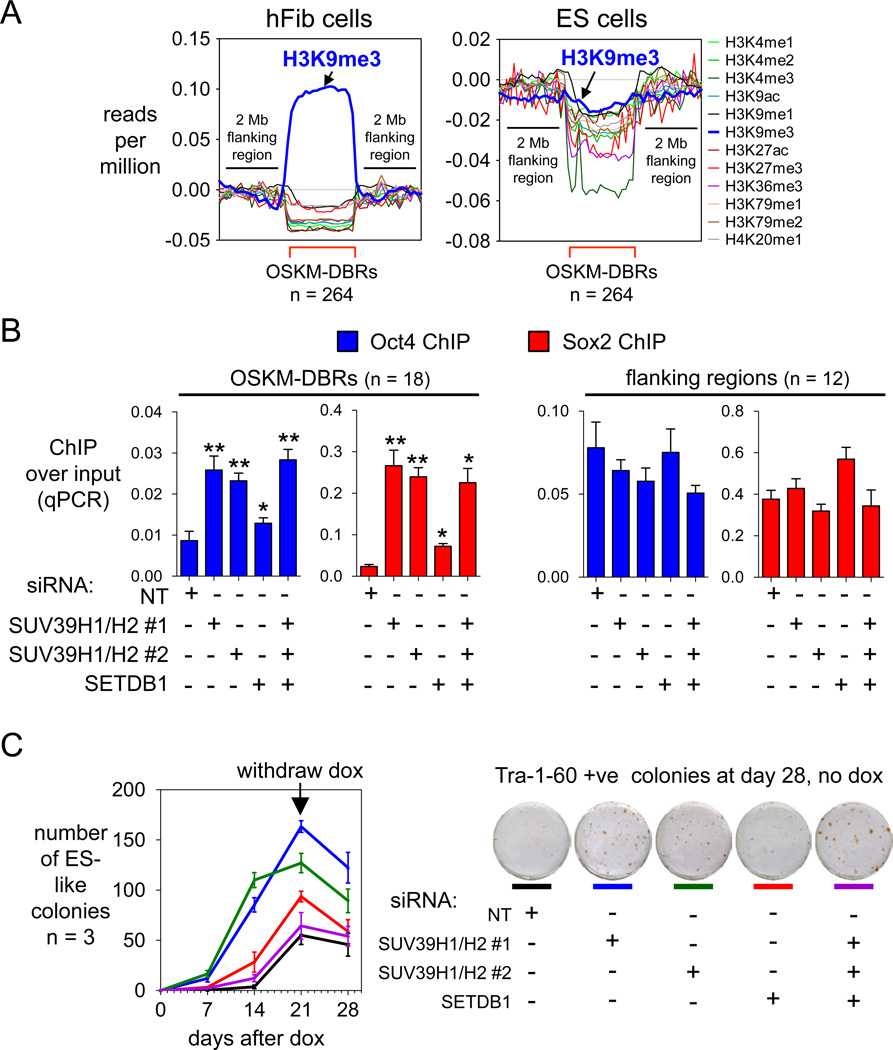
The ectopic expression of transcription factors can reprogram cell fate, yet it is unknown how the initial binding of factors to the genome relates functionally to the binding seen in the minority of cells that become reprogrammed. We report a map of Oct4, Sox2, Klf4, and c-Myc (O, S, K, and M) on the human genome during the first 48 hr of reprogramming fibroblasts to pluripotency. Three striking aspects of the initial chromatin binding events include an unexpected role for c-Myc in facilitating OSK chromatin engagement, the primacy of O, S, and K as pioneer factors at enhancers of genes that promote reprogramming, and megabase-scale chromatin domains spanned by H3K9me3, including many genes required for pluripotency, that prevent initial OSKM binding and impede the efficiency of reprogramming. We find diverse aspects of initial factor binding that must be overcome in the minority of cells that become reprogrammed.


Figures

Figure 1
Figure 1. Extensive OSKM engagement with the genome at 48 hr post-induction
(A) O, S, K, and M peak profiles showing average read counts, input subtracted, lane-normalized, and as reads per million mapped reads. Read counts within peak regions (red brackets) are compared to 1 kb flanking regions. See Figures S1, S2, and Table S1 for ChIP-seq details and peak examples. (B) De novo sequence motifs overrepresented in the O, S, K, and M peaks compared to their canonical motifs found in the JASPAR database (Bryne et al., 2008). (C) Hierarchical clustering of O, S, K, and/or M co-bound target genes in 48 hr (left) and in ES cells (right). Genes are called OSKM-targets if bound within the gene body or 20 kb upstream and are shown as red rectangles and non-targets as black rectangles. The genes co-targeted by all OSKM factors are indicated in the yellow boxed region, “OSKM”. (D) OSKM co-bound regions at 48 hr with peak distances ≤100 bp are more frequent compared to those found in human ES (blue bars) (Lister et al., 2009) and mouse ES (red bars) (Chen et al., 2008). The O, S, K, and/or M co-bound regions are expressed as ratio of that seen at 48 hr to that seen in ES cells. Boxed area indicates extensive co-binding of c-Myc with O, S, and/or K. See also Figures S1, S3, and Table S3.
Figure 2
Figure 2. OSKM initially targets genes for reprogramming and apoptosis
(A) Heatmap analysis showing the correlation between O, S, K, and/or M binding in 48 hr and in ES cells, and gene expression in uninfected human fibroblasts and ES cells (Chen et al., 2008; Lowry et al., 2008; Sridharan et al., 2009). Genes were rank ordered according to their level of expression in fibroblast cells (cyan histogram, left panel) or in ES cells (red histogram, right panel) and correlated with their O, S, K, and/or M occupancy (green llines) at 48 hr (left panel) or in ES cells (right panel), respectively. Table S3 shows expression values in hFib, iPS, and ES cells. (B) O, S, K, and M ChIP-seq profiles (blue, red, orange, and green respectively) at genes bound at 48 hr and important for reprogramming or apoptosis. OSKM peaks presented are normalized against input DNA sequenced tags. Black triangles indicate regions validated by ChIP-qPCR, as shown in Figure S3C. (C) O, S, K, and M binding with respect to transcription start sites (TSS) are displayed with the frequency of total binding for Oct4 (blue), Sox2 (red), Klf4 (orange), and c-Myc (green) in 48 hr (left panel) and in ES (right panel, from Chen et al. 2008). See Figure S4 for detailed O, S, K, and/or M binding combination distributions and functional enhancer binding. (D) Gene expression levels in fibroblasts are rank-ordered from low to high (top cyan histogram). Genes that change expression 2-fold or more over fibroblasts during 24, 48, 72, and >72 hr of reprogramming (Koche et al., 2011) are displayed as yellow lines and correlated with genes occupied by O, S, K, and/or M in their promoters (±1 kb of TSS) at 48 hr (green lines). See also Figures S2–4.
Figure 3
Figure 3. OSK act as pioneer factors for c-Myc and c-Myc enhances OSK binding to chromatin
(A) Non-infected and, c-Myc, OSK, or OSKM-infected fibroblasts at 0 hr, 48 hr and day 20 post-induction with dox. Viability is indicated at 0 and 48 hr post-induction with dox and shows marked apoptosis when c-Myc is expressed with OSK. (B) ChIP-qPCR assays at 48 hr on 8 OSKM target sites (Mak10, Gins1, Jmjd2C, Jmjd1A, Smarcad1, Sox21, Lgr4, MIR-367; Figure S5B) and 8 OSK target sites (Pax6-1, Pax6-2, Pde4D, Gmpr, BckdhB, DdhD2, Astn2, Kcnip2; Figure S5B). Bars, means ± SEM of two biological replicates; each qPCR reaction with three technical replicates. (C) As for (B). (D) The enrichment of E-box, a de novo c-Myc (see Figure 1B), Oct4, Sox2, and Klf4 motifs within the OSK (gray bars) versus OSKM (black bars) are plotted against frequency of sites containing the motifs allowing no more than one bp mismatch. The threshold enrichment for each motif in random genomic sequences is displayed as dotted line. The data indicate that c-Myc is driven to OSKM sites in part by the novel, variant motif ***p<0.0001. See also Figure S5.
Figure 4
Figure 4. Oct4, Sox2, and Klf4 initially access closed chromatin extensively
(A) For each of the 188,595 O, S, K, and/or M-bound sites at 48 hr (ave. peak width 208 bp), DNaseI sensitivity is displayed in pre-infected fibroblasts and the sites are rank ordered by degree of hypersensitivity (top cyan panel), with the DNaseI peaks occurrence shown in the second cyan panel. A red line separates the hypersensitive from the resistant regions. The top 4 green panels show read counts for O, S, K, and/or M within the bound sites at 48 hr, followed by read counts of ChIP-seq of designated histone modifications in uninfected fibroblasts (Lister et al., 2011). All read counts were input- and length-normalized and shown per million mapped tags. Genes at the top are relevant to reprogramming, validated for OSKM binding at 48 hr (Table S2), and reside in DNase-resistant chromatin. Spikes in the DNase-resistant regions for O,S,K,M are where the factors bind strongly together. (B) As in A, but for the 156,401 sites where O, S, K, or M each bind alone at 48 hr. (C) The three dimensional structures of the DNA-binding domains (blue) of FoxA, Oct-Sox2 (PDB-1GT0), Klf4 (PDB-2WBU), and cMyc (PDB-1NKP) in complex with their specific respective DNA sites (red). Free DNA surfaces are indicated, showing that OSK but not M could potentially bind DNA sites simultaneously with other proteins.
Figure 5
Figure 5. OSKM are not strongly directed by pre-existing histone modifications
(A) The enrichment of the pre-existing histone modifications within the OSKM bound regions at 48 hr is displayed as a heatmap correlation. The counts of histone modifications ChIP-seq reads under each O, S, K, and/or M-bound region were input- and length-normalized and expressed as reads per million mapped tags. The color display ranges from +10 reads per million (red) to −10 reads per million (green). Red outlined regions denote marked correlations. (B) Left. DNaseI hypersensitivity within regions co-bound by c-Myc alone and Klf4 and c-Myc (KM) were divided into groups based on their distance to TSS (distal, more than 1 kb away from TSS; proximal, within 1 kb of TSS) and assessed for DNaseI hypersensitivity, as shown in box and whisker plots on a log10 scale. The bottom and top of the box are the 25th and 75th percentiles and the middle band is the 50th percentile DNaseI hypersensitivity value; whisker ends are the min and max values. Right. As in the left panel but showing all O, S, K, and/or M combinations at 48 hr. The red dotted line represents the border between hypersensitive and resistant sites. (C) O, S, K, and M binding enrichment at distal elements of genes that gain the H3K4me2 mark in 48 hr, relative to genes that lose the mark (left). Enrichment of c-Myc and Klf4 at proximal elements (promoters) of genes that maintain an H3K4me2 mark (right). H3K4me2 data of (Koche et al., 2011). See also Figure S6.
Figure 6
Figure 6. Megabase-sized domains of the genome are refractory to the initial binding of OSKM
(A) Examples of diminished OSKM ChIP-seq signals within OSKM-DBRs (black rectangles) at 48 hr after induction (top four tracks) compared to those in H1-ES (bottom four tracks). (B) The average reads count for O, S, K, and M (blue, red, orange, and green lines respectively) within DBRs (red bracket) compared to 2 MB flanking regions at 48 hr (left) and H1-ES (right). Reads count is input subtracted, lane-normalized, and expressed as reads per million mapped reads. Size and number of OSKM-DBRs at 48 hr vs. ES cells are indicated. (C) Genes are typically silent within OSKM-DBRs and exhibit activation in iPS and ES cells. Microarray gene expression in hFib, hFib-iPS and H1-ES is shown as box and whisker plots along a log2 scale. See also Figure S7 and Table S4.
Figure 7
Figure 7. H3K9me3 is markedly enriched at OSKM-DBRs and is an impediment to initial OSKM binding
(A) Read counts of ChIP-seq of histone modifications in uninfected human fibroblasts (left panel) and human ES cells (right panel) (Lister et al., 2011) are displayed within DBRs (red brackets) compared to 2 MB flanking regions. Read counts were input- and length-normalized and shown per million mapped tags. (B) Fibroblasts were treated with either NT siRNA, SUV39H1/H2 siRNA, or SETDB1 siRNA twice before being infected with OSKM+rtTA lentiviruses, and OSKM expression was induced for 48 hr with dox (see Figure S7E,F). ChIP-qPCRs for Oct4 and Sox2 were carried out at 18 sites within DBRs and 12 sites flanking each DBR (Table S2) as controls. Assayed as in Figure 3B. (C) Knock-down of H3K9 histone methyltransferases increases the speed with which colonies appear after inducing OSKM with dox (left). Knockdown of SUV39H1and SUV39H2 leads to an increase in Tra-1-60 positive colonies, indicating enhanced reprogramming (right). See also Figure S7 and Table S4.

References

    1. Adams CC, Workman JL. Binding of disparate transcriptional activators to nucleosomal DNA is inherently cooperative. Mol Cell Biol. 1995;15:1405–1421. - PMC - PubMed
    1. Anokye-Danso F, Trivedi CM, Juhr D, Gupta M, Cui Z, Tian Y, Zhang Y, Yang W, Gruber PJ, Epstein JA, et al. Highly efficient miRNA-mediated reprogramming of mouse and human somatic cells to pluripotency. Cell Stem Cell. 2011;8:376–388. - PMC - PubMed
    1. Bailey TL, Gribskov M. Combining evidence using p-values: application to sequence homology searches. Bioinformatics. 1998;14:48–54. - PubMed
    1. Boyer LA, Lee TI, Cole MF, Johnstone SE, Levine SS, Zucker JP, Guenther MG, Kumar RM, Murray HL, Jenner RG, et al. Core transcriptional regulatory circuitry in human embryonic stem cells. Cell. 2005;122:947–956. - PMC - PubMed
    1. Brambrink T, Foreman R, Welstead GG, Lengner CJ, Wernig M, Suh H, Jaenisch R. Sequential expression of pluripotency markers during direct reprogramming of mouse somatic cells. Cell Stem Cell. 2008;2:151–159. - PMC - PubMed

Publication types

MeSH terms

Associated data