. 2013 Jan 10;49(1):80-93.
doi: 10.1016/j.molcel.2012.10.008. Epub 2012 Nov 15.

Characterization of the EZH2-MMSET histone methyltransferase regulatory axis in cancer

Affiliations

Characterization of the EZH2-MMSET histone methyltransferase regulatory axis in cancer

Irfan A Asangani et al. Mol Cell. .

Abstract

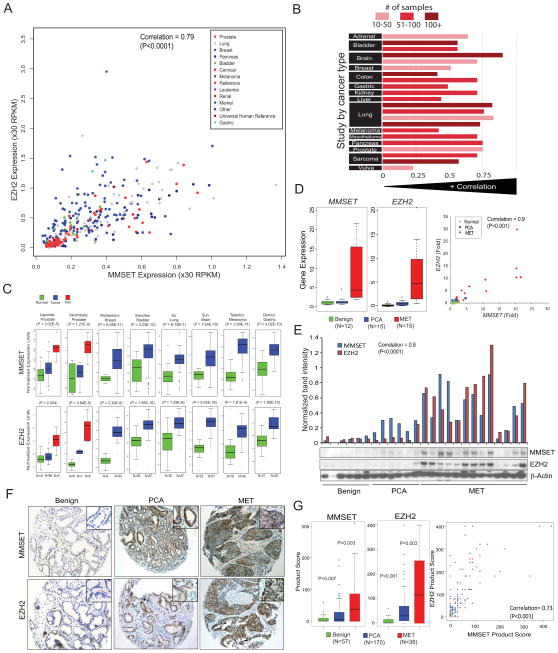
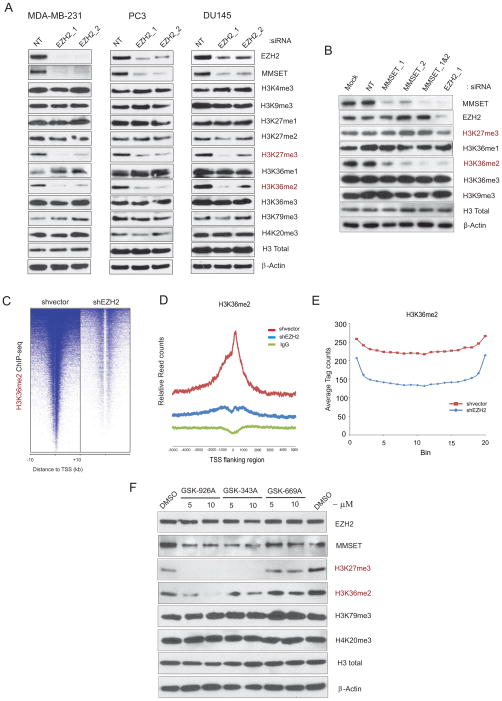
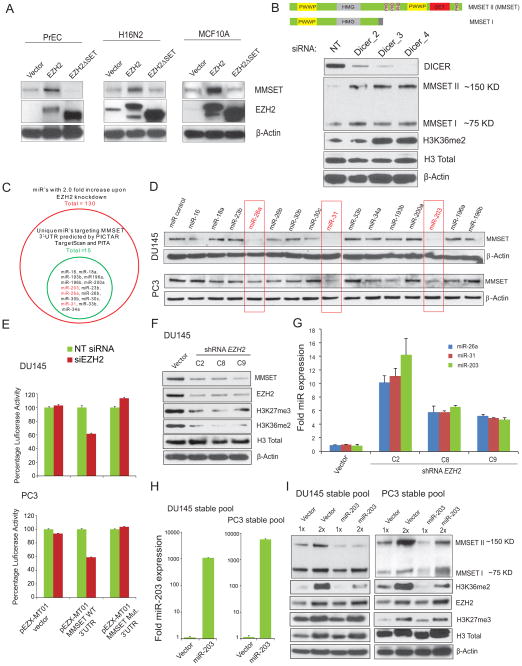
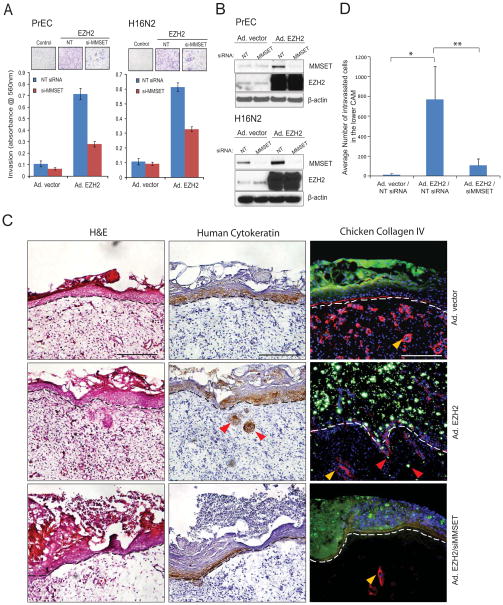
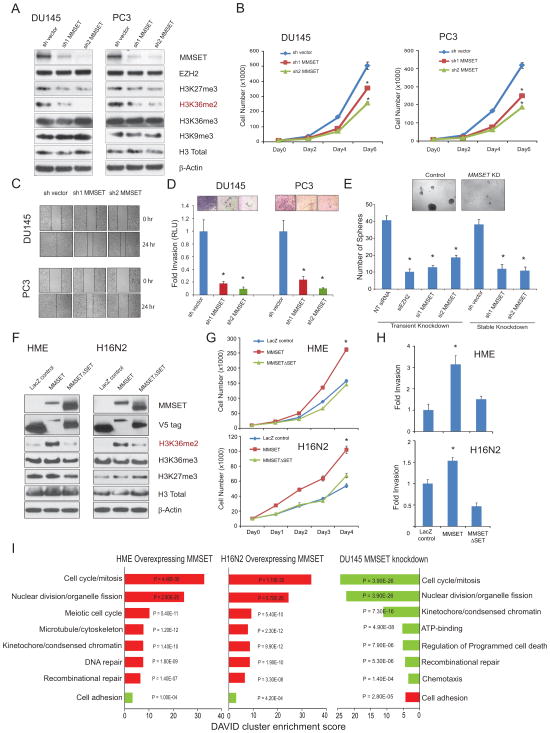
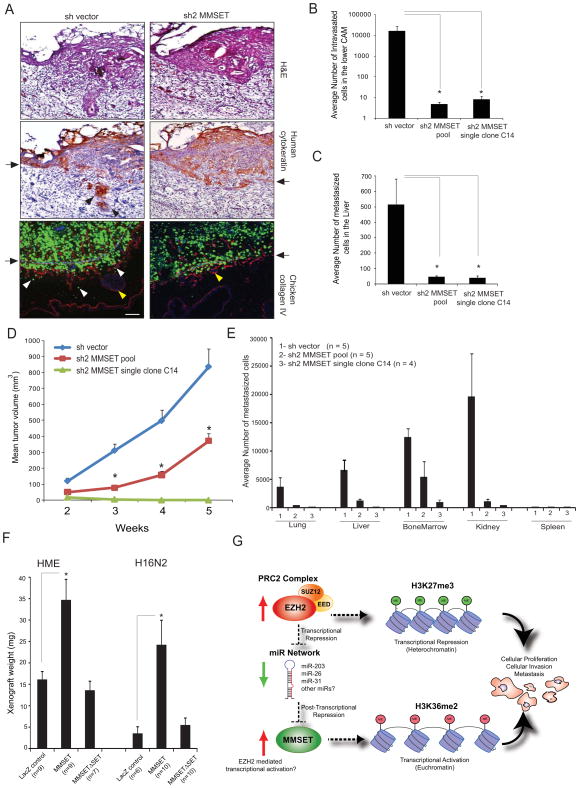
Histone methyltransferases (HMTases), as chromatin modifiers, regulate the transcriptomic landscape in normal development as well in diseases such as cancer. Here, we molecularly order two HMTases, EZH2 and MMSET, that have established genetic links to oncogenesis. EZH2, which mediates histone H3K27 trimethylation and is associated with gene silencing, was shown to be coordinately expressed and function upstream of MMSET, which mediates H3K36 dimethylation and is associated with active transcription. We found that the EZH2-MMSET HMTase axis is coordinated by a microRNA network and that the oncogenic functions of EZH2 require MMSET activity. Together, these results suggest that the EZH2-MMSET HMTase axis coordinately functions as a master regulator of transcriptional repression, activation, and oncogenesis and may represent an attractive therapeutic target in cancer.


Conflict of interest statement

Conflict of interest

A.M.C. is a co-founder and SAB member of Compendia Biosciences which supports Oncomine and associated bioinformatics tools. A.M.C. serves on the SAB of Constellation Pharmaceuticals and serves as an advisor to Ventana/Roche and Glaxo Smith Kline. None of these companies were involved in these studies or approved of its content.

Figures

Figure 1
Figure 1. MMSET and EZH2 are coordinately overexpressed and associated with tumor progression across cancer types
(A) MMSET and EZH2 transcript expression levels are positively correlated across an RNA-seq (transcriptome) compendium of human tumors and cancer cell lines (n=474). The scatterplot displays the expression values in RPKM (Reads Per Kilobase per Million). (B) MMSET and EZH2 transcript expression across 22 microarray-based gene expression studies (n = 1,755) representing 15 tumor types. The histogram displays the correlation score within an individual study while bar shading indicates the number of samples used to calculate each correlation score. (C) MMSET and EZH2 transcript expression in multiple solid tumors based on Oncomine analysis. First author and statistical significance for respective studies are indicated. (D) qRT-PCR and (E) immunoblot analysis of MMSET and EZH2 transcripts and protein in a test cohort of benign prostate, clinically localized prostate cancer (PCA, and metastatic prostate cancer tissue (MET). Band intensity by densitometry is represented as a bar graph above the immunoblot. (F) Representative tissue microarray images depicting immunostaining pattern for MMSET and EZH2. Inset represents 40X magnifications. (G) Tissue microarray analysis of MMSET and EZH2 protein expression (left panel). Overall staining for each marker was measured by multiplying staining percentage (0–100%) by staining intensity on a numerical scale (none=1, weak=2, moderate=3, strong=4), resulting in an overall product score. Also see Table S1, S2, Figure S1.
Figure 2
Figure 2. EZH2 knockdown affects MMSET and its associated transcription activation mark H3K36me2
(A) Immunoblot analysis of histone marks affected by EZH2 knockdown in cancer cell lines. NT, non-targeting siRNA. Total histone H3 and β-Actin served as loading controls. (B) As in (A) except MMSET knockdown. (C) EZH2 depletion leads to diminished global transcription activation mark H3K36me2 as determined by genome-wide ChIP-seq analysis. Heatmap representation of ChIP-seq binding peaks for H3K36me2 in stable shvector control compared with shEZH2 MDA-MB-231 breast cancer cells. Genomic target regions are rank ordered based on the level of H3K36me2 enrichment at each gene displayed from −10kb to +10kb surrounding annotated transcription start sites. (D) Average TSS-aligned profiles of H3K36me2 occupancy is shown for all annotated genes in control and EZH2 knockdown cells. (E) Average H3K36me2 occupancy in the gene bodies is shown. Genes containing H3K36me2 in control and EZH2 knockdown were each divided in to 20 bins and the H3K36me2 ChIP-seq tags within each bin was counted and averaged. (F) DU145 cells treated with EZH2 specific lead inhibitor compounds (GSK-926A and GSK-343A) and inactive analogue (GSK-669A) for 4 days and the levels of EZH2, MMSET, H3K27me3, H3K36me2, and H3K79me3 along with H4K20me3 as control were examined by immunoblotting using total cell extracts. Total H3 and β-Actin were used as a loading control. Also see Figure S2.
Figure 3
Figure 3. EZH2 regulates MMSET expression coordinated by microRNAs
(A) EZH2 overexpression induces MMSET protein expression but not transcript expression in benign epithelial cells. Immunoblot analysis of MMSET and EZH2 in the primary prostate cells (PrEC) and benign breast cell lines H16N2 and MCF10A following transduction with vector control, EZH2, or EZH23SET mutant adenovirus. (B) Top, Schematic of two major isoforms of MMSET with different functional domains. MMSET I is a shorter isoform and MMSET II is a full length SET domain containing enzymatically active isoform. Bottom, Dicer knockdown enhances MMSET protein expression. Immunoblot analysis of Dicer and MMSET following knockdown of Dicer in PC3 cells (C) Venn diagram displaying miRs which are increased upon EZH2 knockdown (red circle) and miRs that are predicted to target the 3′UTR of MMSET by multiple algorithms (green circle). (D) Immunoblot analysis of MMSET in DU145 and PC3 prostate cancer cells transfected with 15 predicted MMSET 3′UTR targeting miRs. (E) microRNAs binding mutant 3′UTR of MMSET is resistant to EZH2 mediated regulation. Luciferase Reporter assays with MMSET wild-type or mutant 3′UTR co-transfected with either NT siRNA or siEZH2 in DU145 and PC3 cells. pEZX-MT01 without 3′UTR served as control. Luciferase activity was measured 48hr post transfection, normalized using Renilla luciferase activity and the results are plotted as mean ±SEM (n=6) percentage luciferase activity. (F) Stable knockdown of EZH2 reduces MMSET protein level with a concomitant increase in miR-203, miR-26a and miR-31 expression. Immunoblot analysis of MMSET, EZH2, and their respective histone methylation marks in 3 stable DU145-shEZH2 clones. Total H3 and β-Actin were used as loading controls. (G) TaqMan qRT-PCR analysis showing upregulation of miR-203, 26a and 31; expression was normalized using U6 small RNA in stable vector and EZH2 knockdown clones. (H) TaqMan qRT-PCR of miR-203 in DU145 and PC3 pools stably expressing miR-203. (I) Stable overexpression of miR-203 reduces MMSET but not EZH2 levels. Immunoblot analysis of MMSET, EZH2 and their respective histone methylation marks. Note the lack of change to shorter MMSET isoform upon miR-203 overexpression. Also see Figures S3.
Figure 4
Figure 4. MMSET expression is required for EZH2 mediated invasion and intravasation
(A) Knockdown of MMSET attenuates EZH2 mediated cell invasion. Cell invasion was carried out using a modified Boyden chamber assay. PrEC and H16N2 benign cells were transduced with EZH2 adenovirus with or without siRNA to MMSET. Representative images of invading cells (inset). (B) Immunoblot analysis using the protein lysates from A showing induction of MMSET upon EZH2 overexpression. (C) EZH2 induced cell invasion in vivo was attenuated with siRNA to MMSET. H16N2 cells transduced with adeno-vector control, adeno-EZH2 or adeno-EZH2/siMMSET and labeled with green fluorescent microspheres were cultured atop the embryonic chick CAM for 3 days. The upper CAM was harvested 3 days post-engraftment of the cells and frozen sections were stained for hematoxylin and eosin (left panels), human-specific cytokeratin (immunohistochemistry, middle panels) or chicken-specific collagen IV (red immunofluorescence, right panels). The basement membrane is represented by dotted line, yellow arrow-heads indicate blood vessels in mesenchymal CAM tissue and red arrow-heads indicate cells invading through the basement membrane. Representative images are shown with a 200 μm scale bar. (D) Genomic DNA isolated from the lower CAM from C was used to measure the intravasated human cells by qPCR using human-specific Alu primers. Mean cell number ±SEM from 8 eggs per group shown, with * and ** indicates p=0.02 or p=0.03, Student’s t-test. Also see Figure S4.
Figure 5
Figure 5. MMSET overexpression promotes cell proliferation, self-renewal and cell invasive phenotype
(A) Immunoblot analysis of MMSET, EZH2 and different histone methylation marks in stable MMSET knockdown cells. (B–D) MMSET knockdown in DU145 and PC3 cells exhibit reduced cell proliferation (B), reduced cell migration as assessed by wound healing assay (C), and reduced cell invasion as monitored by Matrigel invasion assay (D) with representative images of invaded cells shown in the inset. (E) Prostatosphere formation by DU145 cells is decreased by transient or stable knockdown of MMSET. Cells transfected with siEZH2 were used as a positive control. Representative images of prostatospheres formed by control or MMSET knockdown cells are shown. (F) Overexpression of MMSET but not its SET domain mutant specifically induces H3K36me2 in HME and H16N2 benign epithelial cells. LacZ overexpression was used a control. (G, H) MMSET overexpression induces increased cell proliferation and cell invasion respectively in HME or H16N2 cells. Mean ± SD shown with *p<0.01 (Student’s t-test) for all experiments. (I) Gene ontology analysis of MMSET overexpression and knockdown microarray data using the DAVID program. Red bars represent the top significant hits for upregulated genes. Green bars represent the top hits for downregulated genes. DAVID enrichment scores are plotted with P values. Also see Figure S5.
Figure 6
Figure 6. MMSET knockdown attenuates tumorigenesis in vivo.
(A) MMSET knockdown attenuates basement membrane invasion in a chicken CAM model. DU145 cells expressing GFP shvector control or shMMSET were engrafted atop the CAM of 11-day-old chick embryo and cultured for 3 days. Representative H&E, IHC with human specific cytokeratin, and immunofluorescence (IF) micrographs of CAM cross-sections showing DU145 cells (green) crossing the basement membrane (arrows). Red, chicken collagen IV; blue, DAPI staining for cell nuclei; arrows, basement membrane; red and white arrowheads, invaded cells; yellow arrowheads, blood vessels in CAM tissue. Scale bar (100 μm). (B) MMSET knockdown reduces cancer cell intravasation. Genomic DNA from lower CAM was isolated 3 days post-engraftment and number of intravasated cells was measured by human Alu-qPCR. (C) MMSET knockdown attenuates distant metastasis. Control or MMSET knockdown pool or single clone cells were inoculated atop CAM of 11-day-old chick embryos. Genomic DNA from lungs was extracted seven days post-inoculation and analyzed by human Alu-qPCR. Bar graph represents average cell number with ±SEM from N=7 per group. (D) MMSET knockdown attenuates DU145 tumor growth in mice. N=7 mice per group were injected subcutaneously. (E) MMSET knockdown reduces spontaneous metastasis in mouse xenograft model. Various organs and bone marrow cells were isolated from the DU145 xenografted mice after 5 weeks. Genomic DNA isolated from these organs was analyzed for metastasized cells by human Alu-qPCR. (F) Increased xenograft growth in vivo in CAM assay by HME and H16N2 cells overexpressing MMSET.*p<0.05, Student’s t-test. (G) Proposed model for the EZH2-MMSET histone methyltransferase axis in cancer. Red and green arrows indicate upregulation and downregulation respectively. Also see Figure S6.

References

    1. Albert M, Helin K. Histone methyltransferases in cancer. Semin Cell Dev Biol. 2010;21:209–220. - PubMed
    1. Bachmann IM, Halvorsen OJ, Collett K, Stefansson IM, Straume O, Haukaas SA, Salvesen HB, Otte AP, Akslen LA. EZH2 expression is associated with high proliferation rate and aggressive tumor subgroups in cutaneous melanoma and cancers of the endometrium, prostate, and breast. J Clin Oncol. 2006;24:268–273. - PubMed
    1. Baylin SB, Jones PA. A decade of exploring the cancer epigenome-biological and translational implications. Nat Rev Cancer. 2011;11:726–734. - PMC - PubMed
    1. Berezovska OP, Glinskii AB, Yang Z, Li XM, Hoffman RM, Glinsky GV. Essential role for activation of the Polycomb group (PcG) protein chromatin silencing pathway in metastatic prostate cancer. Cell Cycle. 2006;5:1886–1901. - PubMed
    1. Bracken AP, Kleine-Kohlbrecher D, Dietrich N, Pasini D, Gargiulo G, Beekman C, Theilgaard-Monch K, Minucci S, Porse BT, Marine JC, et al. The Polycomb group proteins bind throughout the INK4A-ARF locus and are disassociated in senescent cells. Genes Dev. 2007;21:525–530. - PMC - PubMed

Publication types

MeSH terms

Associated data