. 2012 Dec;18(12):1841-6.
doi: 10.1038/nm.2995. Epub 2012 Nov 18.

Multifunctional in vivo vascular imaging using near-infrared II fluorescence

Affiliations

Multifunctional in vivo vascular imaging using near-infrared II fluorescence

Guosong Hong et al. Nat Med. 2012 Dec.

Abstract

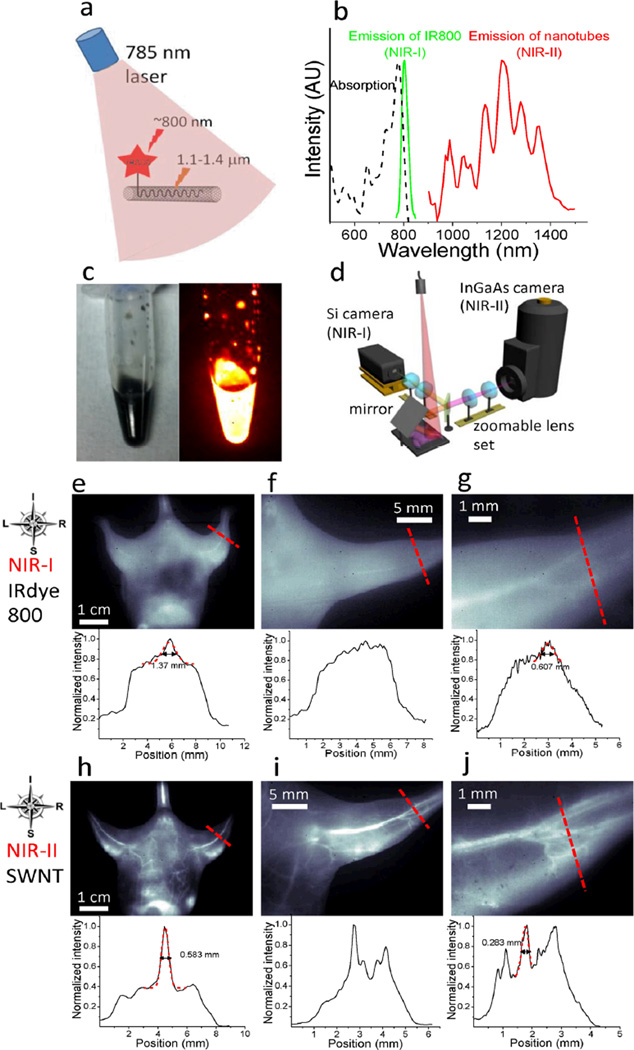
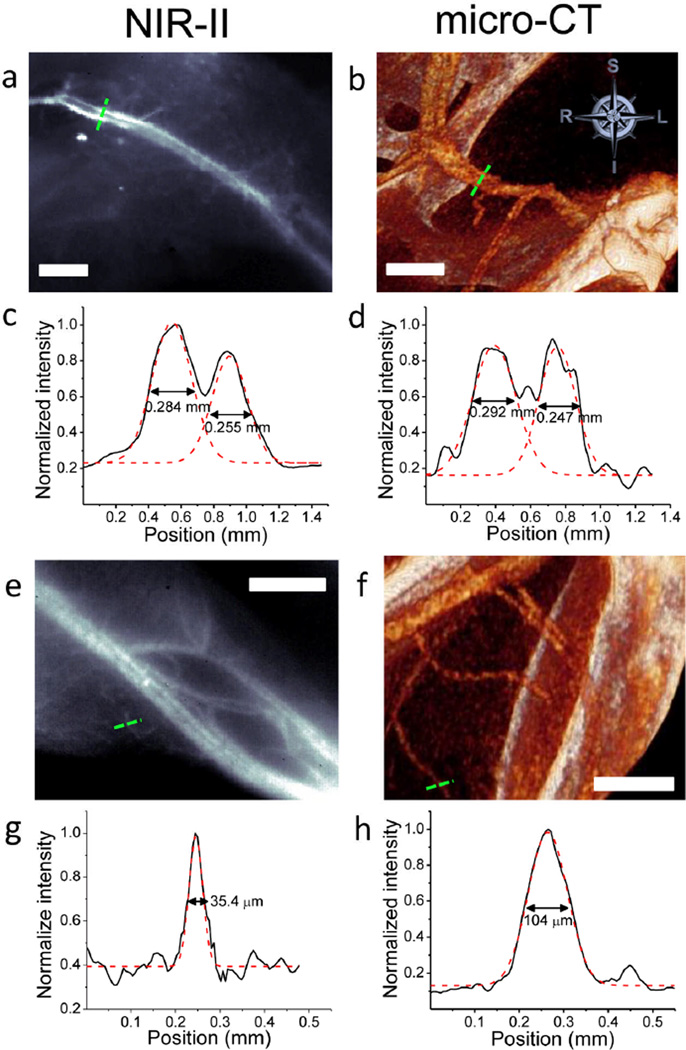
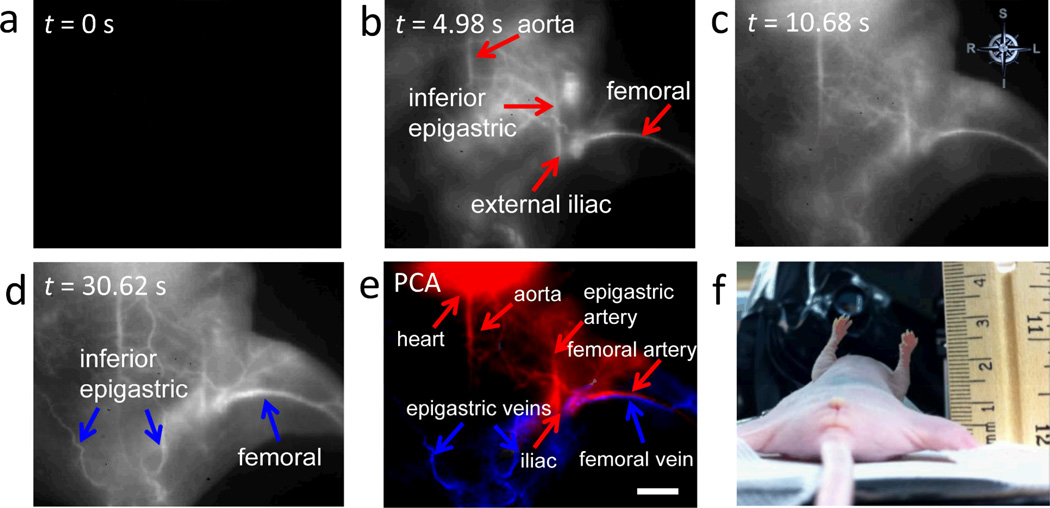
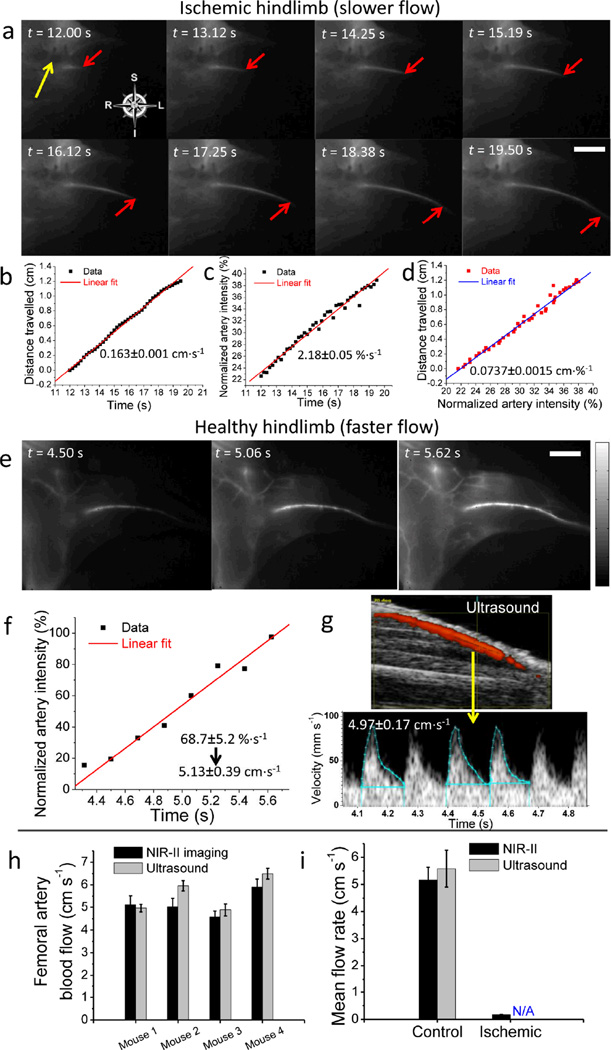
In vivo real-time epifluorescence imaging of mouse hind limb vasculatures in the second near-infrared region (NIR-II) is performed using single-walled carbon nanotubes as fluorophores. Both high spatial (∼30 μm) and temporal (<200 ms per frame) resolution for small-vessel imaging are achieved at 1-3 mm deep in the hind limb owing to the beneficial NIR-II optical window that affords deep anatomical penetration and low scattering. This spatial resolution is unattainable by traditional NIR imaging (NIR-I) or microscopic computed tomography, and the temporal resolution far exceeds scanning microscopic imaging techniques. Arterial and venous vessels are unambiguously differentiated using a dynamic contrast-enhanced NIR-II imaging technique on the basis of their distinct hemodynamics. Further, the deep tissue penetration and high spatial and temporal resolution of NIR-II imaging allow for precise quantifications of blood velocity in both normal and ischemic femoral arteries, which are beyond the capabilities of ultrasonography at lower blood velocities.


Figures

Figure 1
Figure 1
NIR-I and NIR-II fluorescence imaging of blood vessels in the mouse. (a) A schematic showing that upon excitation of a 785 nm laser, the SWNT-IRDye-800 conjugate emits at the ~800 nm NIR-I region from IRDye-800 dye and the 1.1–1.4 µm NIR-II region from the SWNT backbone. (b) Absorption spectrum of the SWNT-IRDye-800 conjugate (black dashed curve), emission spectrum of IRDye-800 dye (green solid curve) and SWNTs (red solid curve). (c) A digital camera photograph (left) and an NIR-II fluorescence image of injected solution containing 0.10 mg·ml−1 SWNT-IRDye-800 conjugates. (d) Schematic of the imaging setup for simultaneous detection of both NIR-I and NIR-II photons using Si and InGaAs cameras. A zoomable lens set was used for adjustable magnifications. (e–g) NIR-I fluorescence images (top) and cross-sectional fluorescence intensity profiles (bottom) along red-dashed bars of a mouse injected with the SWNT-IRDye-800 conjugates. Gaussian fits to the profiles are shown in red dashed curves. (h–j) NIR-II fluorescence images (top) and cross-sectional fluorescence intensity profiles (bottom) along red-dashed bars of a mouse injected with the SWNT-IRDye-800 conjugates. Gaussian fits to the profiles are shown in red dashed curves.
Figure 2
Figure 2
NIR-II fluorescence and micro-CT imaging of hindlimb blood vessels. (a) A NIR-II SWNT fluorescence image of a mouse thigh. (b) A micro-CT image showing the same area of the thigh as in a. (c) A cross-sectional fluorescence intensity profile measured along the green dashed bar in a with its two peaks fitted to Gaussian functions. (d) A cross-sectional intensity profile measured along the green dashed bar in b with its two peaks fitted to Gaussian functions. (e) An NIR-II image at the level of the gastrocnemius. (f) A micro-CT image showing the same area of the limb as in e. (g) A cross-sectional fluorescence intensity profile measured along the green dashed bar in e with its peak fitted to a Gaussian function. (h) A cross-sectional intensity profile measured along the green dashed bar in f with its peak fitted to a Gaussian function. All scale bars indicate 2 mm.
Figure 3
Figure 3
Differentiation of femoral artery from vein in normal and ischemic mice by NIR-II imaging. (a–c) Time course NIR-II fluorescence images of hindlimb blood flow in a control healthy animal. (d) PCA overlaid image based on the first 200 frames (37.5 s post injection) of the control animal, where arteries are color-coded in red, while veins are color-coded in blue. (e–g) Time course NIR-II fluorescence images of hindlimb blood flow in an ischemic animal. (h) PCA overlaid image based on the first 200 frames (37.5 s post injection) of the ischemic animal; only arterial vessels (color-coded in red) can be seen. The level of the experimentally induced arterial occlusion is indicated by the yellow arrow. All scale bars indicate 2 mm.
Figure 4
Figure 4
Differentiation of multiple arterial and venous vessels subserving a larger region of tissue. (a–d) Time course NIR-II fluorescence images showing blood flow labeled by SWNT fluorescent tags. (e) PCA overlaid image based on the first 170 frames (31.875 s post injection) of the mouse, where arterial vessels are shown in red, while venous vessels are shown in blue. The scale bar indicates 5 mm. (f) A digital camera photograph of the mouse imaged in supine position beside a ruler.
Figure 5
Figure 5
Femoral artery blood velocity quantification for an ischemic hindlimb and a healthy, control hindlimb by NIR-II imaging and ultrasound. (a) Time course NIR-II images showing the flow front (marked by a red arrow) in the hindlimb of an ischemic mouse, Mouse I1. The yellow arrow indicates the arterial occlusion. (b) Distance travelled by the flow front versus time. (c) Normalized NIR-II signal in the femoral artery versus time. (d) Linear correlation between the artery blood velocity and NIR-II fluorescence increase in femoral artery. (e) Time course NIR-II fluorescence images showing the NIR-II intensity increase in the femoral artery of a control mouse, Mouse C1. (f) Normalized NIR-II signal in the femoral artery versus time. (g) Ultrasound measurement of femoral artery blood velocity in Mouse C1 (top) based on integration of three outlined pulses (bottom). (h) Side-by-side comparison of femoral artery velocity obtained from NIR-II method (black) and ultrasonography (gray) for four control healthy mice. Black error bars were based on linear-fitting errors of NIR-II intensity increase plot, while gray error bars reflected the s.d. of three integrated pulses from ultrasonography. (i) Average femoral artery blood velocity of control group (n=4) and ischemic group (n=3), measured by NIR-II method (black) and ultrasound technique (gray). The ischemic blood velocity was not measurable by ultrasonography (shown as ‘N/A’). Errors bars reflect the s.d. of each group. Scale bars in a and e indicate 5 mm, and the intensity scale bar ranges from 0 to 1 for normalized NIR-II fluorescence intensity.

References

    1. O'Leary DH, et al. Carotid-artery intima and media thickness as a risk factor for myocardial infarction and stroke in older adults. New Engl. J. Med. 1999;340:14–22. - PubMed
    1. Saba L, Sanfilippo R, Montisci R, Mallarini G. Carotid artery wall thickness: comparison between sonography and multi-detector row CT angiography. Neuroradiology. 2010;52:75–82. - PubMed
    1. Toussaint JF, LaMuraglia GM, Southern JF, Fuster V, Kantor HL. Magnetic resonance images lipid, fibrous, calcified, hemorrhagic, and thrombotic components of human atherosclerosis in vivo. Circulation. 1996;94:932–938. - PubMed
    1. Greco A, et al. Ultrasound Biomicroscopy in Small Animal Research: Applications in Molecular and Preclinical Imaging. J. Biomed. Biotechnol. 2012 2012. - PMC - PubMed
    1. Gordon R, Herman GT. 3-Dimensional Reconstruction from Projections - Review of Algorithms. Int. Rev. Cytol. 1974;38:111–151. - PubMed

References for Methods

    1. Tabakman SM, Welsher K, Hong GS, Dai HJ. Optical Properties of Single-Walled Carbon Nanotubes Separated in a Density Gradient: Length, Bundling, and Aromatic Stacking Effects. J. Phys. Chem. C. 2010;114:19569–19575. - PMC - PubMed
    1. Liu Z, Tabakman SM, Chen Z, Dai H. Preparation of carbon nanotube bioconjugates for biomedical applications. Nat. Protoc. 2009;4:1372–1382. - PMC - PubMed
    1. Niiyama H, Huang NF, Rollins MD, Cooke JP. Murine model of hindlimb ischemia. J. Vis. Exp. 2009 - PMC - PubMed
    1. Matthes R, et al. Revision of guidelines on limits of exposure to laser radiation of wavelengths between 400 nm and 1.4 µm. Health Phys. 2000;79:431–440. - PubMed

Publication types

Substances