. 2012 Dec;18(12):1797-804.
doi: 10.1038/nm.2996. Epub 2012 Nov 18.

Abnormal development of NG2+PDGFR-α+ neural progenitor cells leads to neonatal hydrocephalus in a ciliopathy mouse model

Affiliations

Abnormal development of NG2+PDGFR-α+ neural progenitor cells leads to neonatal hydrocephalus in a ciliopathy mouse model

Calvin S Carter et al. Nat Med. 2012 Dec.

Abstract

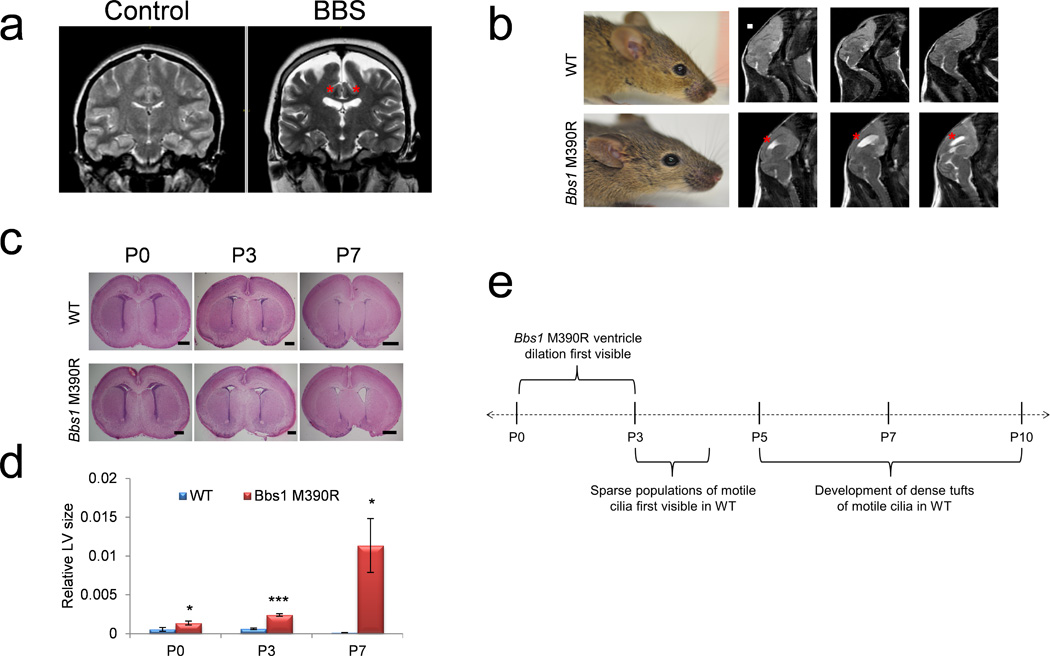
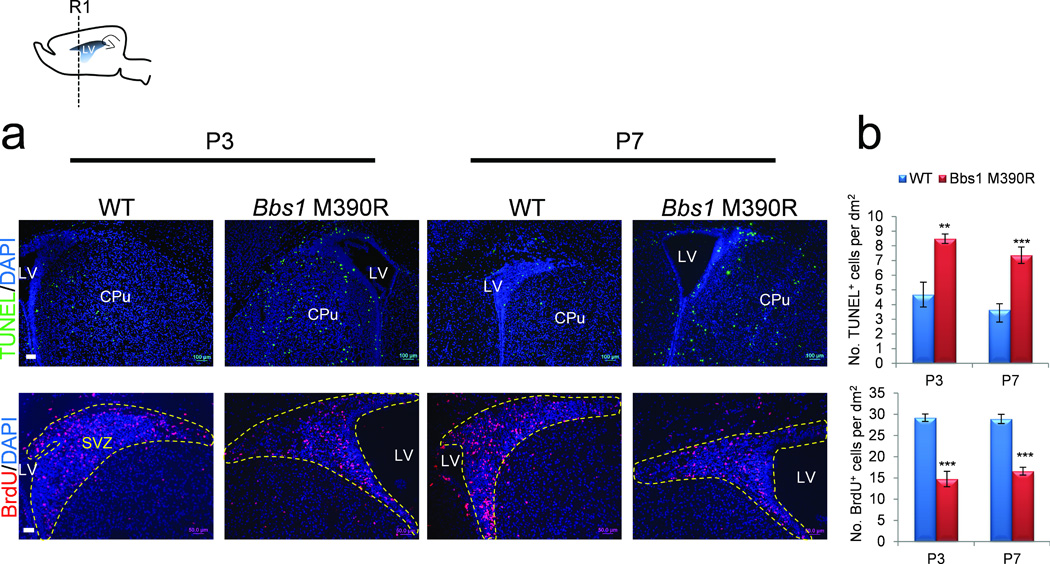
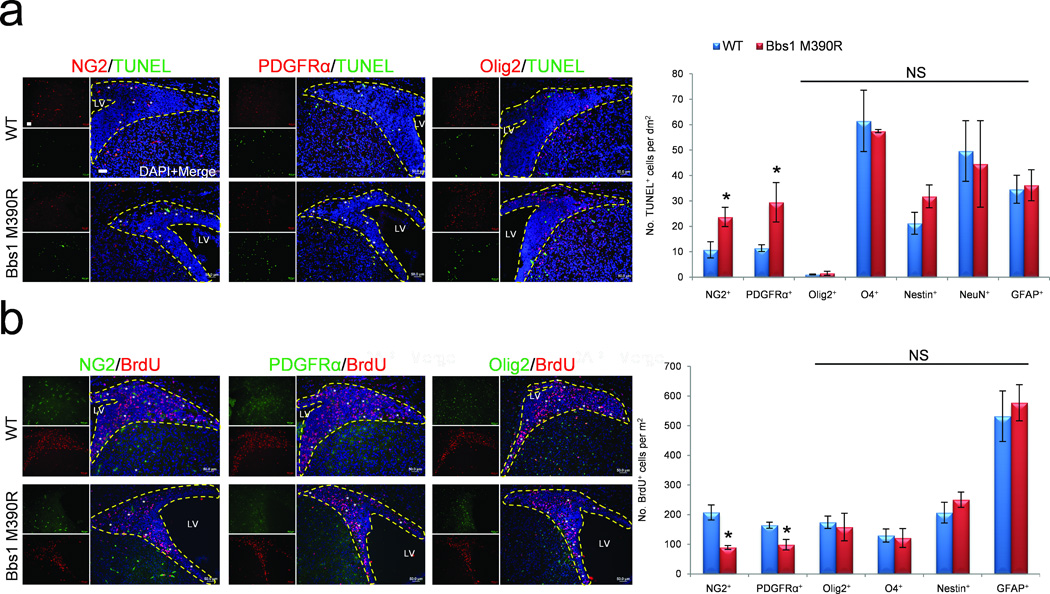
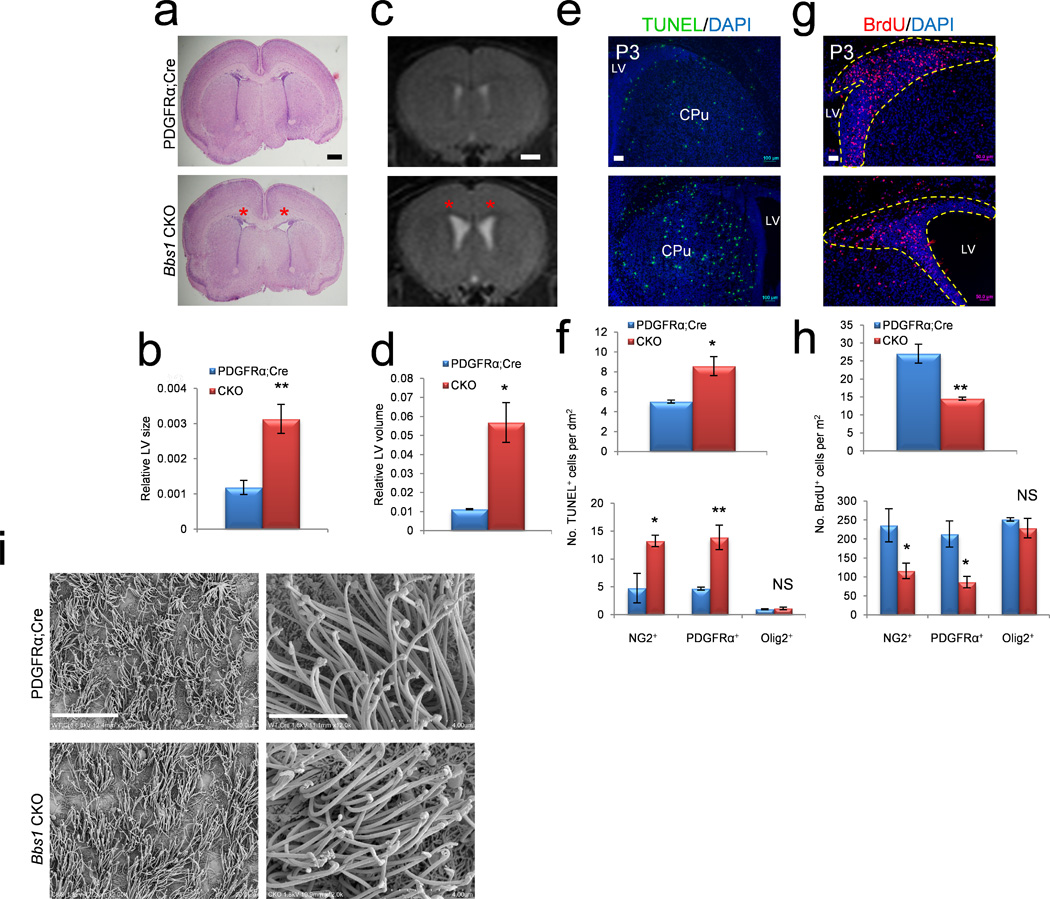
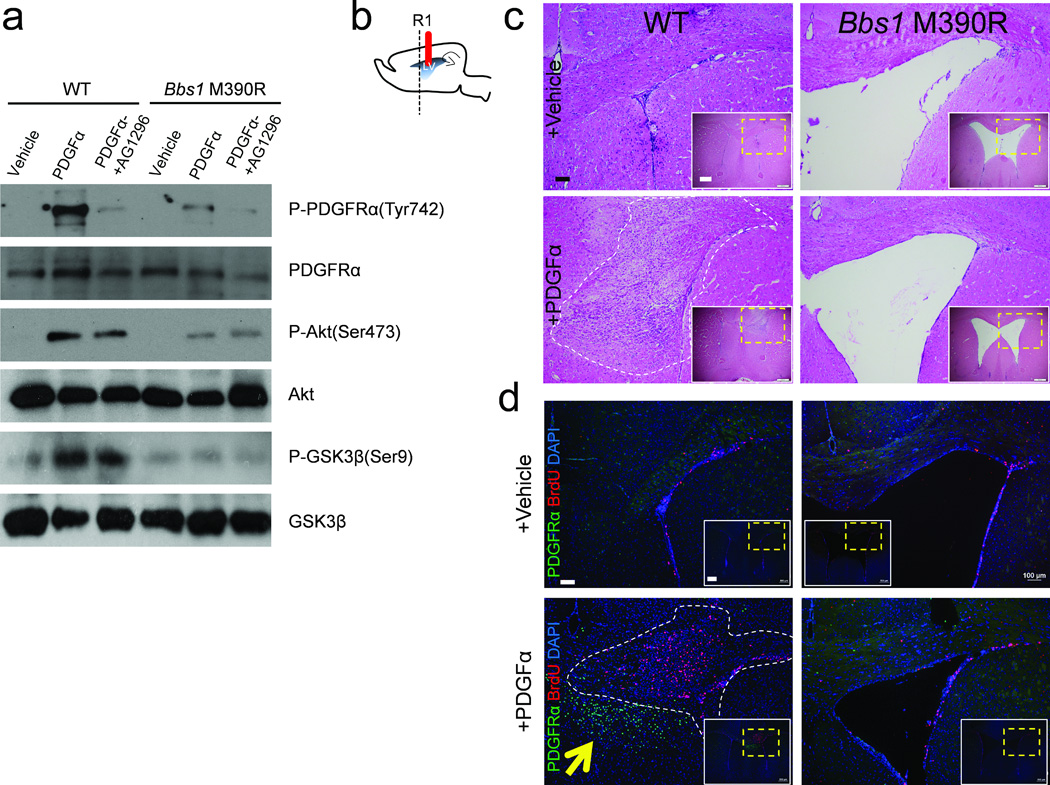
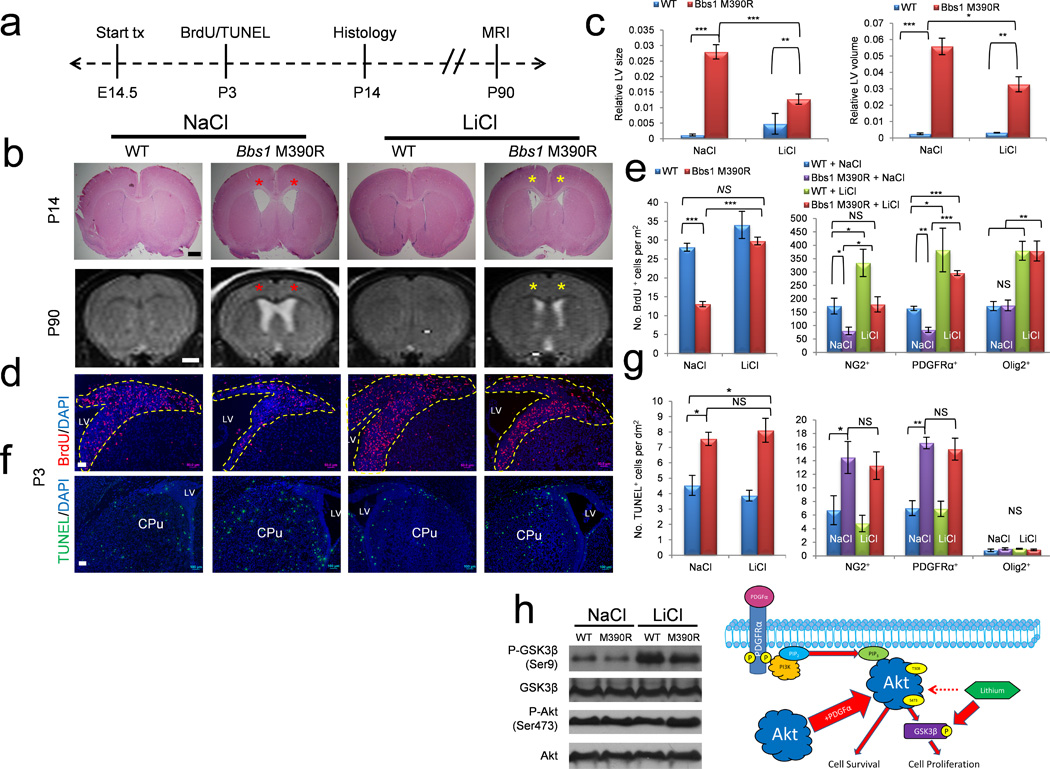
Hydrocephalus is a common neurological disorder that leads to expansion of the cerebral ventricles and is associated with a high rate of morbidity and mortality. Most neonatal cases are of unknown etiology and are likely to have complex inheritance involving multiple genes and environmental factors. Identifying molecular mechanisms for neonatal hydrocephalus and developing noninvasive treatment modalities are high priorities. Here we use a hydrocephalic mouse model of the human ciliopathy Bardet-Biedl Syndrome (BBS) and identify a role for neural progenitors in the pathogenesis of neonatal hydrocephalus. We found that hydrocephalus in this mouse model is caused by aberrant platelet-derived growth factor receptor α (PDGFR-α) signaling, resulting in increased apoptosis and impaired proliferation of chondroitin sulfate proteoglycan 4 (also known as neuron-glial antigen 2 or NG2)(+)PDGFR-α(+) neural progenitors. Targeting this pathway with lithium treatment rescued NG2(+)PDGFR-α(+) progenitor cell proliferation in BBS mutant mice, reducing their ventricular volume. Our findings demonstrate that neural progenitors are crucial in the pathogenesis of neonatal hydrocephalus, and we identify new therapeutic targets for this common neurological disorder.


Figures

Figure 1
Figure 1
Hydrocephalus in BBS mutant mice occurs before motile cilia develop. (a) T2-weighted coronal MRIs of a Bardet-Biedl syndrome patient and age and sex matched control showing ventriculomegaly of the lateral ventricles (red asterisks). (b) Left, picture of 3 month old WT and Bbs1M390R/M390R mice showing a normal cranial vault in WT and Bbs1M390R/M390R. Right, T2-weighted sagittal MRIs showing hydrocephalus of the lateral ventricles (red asterisks) in a Bbs1M390R/M390R mouse. (c) Histology of WT and Bbs1M390R/M390R neonates showing perinatal onset of hydrocephalus in mutant pups and (d) the quantitations showing ventricular dilation at P3 and P7. (e) Timeline of the genesis of hydrocephalus in BBS mutant mice relative to motile cilia development showing that Bbs1M390R/M390R mice develop hydrocephalus prior to the development of motile cilia,. All error bars represent means ± s.e.m. *P<0.05, ***P<0.0005, results from unpaired t tests. All experiments utilized at least 3 mice per group and genotype. Scale bars equal 1 mm (b) and 500 µm (P0 and P3) and 1 mm (P7, c). E, embryonic day; LV, lateral ventricle; P, postnatal day.
Figure 2
Figure 2
Increased apoptosis and reduced proliferation in the brains of Bbs1M390R/M390R mice. Top left, cartoon depicting the sagittal section of a mouse brain showing the region of subsequent analyses (R1). (a) Representative immunofluorescent images and (b) the quantitation of cells labeled with TUNEL (top row) or BrdU (bottom row) per area in P3 and P7 WT and Bbs1M390R/M390R brains in at least 3 mice per group and genotype (dotted yellow line outlines SVZ). All error bars represent means ± s.e.m. *P<0.05, **P<0.005, ***P<0.0005, results from unpaired t tests. Scale bars equal 100 µm (a, top) and 50 µm (bottom). CPu, caudate putamen; LV, lateral ventricle; NS, not significant; P, postnatal day; SVZ, subventricular zone.
Figure 3
Figure 3
Abnormal development of NG2+PDGFRα+ neural progenitor cells in Bbs1M390R/M390R mice. (a,b) Representative immunofluorescent images showing TUNEL (a) and BrdU (b) labeled cells also expressing NG2, PDGFRα or Olig2 plus the quantitations (a,b, right). At least 3 mice per group and genotype were analyzed. All dotted yellow lines outline the SVZ. All error bars represent means ± s.e.m. *P<0.05, results from unpaired t tests. Scale bars equal 50 µm. CPu, caudate putamen; LV, lateral ventricle; NS, not significant; P, postnatal day; SVZ, subventricular zone.
Figure 4
Figure 4
Conditional knockout of Bbs1 in NG2+PDGFRα+ progenitors causes neonatal hydrocephalus. (a,b) Representative histology of P3 PDGFRαCre (control) (n=3) and Bbs1CKO (n=3) pups and the quantitations showing dilated lateral ventricles of Bbs1CKO mice (red asterisks). (c,d) Representative T2-weighted MRIs of 3 month old PDGFRαCre (n=3) and Bbs1CKO (n=3) mice and the quantitations showing dilated ventricles in Bbs1CKO mice (red asterisks). (e–h) Representative immunofluorescent images and the quantitations of cells labeled with TUNEL (e,f) or BrdU (g,h) per area in P3 PDGFRαCre (n=3) and Bbs1CKO (n=3) brains (yellow dotted line outlines SVZ). (f,h, bottom) Quantifications of TUNEL (f, bottom) and BrdU (h, bottom) labeled cells that also express NG2, PDGFRα or Olig2 (at least 3 mice per group and genotype). (i) Scanning electron micrographs of the lateral wall of the lateral ventricles in PDGFRαCre and Bbs1CKO mice at low (left) and high (right) magnification. All error bars represent means ± s.e.m. *P<0.05, **P<0.005, ***P<0.0005, results from unpaired t tests. Scale bars equal 500 µm (a), 1 mm (c), 100 µm (e), 50 µm (g), 20 µm (left) and 4 µm (right, i). CPu, caudate putamen; CKO, conditional knockout; LV, lateral ventricle; NS, not significant; P, postnatal day; SVZ, subventricular zone.
Figure 5
Figure 5
PDGFRα signaling is impaired in BBS. (a) PDGFα stimulation activates downstream signaling in primary oligodendrocytic precursor cells derived from WT but not Bbs1M390R/M390R brains. (b) Cartoon depicting the sagittal section of a mouse brain showing the cannula implantation site (solid red line) and the region of subsequent analyses (R1). (c) Representative histology of the ipsilateral brain hemisphere of vehicle infused WT (n=7) and Bbs1 KI (n=7); and PDGFα infused WT (n=7) and Bbs1M390R/M390R (n=7) mice (bottom). White panels show a low magnification image with the region of interest outlined by the yellow dotted line. (d) Representative immunofluorescent images of the ipsilateral infused hemisphere showing cells labeled with BrdU and PDGFRα in vehicle infused WT (n=3) and Bbs1M390R/M390R (n=3); and PDGFα infused WT (n=3) and Bbs1M390R/M390R (n=3) mice. The yellow arrow highlights the hyperplastic nodule consisting of PDGFRα+ cells and the white dotted line outlines the hyperplastic nodules observed in PDGFα infused WT mice. Scale bars equal 100 µm (larger image) and 500 µm (c, inset) and 100 µm (larger image) and 500 µm (d, inset).
Figure 6
Figure 6
Lithium therapy rescues cell proliferation and hydrocephalus in Bbs1M390R/M390R mice. (a) Overview of the experimental timeframe. (b) Top row, representative histology plus quantitation (c, left) and representative MRI scans (bottom row) plus quantitation (c, right) of NaCl and LiCl treated WT and Bbs1M390R/M390R mice. Red asterisks highlight dilated lateral ventricles and yellow asterisks highlight reduced ventricle size following LiCl treatment in Bbs1M390R/M390R mice. (d,e) Representative immunofluorescent images of BrdU labeled cells in NaCl and LiCl treated mice (d) and quantitations (e, left). (e) Right, quantitation of BrdU labeled cells that also express NG2, PDGFRα or Olig2. (f,g) Representative immunofluorescent images (f) and quantitation (g, left) of TUNEL labeled cells in NaCl and LiCl treated mice. (g) Right, quantitation of TUNEL labeled cells expressing NG2, PDGFRα or Olig2. (h) Left, representative western blots of cortices from P3 NaCl and LiCl treated WT and Bbs1M390R/M390R mice. Right, drawing depicting the proposed mechanism of lithium’s effect on cell proliferation in treated WT and Bbs1M390R/M390R mice. Lithium increases phosphorylation of GSK3β leading to an increase in cell proliferation. We found no effect on the phosphorylation of AKT in contrast to previously reported results. Error bars represent means ± s.e.m. *P<0.05, **P<0.005, ***P<0.0005, results from unpaired t tests. All experiments utilized ≥ 3 mice per group and genotype. Scale bars equal 500 µm (top, b) and 1 mm (bottom, b), 50 µm (d) and 100 µm (f). CPu, caudate putamen; E, embryonic day; LV, lateral ventricle; NS, not significant; P, postnatal day; SVZ, subventricular zone.

Comment in

References

    1. Bruni JE, Del Bigio MR, Clattenburg RE. Ependyma: Normal and pathological. A review of the literature. Brain Research Reviews. 1985;9:1–19. - PubMed
    1. Del Bigio M. Ependymal cells: biology and pathology. Acta Neuropathologica. 2010;119:55–73. - PubMed
    1. Williams MA, et al. Priorities for hydrocephalus research: report from a National Institutes of Health–sponsored workshop. Journal of Neurosurgery: Pediatrics. 2007;107:345–357. - PubMed
    1. Vogel P, et al. Congenital Hydrocephalus in Genetically Engineered Mice. Veterinary Pathology Online. 2012;49:166–181. - PubMed
    1. Simon TD, et al. Hospital care for children with hydrocephalus in the United States: utilization, charges, comorbidities, and deaths. Journal of Neurosurgery: Pediatrics. 2008;1:131–137. - PubMed

Publication types

MeSH terms