. 2013 Oct 10;32(41):4932-40.
doi: 10.1038/onc.2012.512. Epub 2012 Nov 19.

Regulation of autophagy during ECM detachment is linked to a selective inhibition of mTORC1 by PERK

Affiliations

Regulation of autophagy during ECM detachment is linked to a selective inhibition of mTORC1 by PERK

A Avivar-Valderas et al. Oncogene. .

Abstract

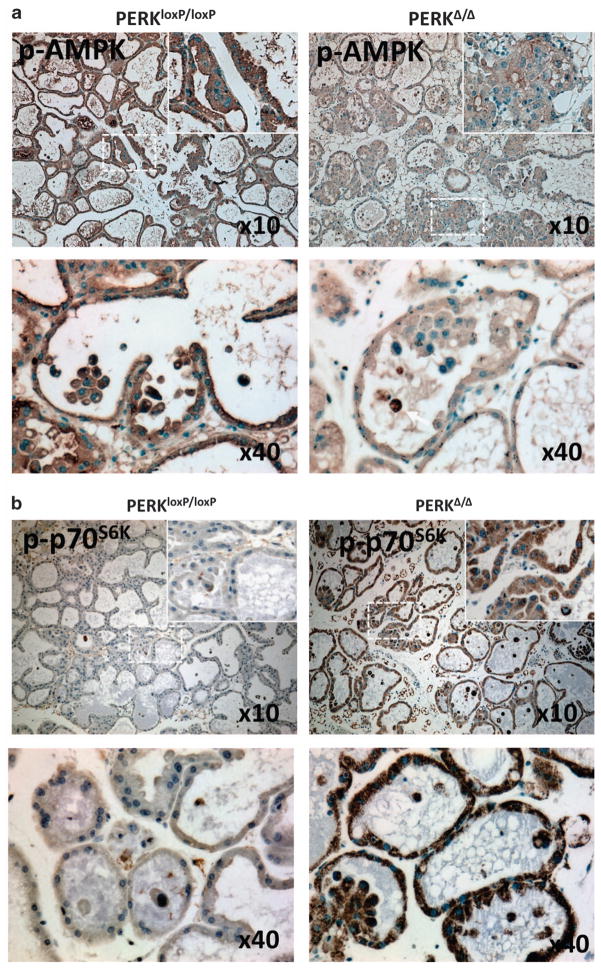
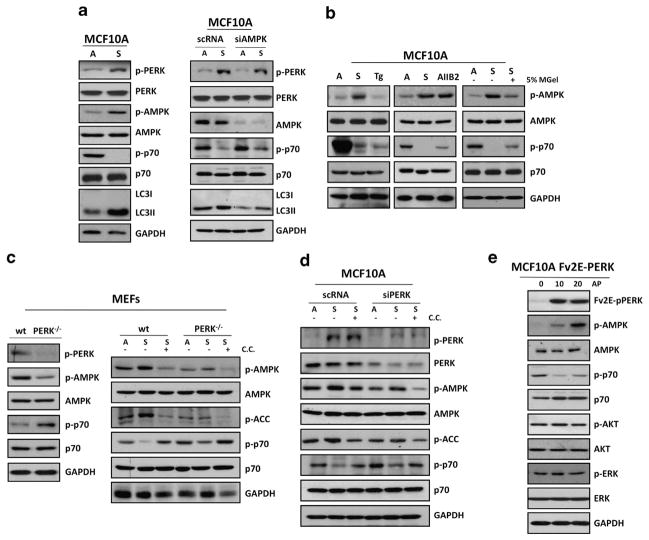
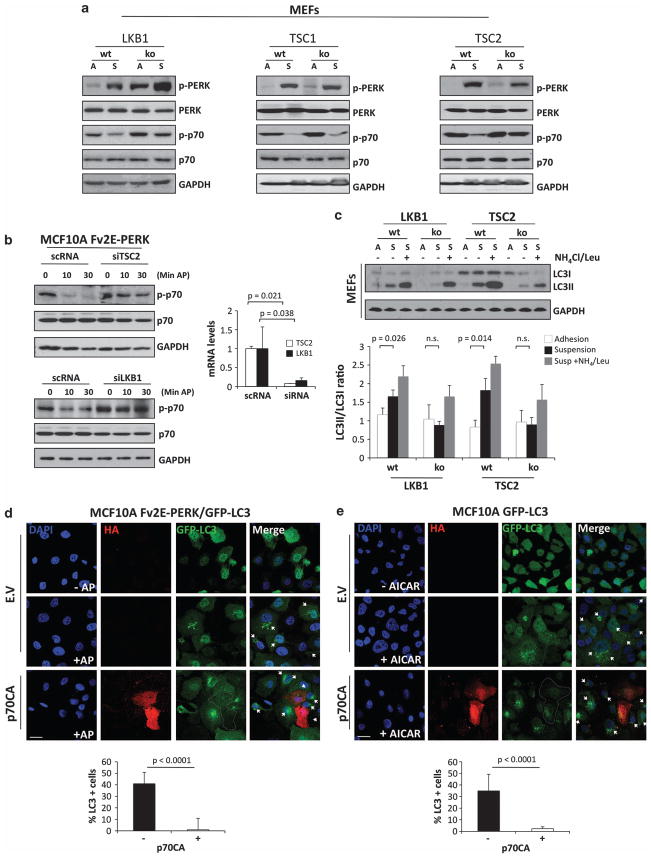
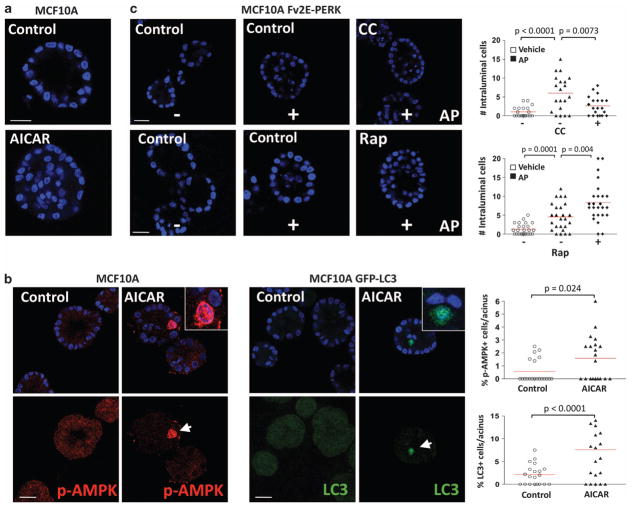
Adhesion to the extracellular matrix (ECM) is critical for epithelial tissue homeostasis and function. ECM detachment induces metabolic stress and programmed cell death via anoikis. ECM-detached mammary epithelial cells are able to rapidly activate autophagy allowing for survival and an opportunity for re-attachment. However, the mechanisms controlling detachment-induced autophagy remain unclear. Here we uncover that the kinase PERK rapidly promotes autophagy in ECM-detached cells by activating AMP-activated protein kinase (AMPK), resulting in downstream inhibition of mTORC1-p70(S6K) signaling. LKB1 and TSC2, but not TSC1, are required for PERK-mediated inhibition of mammalian target of rapamycinin MCF10A cells and mouse embryo fibroblast cells. Importantly, this pathway shows fast kinetics, is transcription-independent and is exclusively activated during ECM detachment, but not by canonical endoplasmic reticulum stressors. Moreover, enforced PERK or AMPK activation upregulates autophagy and causes luminal filling during acinar morphogenesis by perpetuating a population of surviving autophagic luminal cells that resist anoikis. Hence, we identify a novel pathway in which suspension-activated PERK promotes the activation of LKB1, AMPK and TSC2, leading to the rapid induction of detachment-induced autophagy. We propose that increased autophagy, secondary to persistent PERK and LKB1-AMPK signaling, can robustly protect cells from anoikis and promote luminal filling during early carcinoma progression.


Conflict of interest statement

CONFLICT OF INTEREST

The authors declare no conflict of interest.

Figures

Figure 1
Figure 1
PERK negatively regulates mTOR signaling in lactating mammary glands. (a, b) Immunohistochemical detection of p-AMPK and p-p70S6K on day 12 lactating mammary glands sections from control PERKloxP/loxP and mammary gland-specific PERK ko mice (PERKΔ/Δ). (a) Images showing enhanced p-AMPK staining in the control tissues along with strong staining in luminal cells and cell clusters (lower panels) that is reduced in PERKΔ/Δ tissues. (b) Images showing reduced p-p70S6K staining in PERKloxP/loxP control tissues in comparison with PERKΔ/Δ tissues.
Figure 2
Figure 2
Adhesion to the ECM prevents PERK-mediated inhibition of mTORC1 signaling via AMPK activation. (a) MCF10A cells grown attached (A) or suspended for 12 h (S; left panel) and transfected with AMPK or control (scRNA) siRNAs (right panel) were lysed and immunoblotted (IB) with indicated antibodies (Abs). (b) Lysates from MCF10A were cultured in attached (A) or suspended (S) conditions or treated with 10 μM thapsigargin (Tg), 10 μg/ml AIIB2 or 5% matrigel (MGel) and IB with the indicated Abs. (c) Lysates of PERK +/+ and PERK −/− MEFs were collected from attached (left panel) and attached (A) and suspended (S) conditions (right panel), treated with or without 10 μM compound C (C.C.) as indicated and IB against the indicated antigens. (d) MCF10A lysates from attached (A) and in suspended (S) cells that were transfected with PERK or control (scRNA) siRNAs were treated with or without 10 μM CC as indicated and IB against the indicated antigens. (e) Adherent Fv2E-ΔNPERK MCF10A treated with or without 100 pM AP were collected at the indicated time points (minutes) and analyzed by IB with the indicated Abs.
Figure 3
Figure 3
LKB1 and TSC2, but not TSC1, are required for suspension-induced inhibition of mTORC1 signaling. (a) Lysates of LKB1 +/+, LKB1 −/− and TSC2 +/+, LKB1 −/− MEFs were collected from attached (A) and suspended (S) conditions, and immunoblotted (IB) against the indicated antigens. (b) MFC10A Fv2E-PERK cells were transfected with TSC2 (upper panel), LKB1 (lower panel) siRNAs or scramble control (scRNA), and treated with or without 100 pM AP at the indicated time points (min) and IB against the indicated antibodies (Abs). Right graphs show TSC2 and LKB1 knocking down controls by mRNA transcript level analysis normalized to glyceraldehyde 3-phosphate dehydrogenase (GAPDH). (c) Adhered (A) or suspended (S) LKB1+/+, LKB1−/− and TSC2+/+, LKB1−/− MEFs were treated with 0.1 Leupeptin and 20 mM NH4 as indicated and analyzed by IB for the indicated antigens. Densitometric analysis for LC3 flux was determined using Image J software (N = 3). (d, e) Images showing adhered Fv2E-PERK/GFP-LC3 (d) or GFP-LC3 (e) MCF10A cells transfected with empty vector (EV) or p70S6K mutant Δ2-46 ΔCT104 (p70CA) for 48 h and treated with or without AP (d) or AICAR (e) for 4 h. After that, cells were fixed and stained with anti-HA antibodies for p70CA expression. Lower graphs, percentage of LC3-positive (five or more puncta/cell) cells were scored (n = 50) and plotted in the p70CA- and EV- (see Supplementary Figure 1F) transfected cells. Scale bars indicate 10 μm. P-values were determined by the Student’s t-test.
Figure 4
Figure 4
Impact of modulating AMPK activity on luminal filling in 3D culture. (a) Representative confocal images of day 12 MCF10A acini, treated from day 6 to day 12 with 10 μM AICAR showing intraluminal cell accumulation. Scale bars indicate 10 μm. (b) Confocal equatorial images from parental (left set) or GFP-LC3 (right set) MCF10A acini treated from day 6 to day 12 with 10 μM AICAR and stained with the indicated antibodies (Abs). Magnifications show intraluminal p-AMPK (red) or GFP-LC3 (green) staining in AICAR-treated acini. The percent of positive events per acinus was scored and plotted (right graphs, n = 20). Scale bars indicate 25 μm. (c) Confocal equatorial images from Fv2E-PERK MCF10A acini treated with or without 100 pM AP and/or 10 μM compound C (CC), and/or 50 nM rapamycin (Rap) fixed at day 12 of morphogenesis showing intraluminal filling. Right graphs show the distribution and mean of intraluminal cells for each equatorial section of a single acinus (n = 20). Scale bars indicate 15 μm. P-values were determined by the Student’s t-test.

References

    1. Nelson CM, Bissell MJ. Of extracellular matrix, scaffolds, and signaling: tissue architecture regulates development, homeostasis, and cancer. Annu Rev Cell Dev Biol. 2006;22:287–309. - PMC - PubMed
    1. Schafer ZT, Grassian AR, Song L, Jiang Z, Gerhart-Hines Z, Irie HY, et al. Antioxidant and oncogene rescue of metabolic defects caused by loss of matrix attachment. Nature. 2009;461:109–113. - PMC - PubMed
    1. Ng TL, Leprivier G, Robertson MD, Chow C, Martin MJ, Laderoute KR, et al. The AMPK stress response pathway mediates anoikis resistance through inhibition of mTOR and suppression of protein synthesis. Cell Death Differ. 2012;19:501–510. - PMC - PubMed
    1. Laplante M, Sabatini DM. mTOR signaling at a glance. J Cell Sci. 2009;122(Part 20):3589–3594. - PMC - PubMed
    1. Raven JF, Koromilas AE. PERK and PKR: old kinases learn new tricks. Cell Cycle. 2008;7:1146–1150. - PubMed

Publication types

MeSH terms