. 2012 Dec 6;492(7427):113-7.
doi: 10.1038/nature11623. Epub 2012 Nov 18.

Fucose sensing regulates bacterial intestinal colonization

Affiliations

Fucose sensing regulates bacterial intestinal colonization

Alline R Pacheco et al. Nature. .

Abstract

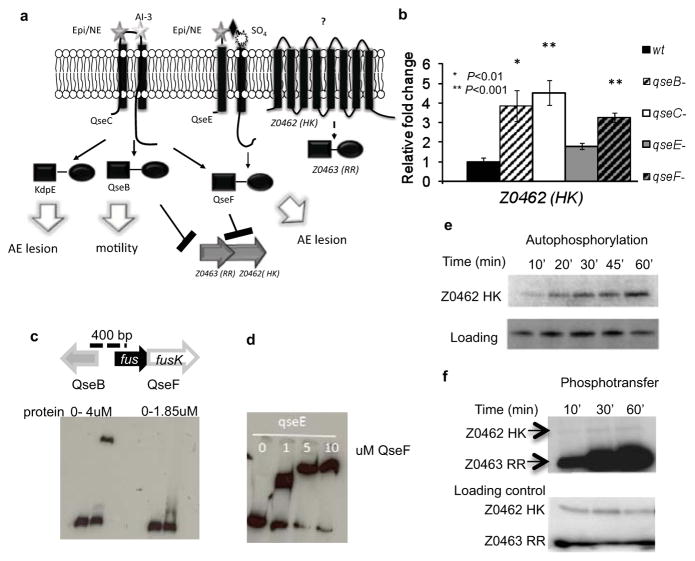
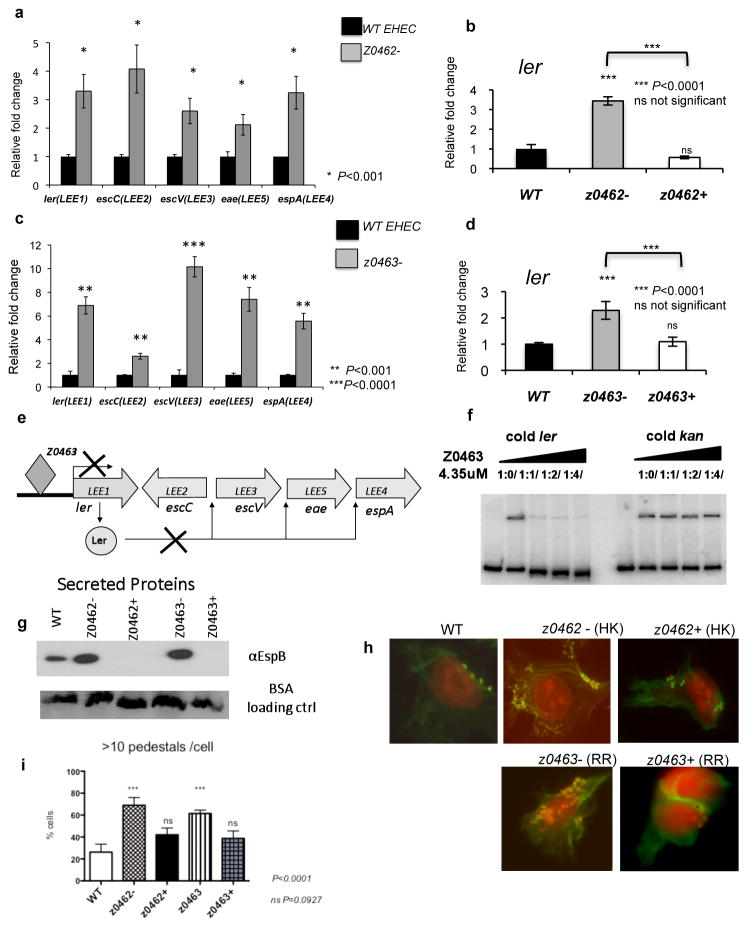
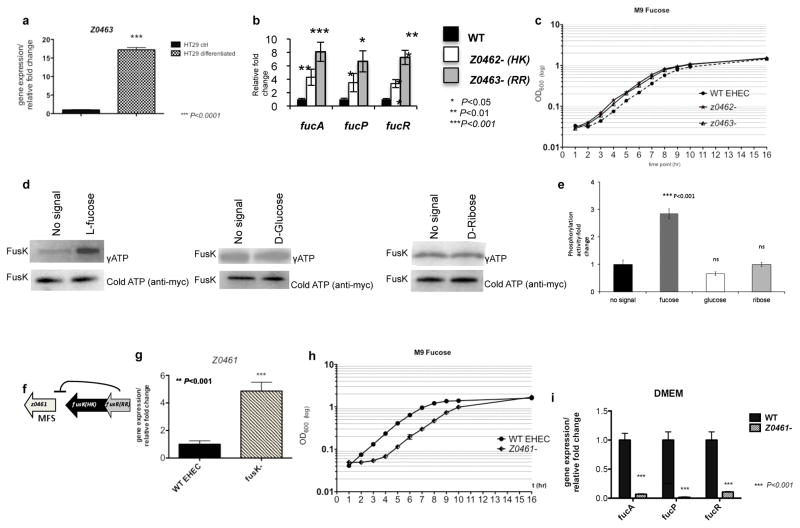
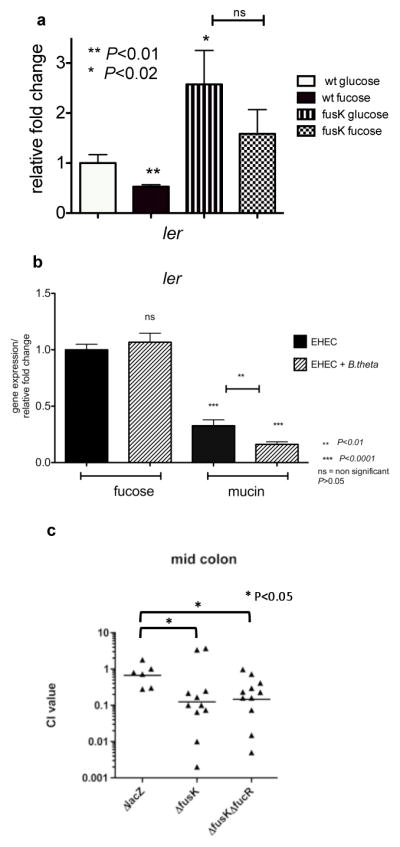
The mammalian gastrointestinal tract provides a complex and competitive environment for the microbiota. Successful colonization by pathogens requires scavenging nutrients, sensing chemical signals, competing with the resident bacteria and precisely regulating the expression of virulence genes. The gastrointestinal pathogen enterohaemorrhagic Escherichia coli (EHEC) relies on inter-kingdom chemical sensing systems to regulate virulence gene expression. Here we show that these systems control the expression of a novel two-component signal transduction system, named FusKR, where FusK is the histidine sensor kinase and FusR the response regulator. FusK senses fucose and controls expression of virulence and metabolic genes. This fucose-sensing system is required for robust EHEC colonization of the mammalian intestine. Fucose is highly abundant in the intestine. Bacteroides thetaiotaomicron produces multiple fucosidases that cleave fucose from host glycans, resulting in high fucose availability in the gut lumen. During growth in mucin, B. thetaiotaomicron contributes to EHEC virulence by cleaving fucose from mucin, thereby activating the FusKR signalling cascade, modulating the virulence gene expression of EHEC. Our findings suggest that EHEC uses fucose, a host-derived signal made available by the microbiota, to modulate EHEC pathogenicity and metabolism.


Figures

Figure 1
Figure 1. The TCS FusKR of EHEC
a, The QseC/QseE signaling-cascade. QseC senses AI-3/epinephrine(Epi)/NE. QseE senses Epi/NE/SO4/PO4. QseC phosphorylates QseB that activates flagella; KpdE that activates the LEE; and QseF. QseE only phosphorylates QseF. QseBC and QseEF repress expression of z0462/z0463. b, qRT-PCR of z0462 in WT, ΔqseB, ΔqseC, ΔqseE and ΔqseF in DMEM. Gene expression is represented as fold differences normalized to WT. Error bars indicate standard deviations of ΔddCt values. (n=18 biological samples per strain; asterisk, P≤0.01; two asterisks, P≤0.001; Student’s t-test). c, EMSA of z0463 with QseB and QseF. d, EMSA of qseE (positive control) with QseF. e, Autophosphorylation of Z0462 in liposomes (top panel), and Commassie gel of Z0462 (lower panel) (loading control). f, Phosphotransfer from Z0462 (in liposomes) to Z0463 (ratio 1 HK: 4 RR) (top panel), Commassie gel of Z0462 and Z0463 (lower panel) (loading control).
Figure 2
Figure 2. Z0462/z0463 regulates LEE expression
a, qRT-PCR of LEE genes in WT and z0462− in DMEM. b, qRT-PCR of ler in WT, z0462− and z0462+ in DMEM. c, qRT-PCR of LEE genes in WT and z0463− in DMEM. d, qRT-PCR of ler in WT, z0463− and z0463+ in DMEM. (n=18 biological samples per strain; two asterisks, P ≤ 0.001; three asterisks, P<0.0001; ns, P>0.05; Student’s t-test). e, Representation of the Ler and Z0463 regulation of the LEE operons. f, EMSA of ler with Z0463 with ler and kan cold probes. g, Western-blot of EspB in supernatants of WT, z0462−, z0462+, z0463− and z0463+ strains. BSA was added as a loading control. h, FAS assay of HeLa cells infected with EHEC WT, z0462−, z0462+, z0463− and z0463+, stained with FITC-phalloidin (actin) and propidium-iodide (bacteria and HeLa DNA).i, Quantification of FAS assay (n=600 cells; three asterisks, P<0.0001; ns, P>0.05; Student’s t-test).
Figure 3
Figure 3. Z0462/Z0463 is a fucose sensing TCS
a, qRT-PCR of z0463 in WT in the presence of undifferentiated non-mucus-producing HT29 or differentiated HT29 mucus-producing cells. Error bar indicates standard deviations of ΔddCt values. (n=18 biological samples per assay; three asterisks, P<0.0001; Student’s t-test). b, qRT-PCR of fucose-utilization genes in EHEC WT, z0462− and z0463− in DMEM (OD6001.0). (n=18 biological samples per strain; asterisk, P ≤ 0.05; two asterisks, P ≤ 0.01; three asterisks, P ≤ 0.001; Student’s t-test). c, Growth curves of WT, z0462− and z0463− strains in M9-minimal-media with L-fucose as a sole C-source. (n=6 biological samples; significance between generation times calculated through Anova P ≤ 0.01). d, FusK autophosphorylation (in liposomes) in the presence of L-fucose, D-glucose or D-ribose (top panel), and Commassie gel of FusK in liposomes (lower panel) (loading control). e, Quantification of FusK autophosphorylation. Phosphorylation represented at fold-change compared to absence of signal. Error bar indicates the standard deviation of fold-change values. (n=3; three asterisks, P<0.0001; ns, P>0.05; Student’s t-test). f, Schematic representation of the fusRK operon to z0461. g, qRT-PCR of z0461 in WT and ΔfusK. (n=18 biological samples per assay; two asterisks, P<0.001; Student’s t-test). h, Growth curves of WT and Δz0461 in M9-medium with fucose as a sole C-source. (n=6 biological samples; significance between generation times calculated through Anova P ≤ 0.01). i, qRT-PCR of fucA, fucP and fucR in WT and Δz0461. (n=18 biological samples per strain; three asterisks, P<0.001; Student’s t-test).
Figure 4
Figure 4. FusK in pathogen-microbiota-host associations
a, qRT-PCR of ler in WT or ΔfusK. RNAs extracted from cultures grown in M9 with either D-glucose or L-fucose as sole C-sources. Error bar indicates standard deviations of ΔddCt values. (n=18 biological samples per assay; asterisk, P<0.02; two asterisks, P<0.01; ns, P>0.05; Student’s t-test). b, qRT-PCR of ler in WT in the absence/presence of B.thetaiotaomicron. RNAs from cultures grown in DMEM containing L-fucose or mucin. Error bar indicates standard deviations of ΔddCt values. (n=18 biological samples per assay; two asterisks, P<0.01; three asterisks, P<0.0001; ns, P>0.05; Student’s t-test). c, Competition assays between WT andΔfusK or ΔfusKfucR. 1:1 mixtures of fusK and WT EHEC or lacZ− and lacZ+ (WT) or fusKfucR and WT were intragastrically inoculated into infant rabbits. CFU in the mid-colon were determined 2-days post-inoculation. Each point represents a competitive index. Bars represent the geometric mean value for each group. (n=2 litters [6–11 animals]ΔlacZ and ΔfusKΔfucR, n=3 litters [11 animals]ΔfusK; asterisk, P<0.05; Mann-Whitney test).

References

    1. Kau AL, Ahern PP, Griffin NW, Goodman AL, Gordon JI. Human nutrition, the gut microbiome and the immune system. Nature. 2011;474:327–336. - PMC - PubMed
    1. Fischbach MA, Sonnenburg JL. Eating for two: how metabolism establishes interspecies interactions in the gut. Cell Host Microbe. 2011;10:336–347. - PMC - PubMed
    1. Clarke MB, Hughes DT, Zhu C, Boedeker EC, Sperandio V. The QseC sensor kinase: A bacterial adrenergic receptor. Proc Natl Acad Sci U S A. 2006:10420–10425. - PMC - PubMed
    1. Reading NC, Rasko DA, Torres AG, Sperandio V. The two-component system QseEF and the membrane protein QseG link adrenergic and stress sensing to bacterial pathogenesis. Proc Natl Acad Sci U S A. 2009;106:5889–5894. - PMC - PubMed
    1. Robbe C, Capon C, Coddeville B, Michalski JC. Structural diversity and specific distribution of O-glycans in normal human mucins along the intestinal tract. Biochem J. 2004;384:307–316. - PMC - PubMed

Publication types

MeSH terms

Associated data