. 2012 Dec;23(12):2012-23.
doi: 10.1681/ASN.2012050438. Epub 2012 Nov 15.

MicroRNA-494 reduces ATF3 expression and promotes AKI

Affiliations

MicroRNA-494 reduces ATF3 expression and promotes AKI

Yi-Fan Lan et al. J Am Soc Nephrol. 2012 Dec.

Abstract

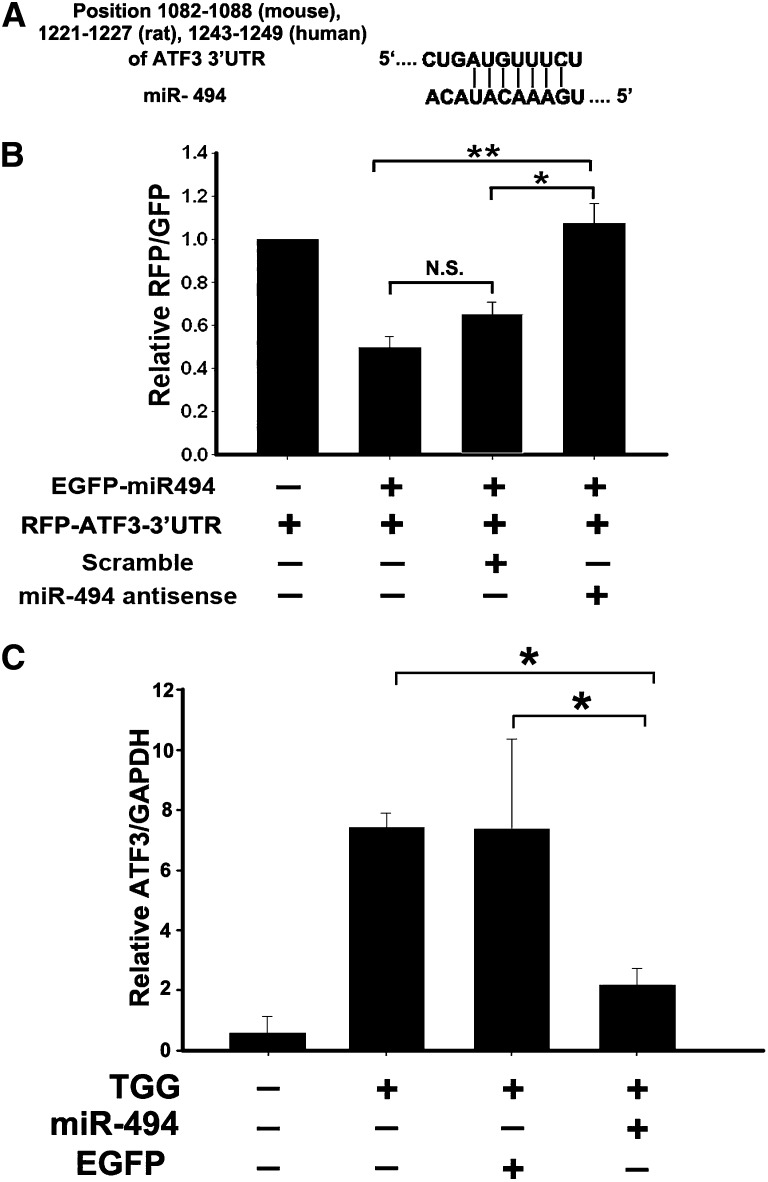
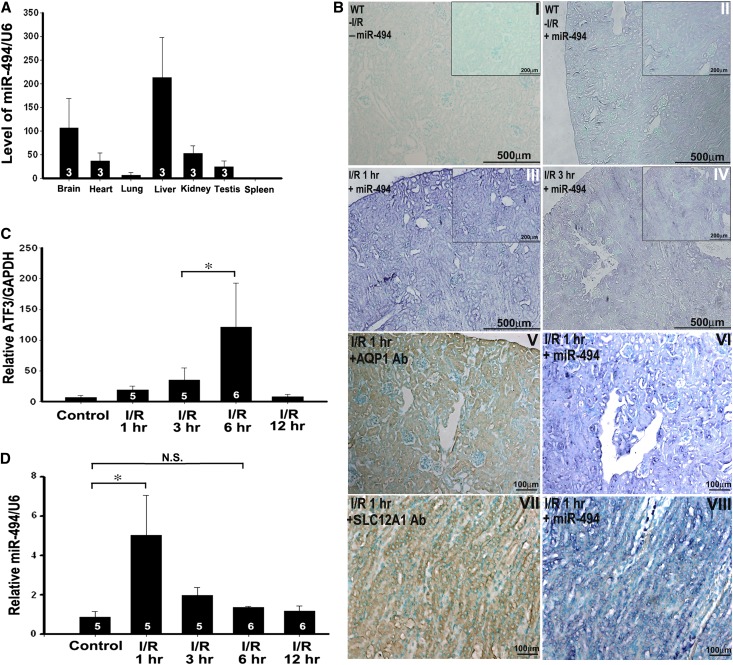
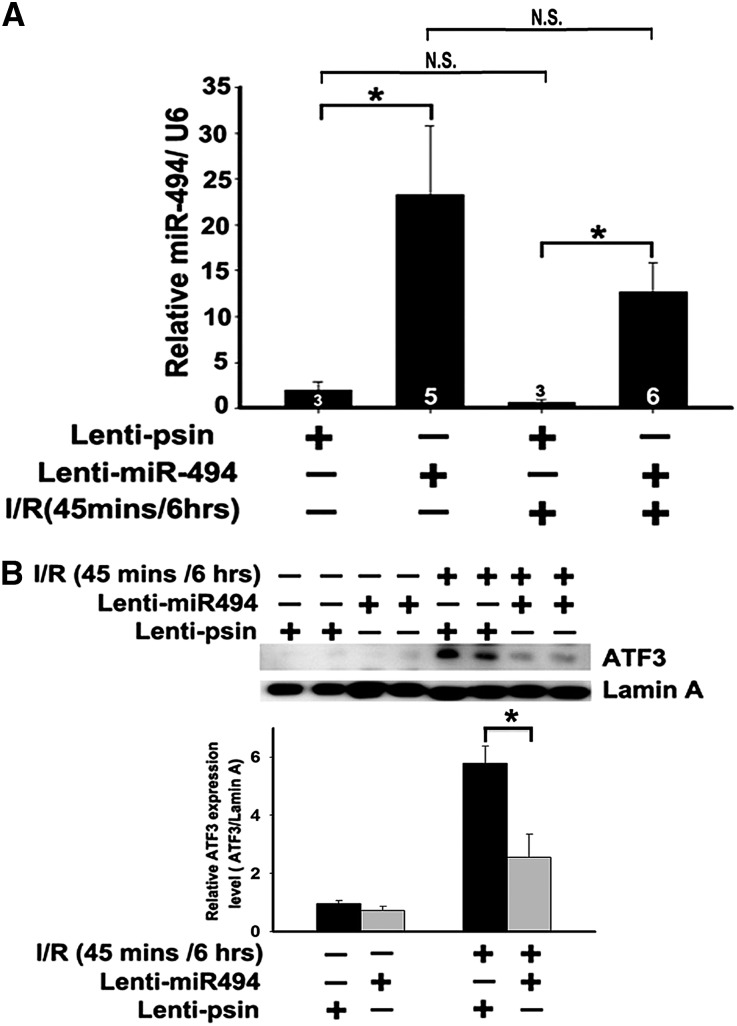
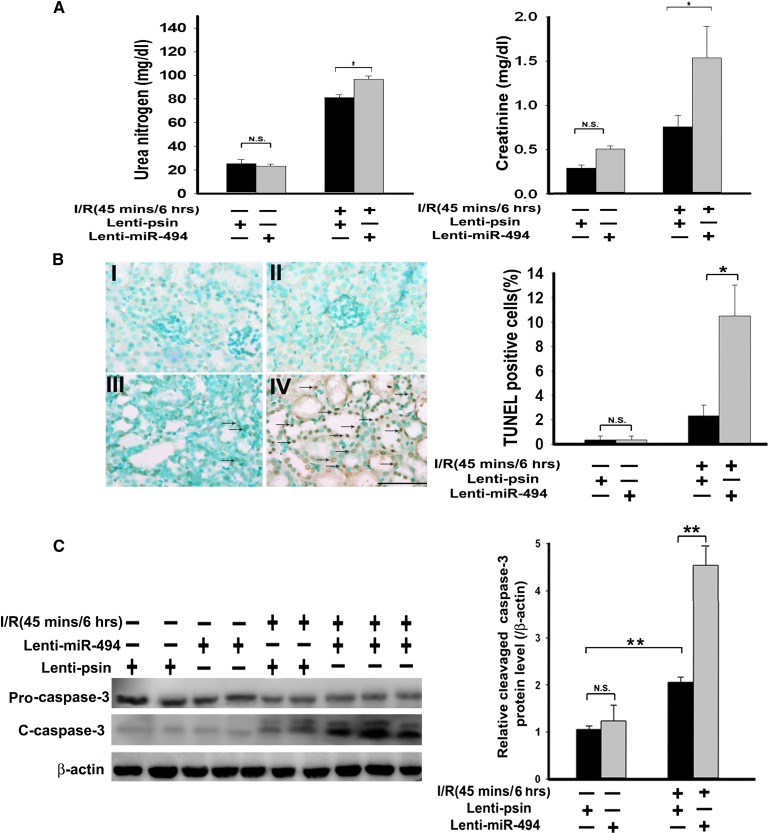
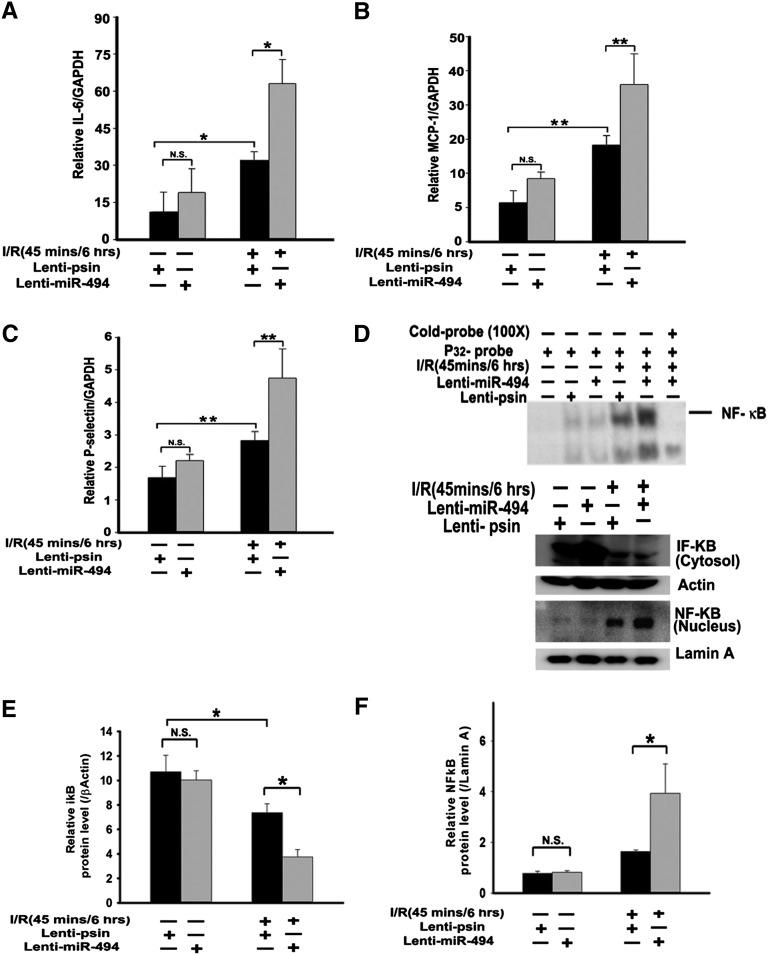
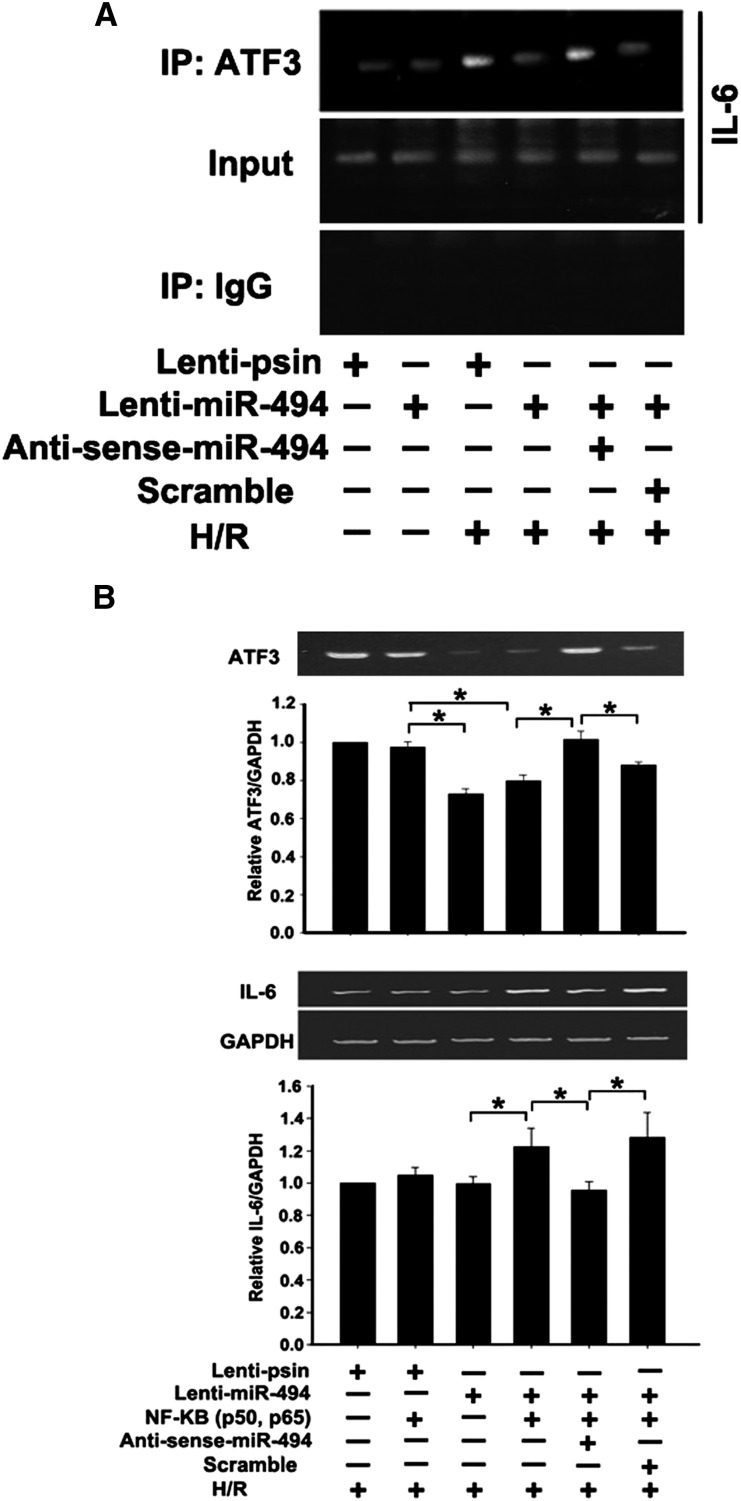
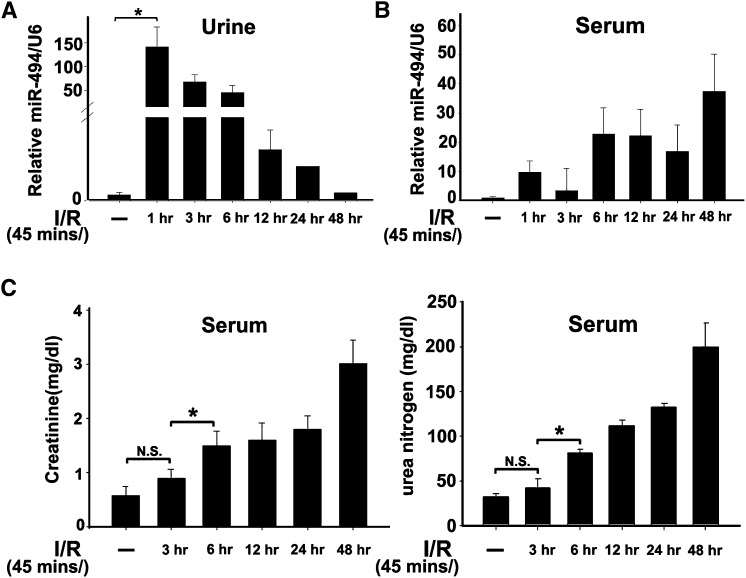
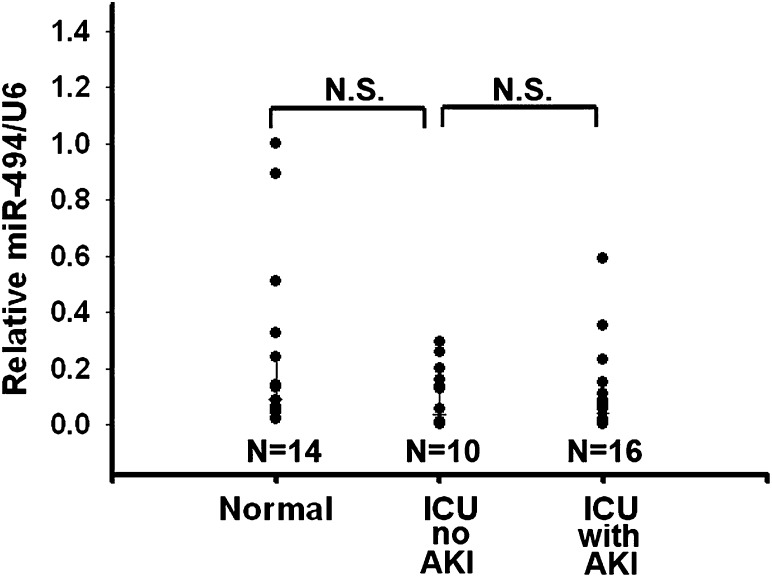
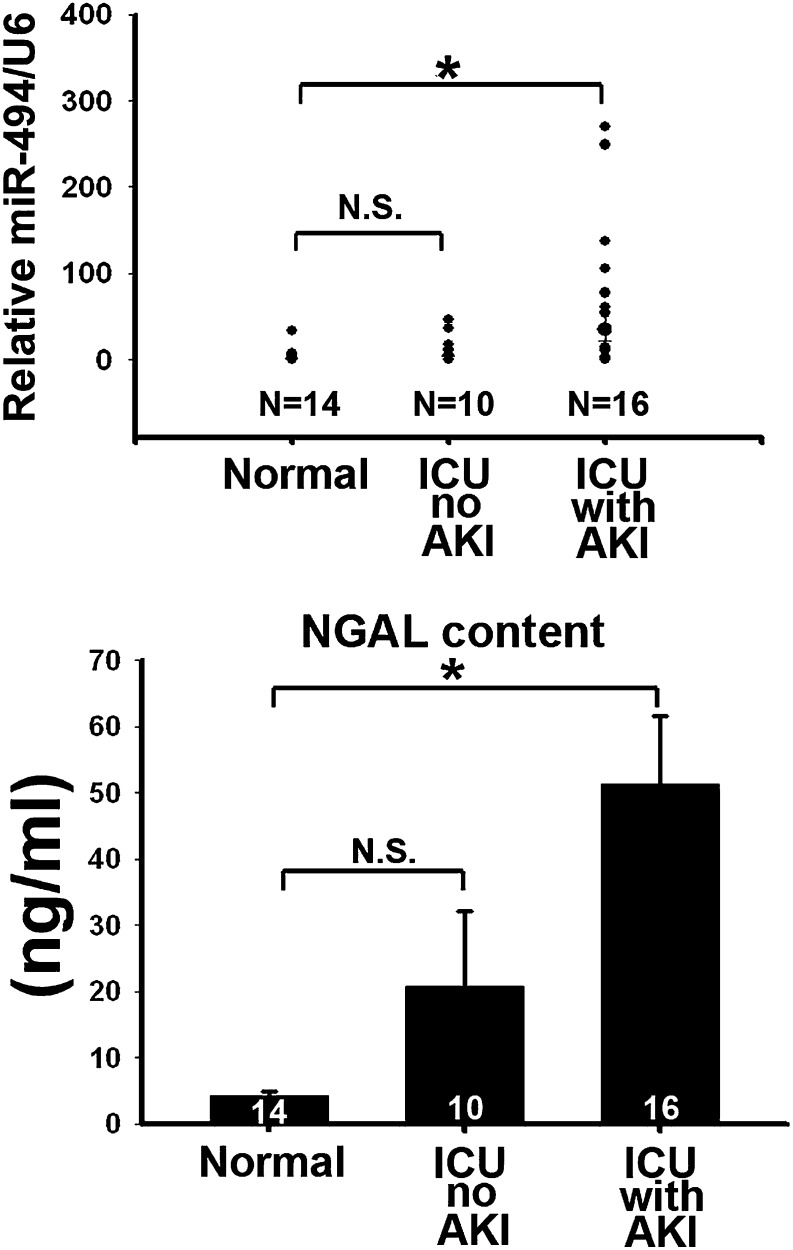
MicroRNA-494 mediates apoptosis and necrosis in several types of cells, but its renal target and potential role in AKI are unknown. Here, we found that microRNA-494 binds to the 3'UTR of activating transcription factor 3 (ATF3) and decreases its transcription. In mice, overexpression of microRNA-494 significantly attenuated the level of ATF3 and induced inflammatory mediators, such as IL-6, monocyte chemotactic protein-1, and P-selectin, after renal ischemia/reperfusion, exacerbating apoptosis and further decreasing renal function. Activation of NF-κB mediated this proinflammatory response. In this ischemia/reperfusion model, urinary levels of microRNA-494 increased significantly before the rise in serum creatinine. In humans, urinary microRNA-494 levels were 60-fold higher in patients with AKI than normal controls. In conclusion, upregulation of microRNA-494 contributes to inflammatory or adhesion molecule-induced kidney injury after ischemia/reperfusion by inhibiting expression of ATF3. Furthermore, microRNA-494 may be a specific and noninvasive biomarker for AKI.


Figures

Figure 1.
Figure 1.
Overexpression of miR-494 inhibits ATF3 expression in vitro. (A) Schematic representation of the putative miR-494 target sites in the 3′UTR of ATF3 of mouse, rat, or human. (B) ATF3 3′UTR activity assay. Fluorescent constructs containing EGFP–miR-494 and RFP-ATF3–3′UTR plasmids were cotransfected into 293T cells with or without scrambling or antisense plasmids. Fluorescent activity was determined 24 hours after transfection. The ratio of normalized sensor to control fluorescent activity is shown. The data are expressed as means ± SEM of three independent experiments. *P<0.05, **P<0.01. N.S., no significant difference. (C) Real-time PCR detected marked induction of miR-494, which dramatically decreased ATF3 levels in the NRK-52E cells induced by ATF3 inducer thapsigargin (TGG). The relative expression of the ATF3 was normalized to glyceraldehydes-3-phosphate dehydrogenase. *P<0.05 (n=3).
Figure 2.
Figure 2.
The expression of miR-494 is ubiquitous in mice tissues and induced by I/R injury in the kidneys. (A) miRNAs were reverse-transcribed using miR-494 and U6 RNA-specific primers, and real-time PCR was performed as described in Concise Methods. The relative expression of the mature miR-494 was normalized to U6 RNA. Data are given as means ± SEM of triplicates. (B) The localization of miR-494 in the mouse kidney after I/R injury was detected by in situ hybridization. Paraffin-fixed sections of mouse kidney were hybridized with the digoxigenin-labeled miR-494 probe, proximal and distal tubular marker (aquaporin 1 [AQP1]), and Henle's loop marker (sodium-potassium-chloride cotransporter isoform 2 [SLC12A1]), and nuclei staining was stained by Contrast green. Figures are representative of three experiments performed on different days. Scale bar, 100, 200, and 500 μm as indicated. (C and D) Time course of the expression levels of both miR-494 and ATF3 in the kidneys after I/R injury. *P<0.05 (n=3, 5, or 6 mice per group as shown in the diagram). N.S., no significant difference.
Figure 3.
Figure 3.
Overexpression of miR-494 inhibits ATF3 translocation in mice. (A) Quantitative analysis of miR-494 level after the kidney was infused with lenti–miR-494 or lenti-pSin control (n=3, 5, or 6 mice per group as shown in the diagram). Bilateral renal arterial clamping was for 45 minutes, and miR-494 level was measured 6 hours after reperfusion. (B) The protein levels of ATF3 in the mouse kidneys after infusion with lenti–miR-494 or lenti-pSin after I/R injury. *P<0.05 (n=3). N.S., no significant difference.
Figure 4.
Figure 4.
miR-494 overexpression decreases kidney function and increases renal apoptosis in mice. (A) Kidney functions assessed with or without miR-494 infusion after I/R injury. Bilateral renal arteries were clamped for 45 minutes, and serum urea nitrogen and creatinine levels were measured 6 hours after reperfusion or sham surgery. Values are means ± SEM; n=7 animals/group. *P<0.05 compared with control groups. (B) Apoptotic kidney cells in mice infused with or without miR-494 using in vivo TUNEL staining. Without (I and III) or with (II and IV) infused miR-494, mice underwent a sham operation (I and II) or 45 minutes of renal clamping to induce ischemia followed by 6 hours of reperfusion (III and IV). TUNEL staining of representative kidney sections from each experimental group are shown. Colocalization of blue and brown staining in nuclei reflects apoptotic cells that are indicated with arrows. Scale bar, 50 μm. Proportions of TUNEL-positive renal epithelial nuclei to total nuclei in mice infused with or without miR-494 and subjected to the sham operation or I/R injury are shown. *P<0.05 (n=7 animals/group). (C) Active caspase-3 protein expression in mouse kidney with or without lenti–miR-494 infection. Kidney lysates of mice subjected to the sham operation or I/R injury were probed with specific antibody against the uncleaved, pro–caspase-3 and cleaved, active form of caspase-3. Scanning densitometry was used for semiquantitative analysis and compared with β-actin levels. Values are means ± SEM from three experiments. **P<0.01 (n=3).
Figure 5.
Figure 5.
Overexpression of miR-494 increases inflammation-related gene transcription in mouse renal tissues. Quantitative RT-PCR analysis of (A) IL-6, (B) MCP-1, and (C) P-selectin from renal cDNA derived from mice infused with or without miR-494 and then subjected to sham or I/R experiments. RT-PCR was conducted 6 hours after ischemia. Expression was normalized to the expression of glyceraldehyde 3-phosphate dehydrogenase (GAPDH). *P<0.05, **P<0.01 (n=5 mice in each group). N.S., no significant difference. (D and F) NF-κB nuclear translocation and activation. (D and E) IκB degradation. (D, upper panel) Electrophoretic mobility shift assay of NF-κB expression in renal nuclear extracts of mice infused with and without infused miR-494 and subjected to a sham operation or I/R injury. (D, lower panel) Nuclear or cytosolic extracts were probed with anti–NF-κB or anti-IκB antibody, respectively, to quantify protein levels in these subcellular compartments. Anti–β-actin and lamin A served as the loading controls. *P<0.05 (n=4). N.S., no significant difference.
Figure 6.
Figure 6.
Inhibition of ATF3 recruitment to the proximal promoter region of IL-6 by mir-R494 induces IL-6 inflammatory gene expression. (A) ChIP assay. NRK-52E cells were transfected with a plasmid as indicated, and cell lysates were crosslinked with formaldehyde. The ChIP assay involved the use of anti-ATF3 antibody. Immunoprecipitated DNA was amplified by PCR for the proximal promoter region of IL-6. (B) miR-494 promoted NF-κB–induced IL-6 expression. NRK-52E cells were transfected with the empty expression plasmid (vector), NF-κB (two plasmids encoding for the p50 or p65 subunit), or NF-κB together with the lenti–miR-494. Results are from RT-PCR analysis of the expression of NF-κB–induced IL-6 relative to the expression of glyceraldehyde-3-phosphate dehydrogenase 2 days after transfection. Experiments were performed three times with similar results. *P<0.05.
Figure 7.
Figure 7.
The expression levels of miR-494 are earlier than creatinine and urea in mouse urine or serum after kidney I/R. Bilateral clamping of renal artery was 45 minutes followed by various durations of reperfusion. Levels of urinary (A) and serum (B) miR-494 were normalized to internal control U6 RNA by real time PCR assay. (C) Kidney functions assessed following I/R injury. *P<0.05 (n=5 animals/group). N.S., no significant difference.
Figure 8.
Figure 8.
Serum miR-494 levels have no difference between normal and ICU patients with and without AKI. Serum miR-494 levels were normalized to U6 RNA. N.S., no significant difference.
Figure 9.
Figure 9.
Elevated urinary miR-494 levels are consistent with NGAL levels in AKI patients. Urinary miR-494 was measured by quantitative PCR, and urinary NGAL was measured by ELISA Kit (BioVendor) in the control patients and ICU patients without or with AKI. *P<0.05. N.S., no significant difference.

Similar articles

Cited by

References

    1. Padanilam BJ: Cell death induced by acute renal injury: A perspective on the contributions of apoptosis and necrosis. Am J Physiol Renal Physiol 284: F608–F627, 2003 - PubMed
    1. Schiffl H: Daily haemodialysis for acute renal failure. Curr Opin Nephrol Hypertens 11: 589–592, 2002 - PubMed
    1. Li HF, Cheng CF, Liao WJ, Lin H, Yang RB: ATF3-mediated epigenetic regulation protects against acute kidney injury. J Am Soc Nephrol 21: 1003–1013, 2010 - PMC - PubMed
    1. Lovat F, Valeri N, Croce CM: MicroRNAs in the pathogenesis of cancer. Semin Oncol 38: 724–733, 2011 - PubMed
    1. Krützfeldt J, Rajewsky N, Braich R, Rajeev KG, Tuschl T, Manoharan M, Stoffel M: Silencing of microRNAs in vivo with ‘antagomirs’. Nature 438: 685–689, 2005 - PubMed

Publication types

MeSH terms