

Pathogenesis of A⁻β⁺ ketosis-prone diabetes
- PMID: 23160531
- PMCID: PMC3581228
- DOI: 10.2337/db12-0624
Pathogenesis of A⁻β⁺ ketosis-prone diabetes
Abstract
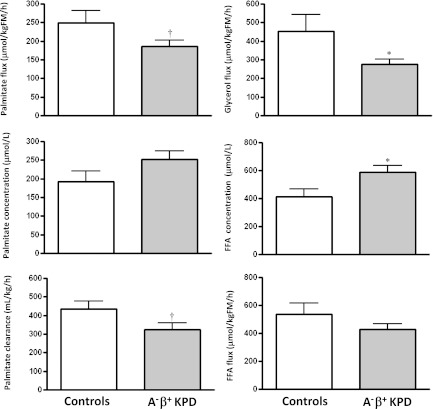
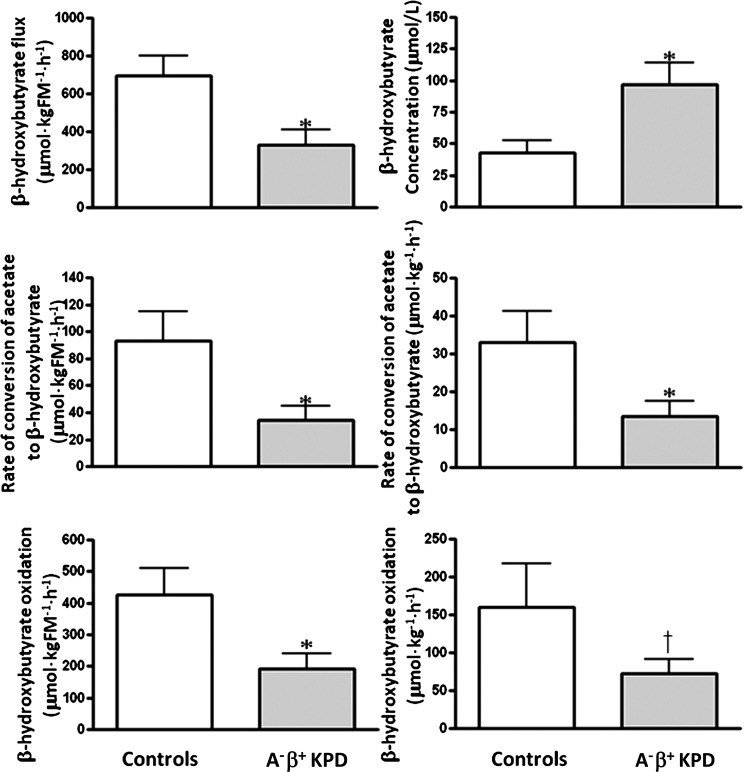
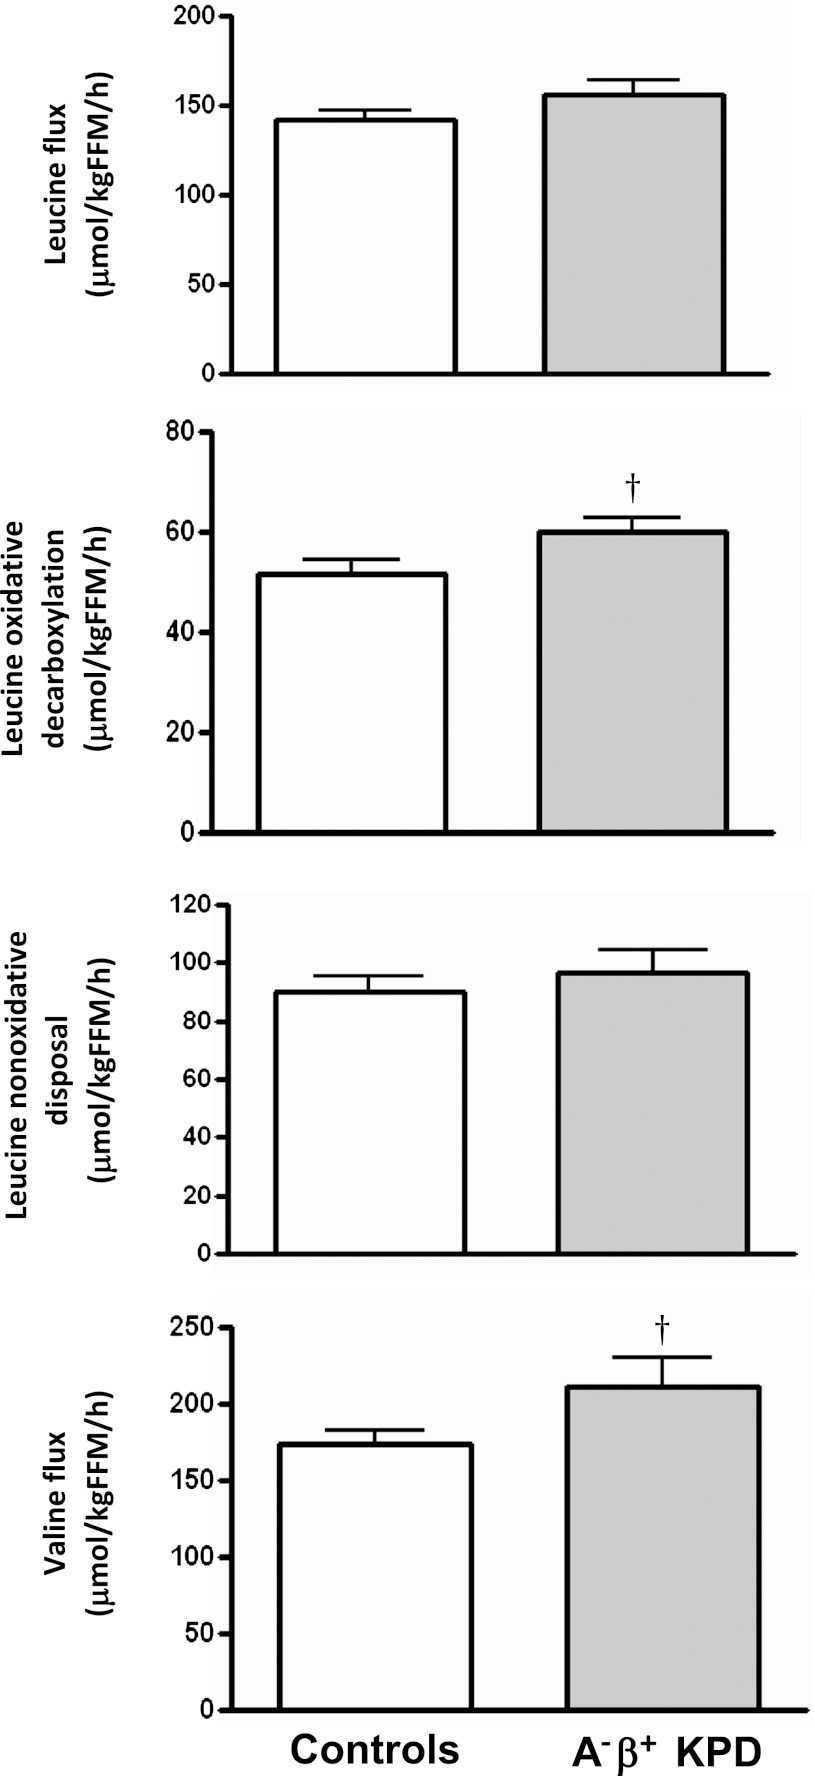
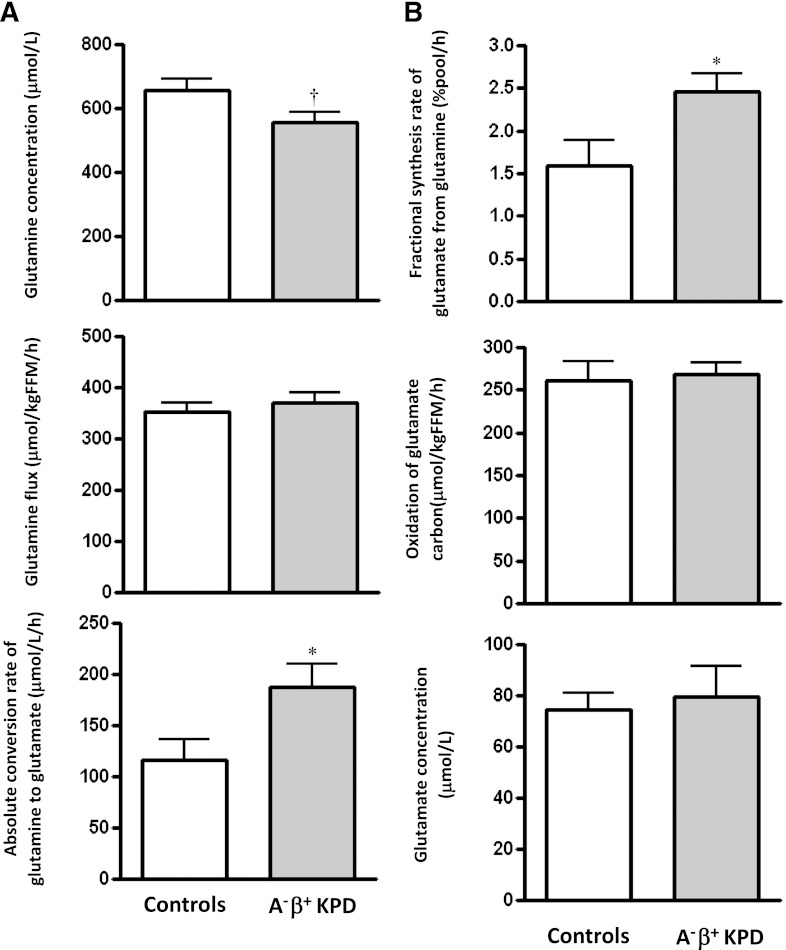
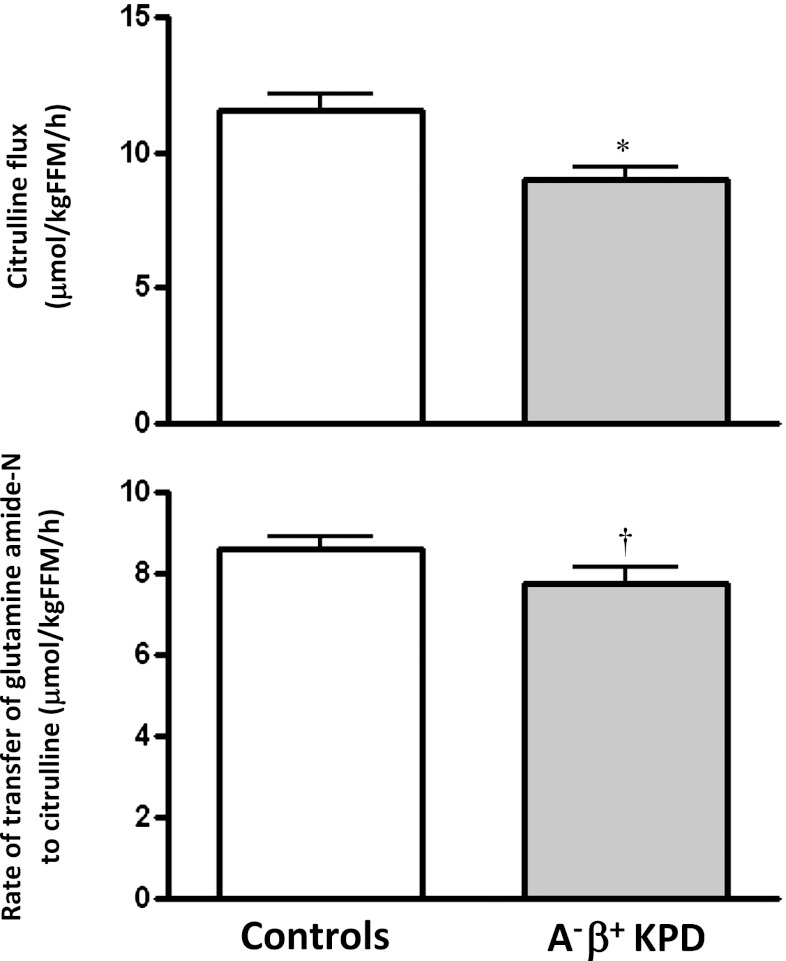
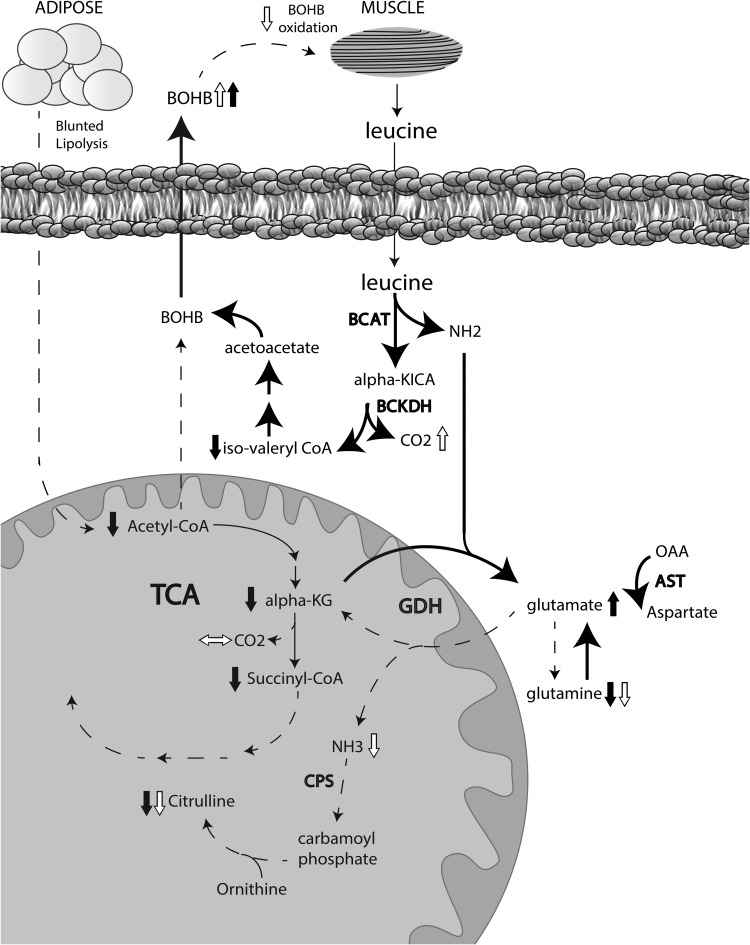
A⁻β⁺ ketosis-prone diabetes (KPD) is an emerging syndrome of obesity, unprovoked ketoacidosis, reversible β-cell dysfunction, and near-normoglycemic remission. We combined metabolomics with targeted kinetic measurements to investigate its pathophysiology. Fasting plasma fatty acids, acylcarnitines, and amino acids were quantified in 20 KPD patients compared with 19 nondiabetic control subjects. Unique signatures in KPD--higher glutamate but lower glutamine and citrulline concentrations, increased β-hydroxybutyryl-carnitine, decreased isovaleryl-carnitine (a leucine catabolite), and decreased tricarboxylic acid (TCA) cycle intermediates--generated hypotheses that were tested through stable isotope/mass spectrometry protocols in nine new-onset, stable KPD patients compared with seven nondiabetic control subjects. Free fatty acid flux and acetyl CoA flux and oxidation were similar, but KPD had slower acetyl CoA conversion to β-hydroxybutyrate; higher fasting β-hydroxybutyrate concentration; slower β-hydroxybutyrate oxidation; faster leucine oxidative decarboxylation; accelerated glutamine conversion to glutamate without increase in glutamate carbon oxidation; and slower citrulline flux, with diminished glutamine amide-nitrogen transfer to citrulline. The confluence of metabolomic and kinetic data indicate a distinctive pathogenic sequence: impaired ketone oxidation and fatty acid utilization for energy, leading to accelerated leucine catabolism and transamination of α-ketoglutarate to glutamate, with impaired TCA anaplerosis of glutamate carbon. They highlight a novel process of defective energy production and ketosis in A⁻β⁺ KPD.
Figures
Comment in
-
Metabolomics, stable isotopes, and A-β+ ketosis-prone diabetes.Diabetes. 2013 Mar;62(3):682-4. doi: 10.2337/db12-1347. Diabetes. 2013. PMID: 23431008 Free PMC article. No abstract available.
References
-
- Maldonado M, Hampe CS, Gaur LK, et al. Ketosis-prone diabetes: dissection of a heterogeneous syndrome using an immunogenetic and beta-cell functional classification, prospective analysis, and clinical outcomes. J Clin Endocrinol Metab 2003;88:5090–5098 - PubMed
-
- Kitabchi AE. Ketosis-prone diabetes—a new subgroup of patients with atypical type 1 and type 2 diabetes? J Clin Endocrinol Metab 2003;88:5087–5089 - PubMed
-
- Mauvais-Jarvis F, Sobngwi E, Porcher R, et al. Ketosis-prone type 2 diabetes in patients of sub-Saharan African origin: clinical pathophysiology and natural history of beta-cell dysfunction and insulin resistance. Diabetes 2004;53:645–653 - PubMed
-
- Umpierrez GE, Smiley D, Kitabchi AE. Narrative review: ketosis-prone type 2 diabetes mellitus. Ann Intern Med 2006;144:350–357 - PubMed
Publication types
MeSH terms
Substances
Grants and funding
LinkOut - more resources
Full Text Sources
Medical
