

Early metabolic markers of the development of dysglycemia and type 2 diabetes and their physiological significance
- PMID: 23160532
- PMCID: PMC3636608
- DOI: 10.2337/db12-0707
Early metabolic markers of the development of dysglycemia and type 2 diabetes and their physiological significance
Abstract
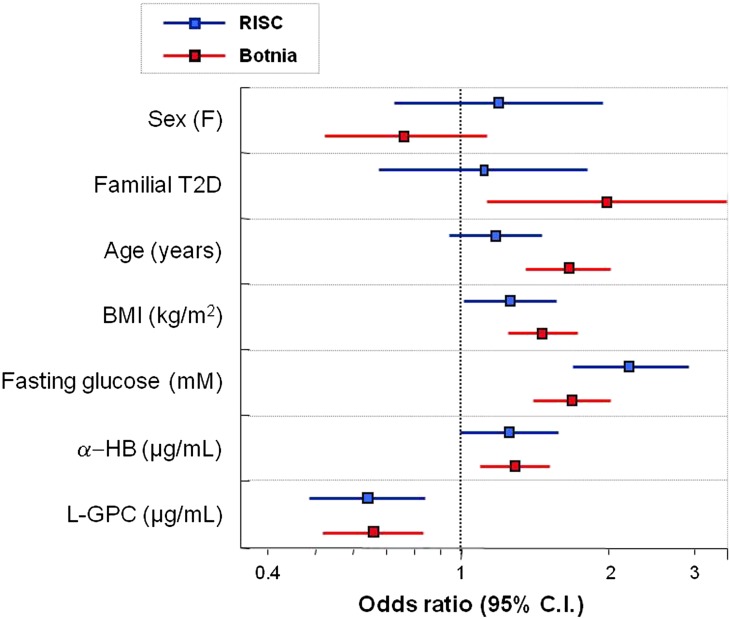
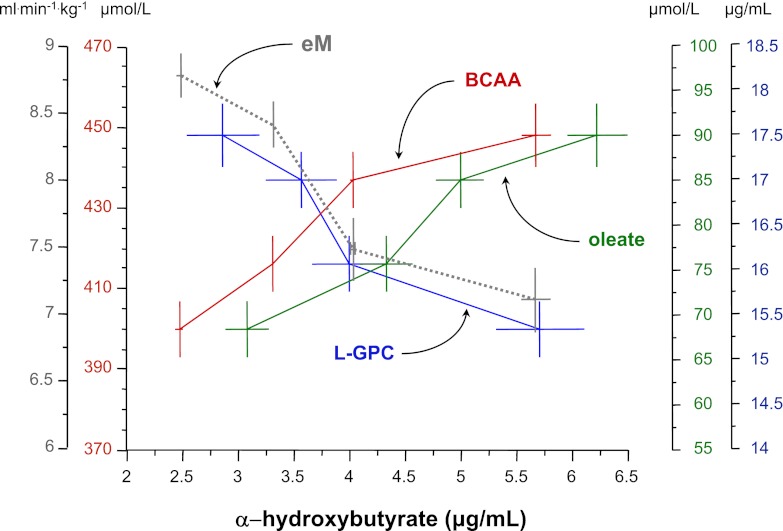
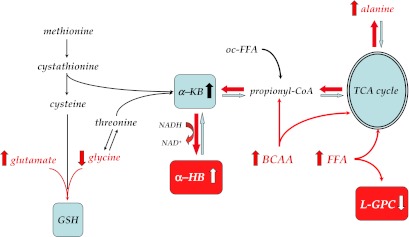
Metabolomic screening of fasting plasma from nondiabetic subjects identified α-hydroxybutyrate (α-HB) and linoleoyl-glycerophosphocholine (L-GPC) as joint markers of insulin resistance (IR) and glucose intolerance. To test the predictivity of α-HB and L-GPC for incident dysglycemia, α-HB and L-GPC measurements were obtained in two observational cohorts, comprising 1,261 nondiabetic participants from the Relationship between Insulin Sensitivity and Cardiovascular Disease (RISC) study and 2,580 from the Botnia Prospective Study, with 3-year and 9.5-year follow-up data, respectively. In both cohorts, α-HB was a positive correlate and L-GPC a negative correlate of insulin sensitivity, with α-HB reciprocally related to indices of β-cell function derived from the oral glucose tolerance test (OGTT). In follow-up, α-HB was a positive predictor (adjusted odds ratios 1.25 [95% CI 1.00-1.60] and 1.26 [1.07-1.48], respectively, for each standard deviation of predictor), and L-GPC was a negative predictor (0.64 [0.48-0.85] and 0.67 [0.54-0.84]) of dysglycemia (RISC) or type 2 diabetes (Botnia), independent of familial diabetes, sex, age, BMI, and fasting glucose. Corresponding areas under the receiver operating characteristic curve were 0.791 (RISC) and 0.783 (Botnia), similar in accuracy when substituting α-HB and L-GPC with 2-h OGTT glucose concentrations. When their activity was examined, α-HB inhibited and L-GPC stimulated glucose-induced insulin release in INS-1e cells. α-HB and L-GPC are independent predictors of worsening glucose tolerance, physiologically consistent with a joint signature of IR and β-cell dysfunction.
Figures
Comment in
-
"Prediction is very hard, especially about the future": new biomarkers for type 2 diabetes?Diabetes. 2013 May;62(5):1384-5. doi: 10.2337/db13-0057. Diabetes. 2013. PMID: 23613559 Free PMC article. No abstract available.
References
-
- Shah SH, Svetkey LP, Newgard CB. Branching out for detection of type 2 diabetes. Cell Metab 2011;13:491–492 - PubMed
-
- Kolak M, Westerbacka J, Velagapudi VR, et al. Adipose tissue inflammation and increased ceramide content characterize subjects with high liver fat content independent of obesity. Diabetes 2007;56:1960–1968 - PubMed
Publication types
MeSH terms
Substances
LinkOut - more resources
Full Text Sources
Other Literature Sources
Medical
