. 2013 Jan;137(1):93-107.
doi: 10.1007/s10549-012-2332-x. Epub 2012 Nov 18.

Inhibition of the proliferation of acquired aromatase inhibitor-resistant breast cancer cells by histone deacetylase inhibitor LBH589 (panobinostat)

Affiliations

Inhibition of the proliferation of acquired aromatase inhibitor-resistant breast cancer cells by histone deacetylase inhibitor LBH589 (panobinostat)

Makoto Kubo et al. Breast Cancer Res Treat. 2013 Jan.

Abstract

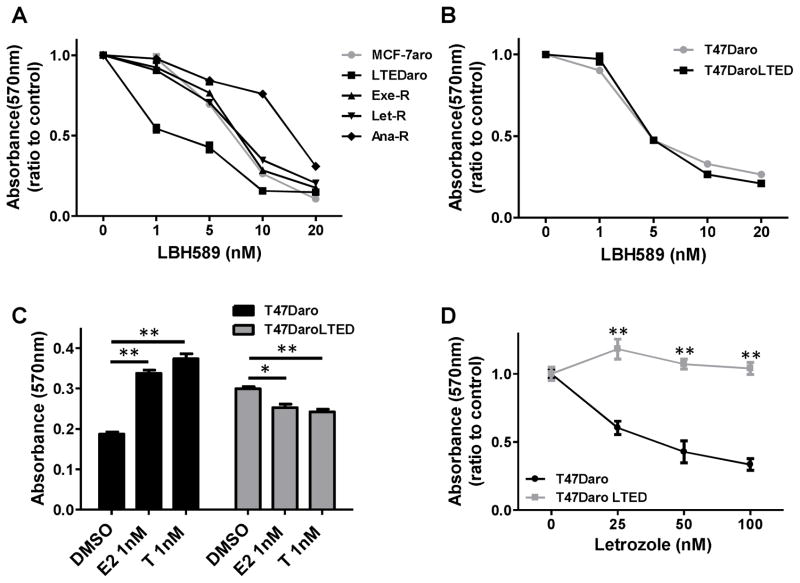
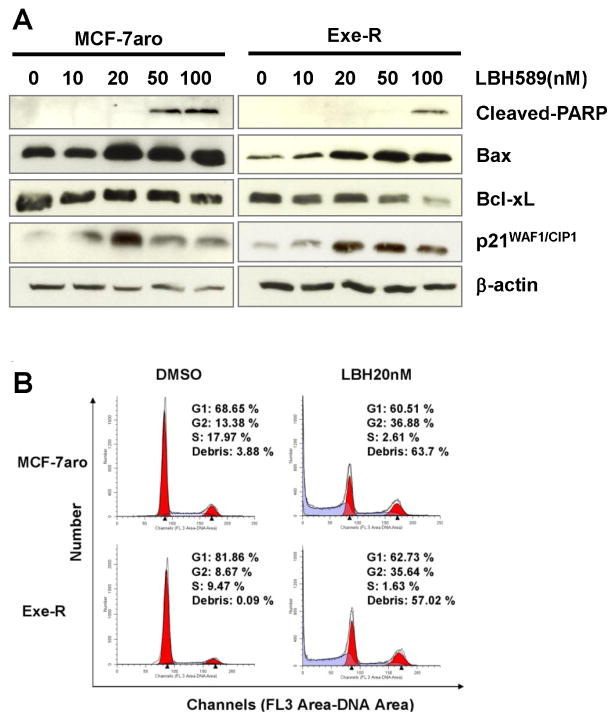
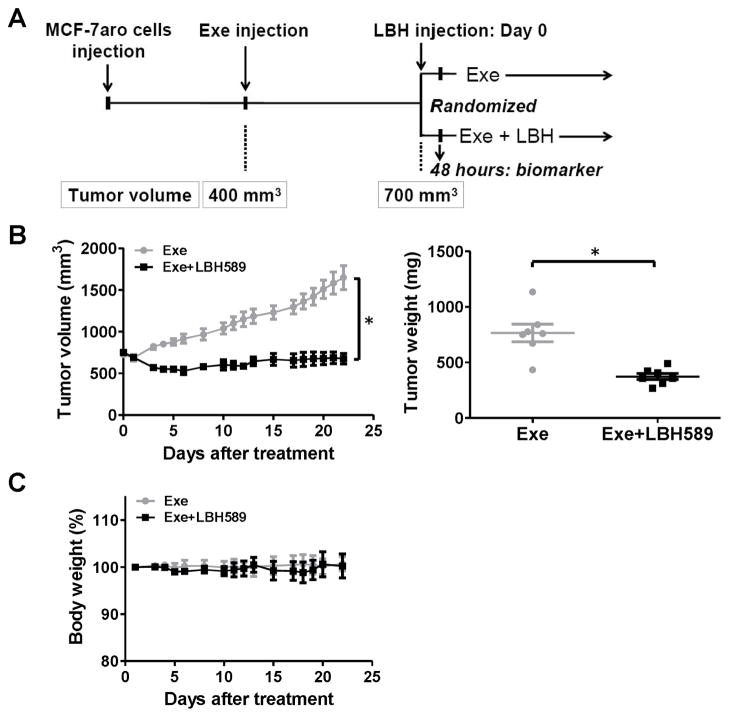
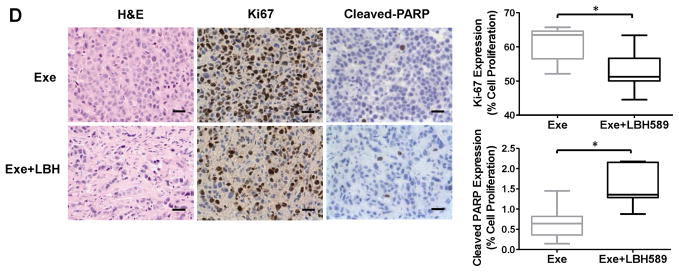
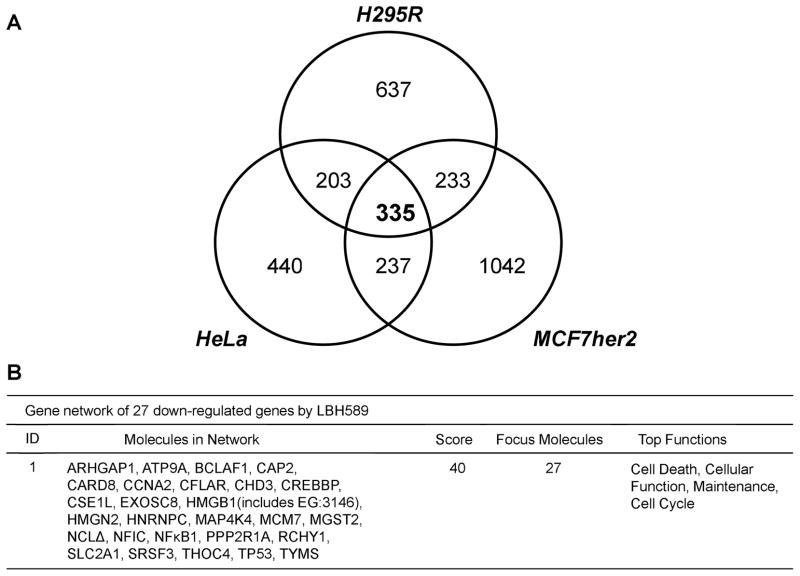
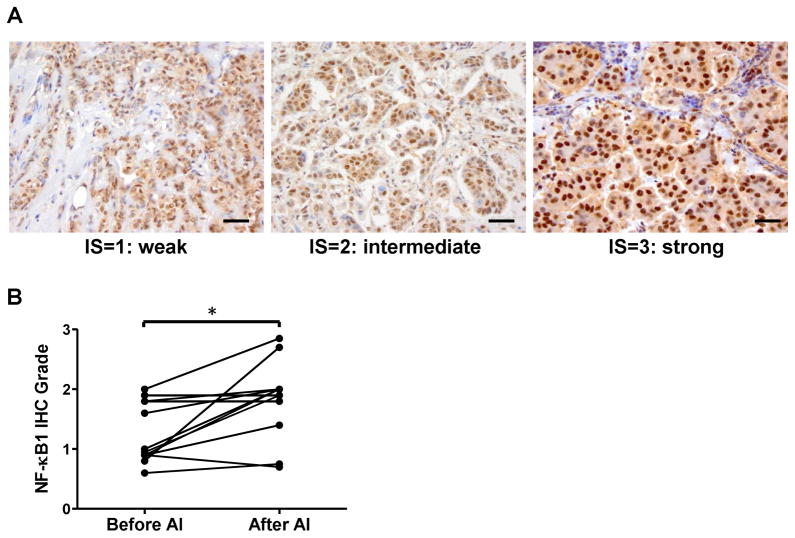
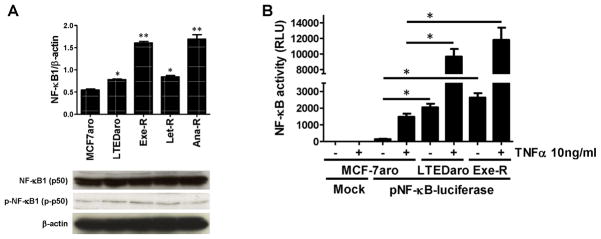
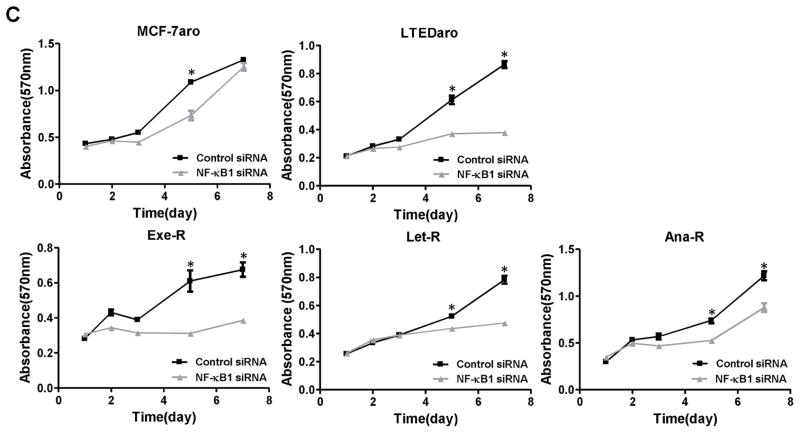
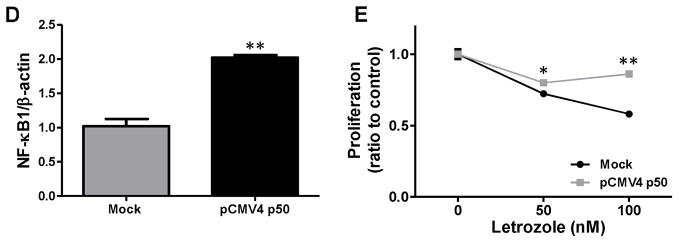
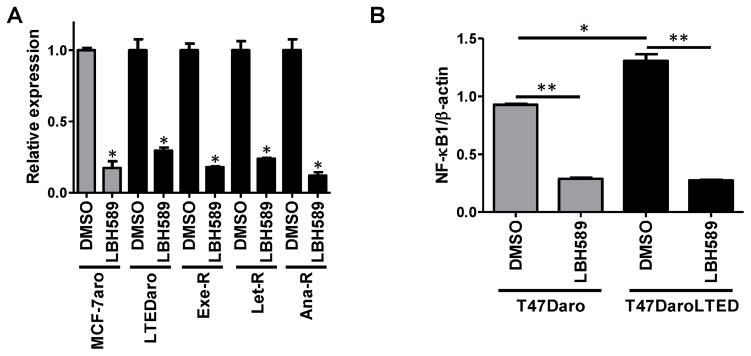
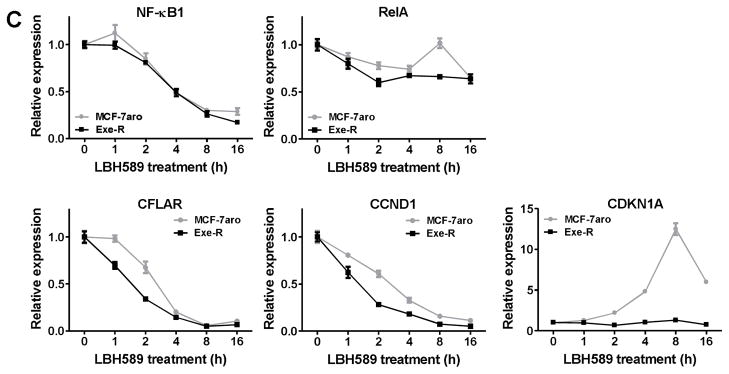
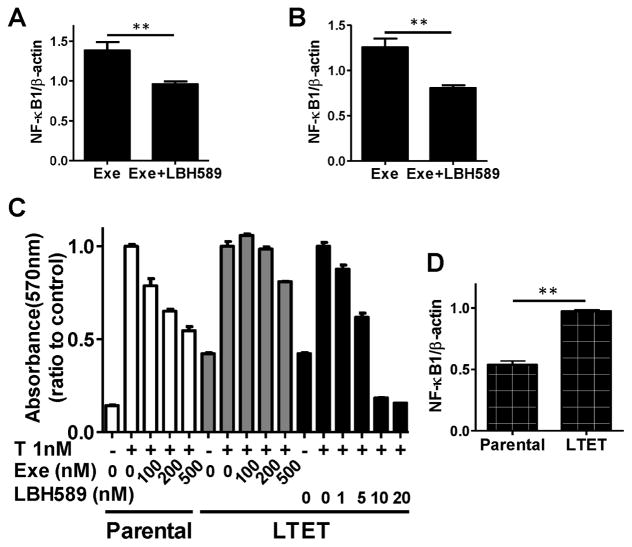
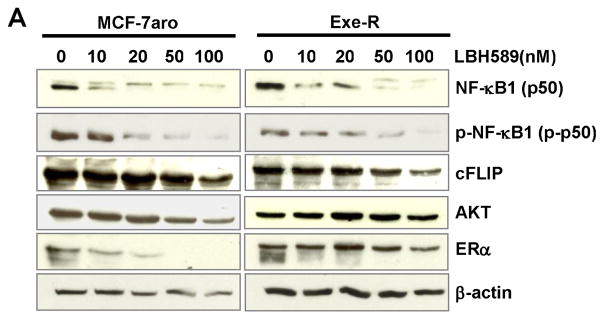
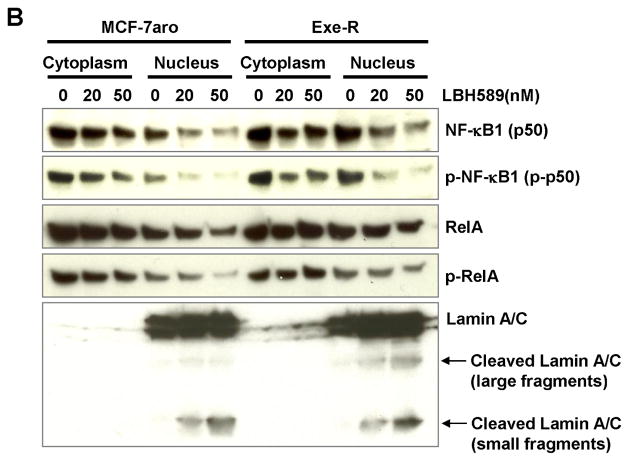
Aromatase inhibitors (AIs) are important drugs for treating postmenopausal patients with hormone receptor-positive breast cancer. However, acquired resistance to AI therapies is a significant problem. Our study has revealed that the histone deacetylase inhibitor LBH589 treatment abrogated growth of AI-resistant cells in vitro and in vivo, causing cell cycle G2/M arrest and induced apoptosis. LBH589 treatment also reduced the level of NF-κB1 which is overexpressed when AI resistance develops. Analyzing paired tumor specimens from 12 patients, we found that NF-κB1 expression was increased in recurrent AI-resistant tumors as compared to the paired primary tumors before AI treatment. This finding was consistent with up-regulated NF-κB1 expression seen in a collection of well-established AI-resistant cell lines. Furthermore, knockdown of NF-κB1 expression significantly suppressed the proliferation of AI-resistant cells. Treatment of AI-resistant cell lines with LBH589 suppressed NF-κB1 mRNA and protein expression. In addition, LBH589 treatment abrogated growth of AI-resistant tumors in mice, and was associated with significantly decreased levels of NF-κB1 in tumors. In all, our findings strongly support further investigation of LBH589 as a novel therapeutic strategy for patients with AI-resistant breast cancer, in part by suppressing the NF-κB1 pathway.


Conflict of interest statement

Conflict of interest: There are no potential conflicts of interest.

Figures

Fig. 1
Fig. 1. Inhibitory effect of LBH589 on the proliferation of AI-resistant cell lines
(A) LBH589 decreased cell proliferation of all cell lines in a dose-dependent manner. Cells were treated with the indicated concentrations of LBH589 (LBH) or DMSO (vehicle control) for 6 days and medium was replaced every 72 h. Cell viability was assessed by MTT assay. Five replicates were performed for each measurement, and the mean and standard error were calculated. Data are shown as a ratio of treated samples to untreated controls. (B) LBH589 treatment significantly reduced proliferation of T47Daro and T47DaroLTED cells. Cells were treated same as in (A). (C) Proliferation of the AI-resistant cell line T47DaroLTED was not stimulated by hormone treatment (1 nM estradiol [E2] or 1 nM testosterone [T]). (D) Proliferation of T47Daro cells, but not AI-resistant T47DaroLTED cells, was inhibited by letrozole. Cell proliferation after six days of treatment with the indicated concentrations of letrozole (Let) was measured by MTT assay. *, p < 0.05; **, p < 0.01.
Fig. 2
Fig. 2. LBH589 induced apoptosis and cell cycle arrest in AI-resistance cells
(A) LBH589 suppresses the expression of these apoptosis and cell cycle related molecules in a dose-dependent manner. Western blot analyses were performed on MCF-7aro and Exe-R cells that were treated with DMSO (control) or the indicated concentrations of LBH589 for 48 hours. (B) LBH589 induces cell cycle arrest. Flow cytometric analysis of DNA content of MCF-7aro and Exe-R cells treated with LBH589 (20 nM) or DMSO for 48 hours. Both non-adherent and adherent particles and cells were stained with propidium iodide.
Fig. 3
Fig. 3. Evaluation of the in vivo activity of LBH589
(A) Experimental design to evaluate the LBH589 effects using Exe-resistant mouse xenograft. Exe, exemestane; LBH, LBH589. (B) Tumor volumes (left) and weights (right) of control (exemestane only) and treated (exemestane- and LBH589-treated) mice. (C) Body weights of control and LBH589-treated mice. (D) Immunohistochemical analysis of cell proliferation (Ki-67) and apoptosis (cleaved PARP) in tumors of LBH589-treated mice. Bar, 10 μm in reprehensive picture. Graph showed that percentage of positive stain cells. n=7/group *, p < 0.05
Fig. 4
Fig. 4. Comparison of global gene expression profiles of three LBH589-treated cancer cell lines
(A) Three cell lines (H295R, HeLa and MCF7her2) were treated with 50 nM LBH589 for 4 hours and gene expression analyzed by Affymetrix Human Gene 1.0 ST Array. Expression of 335 genes changed among all three cell lines after treatment. Genes with an FDR-adjusted p-value < 0.05 were considered to be differentially expressed and subjected to Venn analysis. Venn analysis was first performed by analyzing cell-line-specific alterations in differentially expressed genes in each cell line, and then by analyzing overlap between gene lists from different lines. (B) Gene network of down-regulated genes by LBH589. The most down-regulated network identified by Ingenuity Pathway Analysis contains 27 genes.
Fig. 5
Fig. 5. NF-κB1 expression in paired primary and recurrent AI-resistant tumors from the same patients
(A) Photomicrographs of tissue samples immunostained by NF-κB1 antibody showing representative intensity scores. Positive cells show a dark brown or black nuclear signal. These representative tumors obtained a total IHC score of 0.95 (left, proportion score=1.0, intensity score=0.95), 1.9 (middle, proportion score=0.95, intensity score=2), and 2.7 (right, proportion score=0.9, intensity score=3). Scores were calculated from proportion and intensity scores obtained from immunohistochemical evaluation of nuclear NF-κB1. Bar, 10 μm. (B) Graph shows immunohistochemical (IHC) scores of NF-κB1 expression in recurrent tumors and paired primary tumors (*, p < 0.05).
Fig. 6
Fig. 6. Overexpression of NF-κB1 induced AI-resistance and plays an important role for cell proliferation
(A) Basal NF-κB1 mRNA and protein expressions were shown in AI-responsive MCF-7aro cells and AI-resistant cells. mRNA levels were determined by real-time PCR. *, p < 0.01. Protein levels were evaluated by western blotting using indicated antibodies against NF-κB1 and p-NF-κB1. (B) The basal transcriptional activity of NF-κB is higher in AI-resistant cells (LTEDaro and Exe-R) than MCF-7aro, and remarkably higher after TNFα (10 ng/ml) stimulation for an hour. NF-κB activity was evaluated via the pNF-κB-luciferase reporter assay. Luciferase activity was assayed after 24 hours and normalized to total protein concentration. Data are expressed as relative luciferase units (RLU). Columns, mean; bars, SE. *, p < 0.01. (C) siRNA-mediated knockdown of NF-κB1 knockdown significantly suppresses the proliferation of AI-resistant cells. MCF-7aro, LTEDaro, Exe-R, Let-R and Ana-R cells were transfected with control siRNA or NF-κB1 siRNA. Cell viability was assessed by MTT assay for 7 days after transfection. Five replicates were performed for each measurement. *, p < 0.01. (D) Real-time PCR analysis of NF-κB1 mRNA expression after pCMV4 p50 transfection. Gene expression was normalized to β-actin. **, p < 0.01. (E) Over-expression of NF-κB induces AI resistance in AI-responsive MCF-7aro cells. The cells were transfected with mock or pCMV4 p50 (NF-κB1 over-expression) plasmid and treated with letrozole at the indicated concentrations for four days. Cell viability was assessed by MTT assay in triplicate, and the mean and standard error were calculated. Data are shown as a ratio of treated samples to untreated control, mean ± SE.
Fig. 7
Fig. 7. Gene expression changes in the NF-κB signaling pathway in AI-resistant cell lines
(A) LBH589 treatment significantly reduced NF-κB1 mRNA expression. MCF-7aro, LTEDaro, Exe-R, Let-R and Ana-R cells were treated with 20 nM LBH589 for 24 hours. Real-time PCR was performed to evaluate changes in gene expression. Gene expression was normalized to β-actin. *, p < 0.01. (B) Base-line NF-κB1 mRNA expression was higher in T47DaroLTED cells than in T47Daro cells, and decreased in both cell lines after LBH589 treatment. Cells were treated with 20 nM LBH589 for 24 hours, and NF-κB1 mRNA expression was analyzed by real time PCR. Gene expression was normalized to β-actin. *, p < 0.05; **, p < 0.01. (C) MCF-7aro and Exe-R were treated with 20 nM LBH589 for 16 hours, and total RNA was extracted at the indicated time points. Real-time PCR was used to assess expression of NF-κB1, RelA, NF-κB target genes (CFLAR and CCND1), and CDKN1A. Gene expression was normalized to β-actin mRNA. Data are expressed as a ratio of treated samples to untreated controls and shown as mean ± SE.
Fig. 8
Fig. 8. NF-κB1 expression analysis in xenograft tumors treated with LBH589
(A) Tumors from LBH589-treated or control mice (four mice/group) with exemestane-resistant MCF-7aro tumors were harvested 48 hours after mice received a single injection of LBH589. Real time PCR was performed to quantify the levels of NFκB mRNA in tumors. (B) Real time PCR analysis of levels of NF-κB mRNA present in tumors at the end of experiment. n = 7 mice/group. (C) LBH589 decreased cell proliferation in the parental cell line, MCF7aro, in a dose-dependent manner but not in long-term exemestane-treated LTET cells established from MCF-7aro tumors from mice treated with exemestane. The LTET and MCF-7aro cells were treated with the indicated concentrations of exemestane or LBH589 for 6 days and proliferation analyzed by MTT assay. (D) Baseline NF-κB1 mRNA expression was significantly increased in LTET cells as compared to the parental MCF7aro cells, as determined by real-time PCR analysis. *, p < 0.05; **, p < 0.01.
Fig. 9
Fig. 9. Protein expression changes of NF-κB1 and related molecules by LBH589 treatment
(A) LBH589 suppressed NF-κB1 (p50) and it phosphorylated form protein expression in a dose-dependent manner. Also, blots were probed with the indicated antibodies against NF-κB downstream molecules (cFLIP) and LBH589 targets (AKT and ER ). LBH589 suppresses the expression of these molecules in a dose-dependent manner. Western blot analyses were performed on MCF-7aro and Exe-R cells that were treated with DMSO (control) or the indicated concentrations of LBH589 for 48 hours. (B) Levels of NF-κB1 and p-NF-κB1 were decreased in both nuclear and cytoplasm in a dose-dependent manner. Cells were fractionated into cytoplasm and nuclear fractions after treatment with DMSO or LBH589 for 48 hours, and protein levels of interesting proteins in the cytoplasm and nucleus were examined by western blotting. Lamin A/C (70kD) was used as a nuclear marker.

Similar articles

Cited by

References

    1. Josefsson ML, Leinster SJ. Aromatase inhibitors versus tamoxifen as adjuvant hormonal therapy for oestrogen sensitive early breast cancer in post-menopausal women: meta-analyses of monotherapy, sequenced therapy and extended therapy. Breast (Edinburgh, Scotland) 2010;19 (2):76–83. - PubMed
    1. Cuzick J, Sestak I, Baum M, Buzdar A, Howell A, Dowsett M, Forbes JF. Effect of anastrozole and tamoxifen as adjuvant treatment for early-stage breast cancer: 10-year analysis of the ATAC trial. Lancet Oncol. 2010;11 (12):1135–1141. - PubMed
    1. van de Velde CJ, Rea D, Seynaeve C, Putter H, Hasenburg A, Vannetzel JM, Paridaens R, Markopoulos C, Hozumi Y, Hille ET, Kieback DG, Asmar L, Smeets J, Nortier JW, Hadji P, Bartlett JM, Jones SE. Adjuvant tamoxifen and exemestane in early breast cancer (TEAM): a randomised phase 3 trial. Lancet. 2011;377 (9762):321–331. - PubMed
    1. Regan MM, Neven P, Giobbie-Hurder A, Goldhirsch A, Ejlertsen B, Mauriac L, Forbes JF, Smith I, Lang I, Wardley A, Rabaglio M, Price KN, Gelber RD, Coates AS, Thurlimann B. Assessment of letrozole and tamoxifen alone and in sequence for postmenopausal women with steroid hormone receptor-positive breast cancer: the BIG 1–98 randomised clinical trial at 8.1 years median follow-up. Lancet Oncol. 2011;12 (12):1101–1108. - PMC - PubMed
    1. Wong C, Chen S. The development, application and limitations of breast cancer cell lines to study tamoxifen and aromatase inhibitor resistance. The Journal of steroid biochemistry and molecular biology 2012 - PMC - PubMed

Publication types

MeSH terms