

Automated measurement of blood flow velocity and direction and hemoglobin oxygen saturation in the rat lung using intravital microscopy
- PMID: 23161885
- PMCID: PMC9762732
- DOI: 10.1152/ajplung.00178.2012
Automated measurement of blood flow velocity and direction and hemoglobin oxygen saturation in the rat lung using intravital microscopy
Abstract
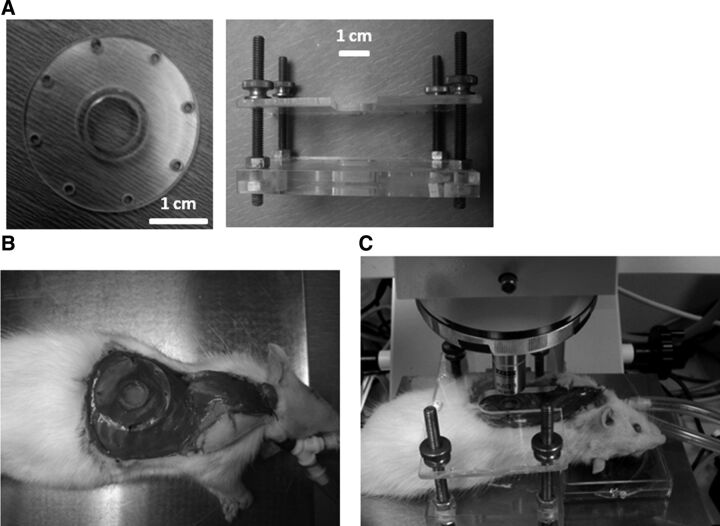
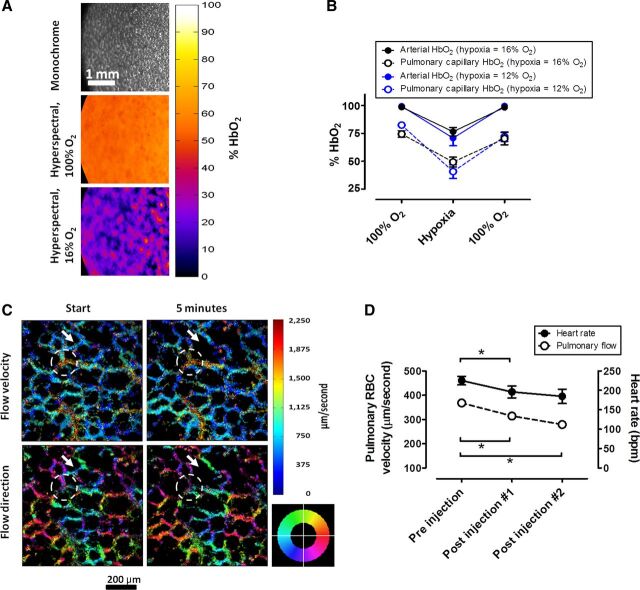
Intravital microscopy of the pulmonary microcirculation in research animals is of great scientific interest for its utility in identifying regional changes in pulmonary microcirculatory blood flow. Although feasibility studies have been reported, the pulmonary window can be further refined into a practical tool for pharmaceutical research and drug development. We have established a method to visualize and quantify dynamic changes in three key features of lung function: microvascular red blood cell velocity, flow direction, and hemoglobin saturation. These physiological parameters were measured in an acute closed-chest pulmonary window, which allows real-time images to be captured by fluorescence and multispectral absorption microscopy; images were subsequently quantified using computerized analysis. We validated the model by quantifying changes in microcirculatory blood flow and hemoglobin saturation in two ways: 1) after changes in inspired oxygen content and 2) after pharmacological reduction of pulmonary blood flow via treatment with the β1 adrenergic receptor blocker metoprolol. This robust and relatively simple system facilitates pulmonary intravital microscopy in laboratory rats for pharmacological and physiological research.
Figures
Similar articles
-
Automated measurement of microcirculatory blood flow velocity in pulmonary metastases of rats.J Vis Exp. 2014 Nov 30;(93):e51630. doi: 10.3791/51630. J Vis Exp. 2014. PMID: 25490280 Free PMC article.
-
Oxygen saturation, red blood cell tissue fraction and speed resolved perfusion - A new optical method for microcirculatory assessment.Microvasc Res. 2015 Nov;102:70-7. doi: 10.1016/j.mvr.2015.08.006. Epub 2015 Aug 13. Microvasc Res. 2015. PMID: 26279347
-
Microhemodynamic parameters quantification from intravital microscopy videos.Physiol Meas. 2014 Mar;35(3):351-67. doi: 10.1088/0967-3334/35/3/351. Epub 2014 Jan 30. Physiol Meas. 2014. PMID: 24480871 Free PMC article.
-
The physiologic role of erythrocytes in oxygen delivery and implications for blood storage.Crit Care Nurs Clin North Am. 2014 Sep;26(3):325-35. doi: 10.1016/j.ccell.2014.04.002. Crit Care Nurs Clin North Am. 2014. PMID: 25169686 Review.
-
[Observation and RBC velocity measurement of microcirculation].Tanpakushitsu Kakusan Koso. 1997 May;42(7 Suppl):1106-12. Tanpakushitsu Kakusan Koso. 1997. PMID: 9170932 Review. Japanese. No abstract available.
Cited by
-
A hyperspectral vessel image registration method for blood oxygenation mapping.PLoS One. 2017 Jun 1;12(6):e0178499. doi: 10.1371/journal.pone.0178499. eCollection 2017. PLoS One. 2017. PMID: 28570589 Free PMC article.
-
Measuring blood oxygen saturation along a capillary vessel in human.Biomed Opt Express. 2017 Oct 30;8(11):5342-5348. doi: 10.1364/BOE.8.005342. eCollection 2017 Nov 1. Biomed Opt Express. 2017. PMID: 29188124 Free PMC article.
-
Quantitative mapping of hemodynamics in the lung, brain, and dorsal window chamber-grown tumors using a novel, automated algorithm.Microcirculation. 2013 Nov;20(8):724-35. doi: 10.1111/micc.12072. Microcirculation. 2013. PMID: 23781901 Free PMC article.
-
Effects of high-dose microbeam irradiation on tumor microvascular function and angiogenesis.Radiat Res. 2015 Feb;183(2):147-58. doi: 10.1667/RR13712.1. Epub 2015 Jan 9. Radiat Res. 2015. PMID: 25574586 Free PMC article.
-
Hyperspectral wide-field-of-view imaging to study dynamic microcirculatory changes during hypoxia.Am J Physiol Heart Circ Physiol. 2022 Jul 1;323(1):H49-H58. doi: 10.1152/ajpheart.00624.2021. Epub 2022 May 6. Am J Physiol Heart Circ Physiol. 2022. PMID: 35522555 Free PMC article.
References
-
- Baker M , Wayland H. On-line volume flow rate and velocity profile measurement for blood in microvessels. Microvasc Res 7: 131–143, 1974. - PubMed
-
- Bhattacharya J. Seeing is believing. Nat Methods 8: 57–58, 2011. - PubMed
-
- Bickenbach J , Dembinski R , Czaplik M , Meissner S , Tabuchi A , Mertens M , Knels L , Schroeder W , Pelosi P , Koch E , Kuebler WM , Rossaint R , Kuhlen R. Comparison of two in vivo microscopy techniques to visualize alveolar mechanics. J Clin Monit Comput 23: 323–332, 2009. - PubMed
-
- Cucherat M , Borer JS. Reduction of resting heart rate with antianginal drugs: review and meta-analysis. Am J Ther 19: 269–280, 2012. - PubMed
-
- Fingar VH , Taber SW , Wieman TJ. A new model for the study of pulmonary microcirculation: determination of pulmonary edema in rats. J Surg Res 57: 385–393, 1994. - PubMed
Publication types
MeSH terms
Substances
Grants and funding
LinkOut - more resources
Full Text Sources
Other Literature Sources