. 2012 Nov 16:6:54.
doi: 10.3389/fncel.2012.00054. eCollection 2012.

Temporal response dynamics of Drosophila olfactory sensory neurons depends on receptor type and response polarity

Affiliations

Temporal response dynamics of Drosophila olfactory sensory neurons depends on receptor type and response polarity

Merid N Getahun et al. Front Cell Neurosci. .

Abstract

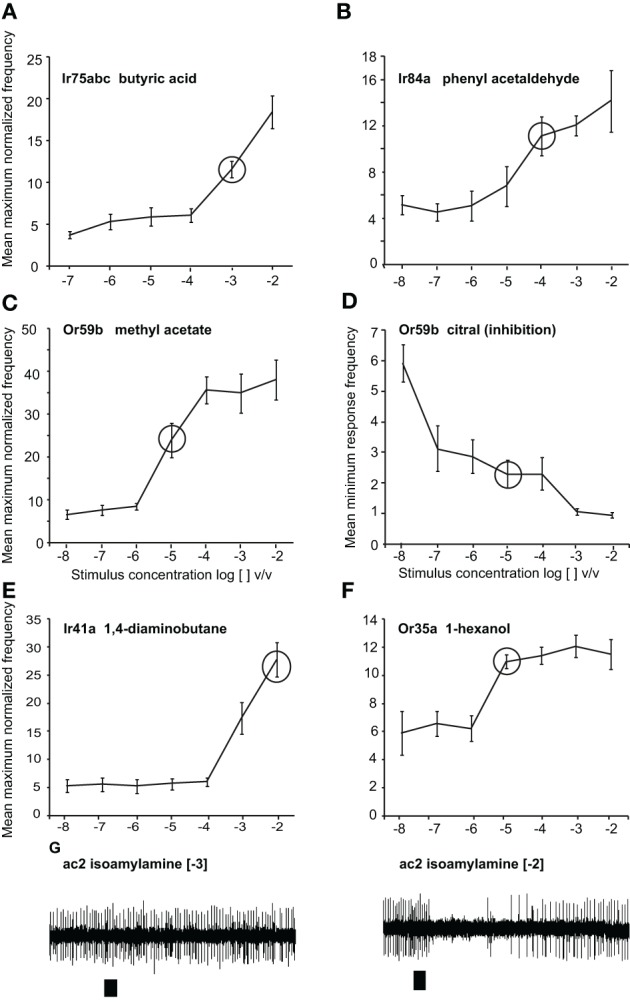
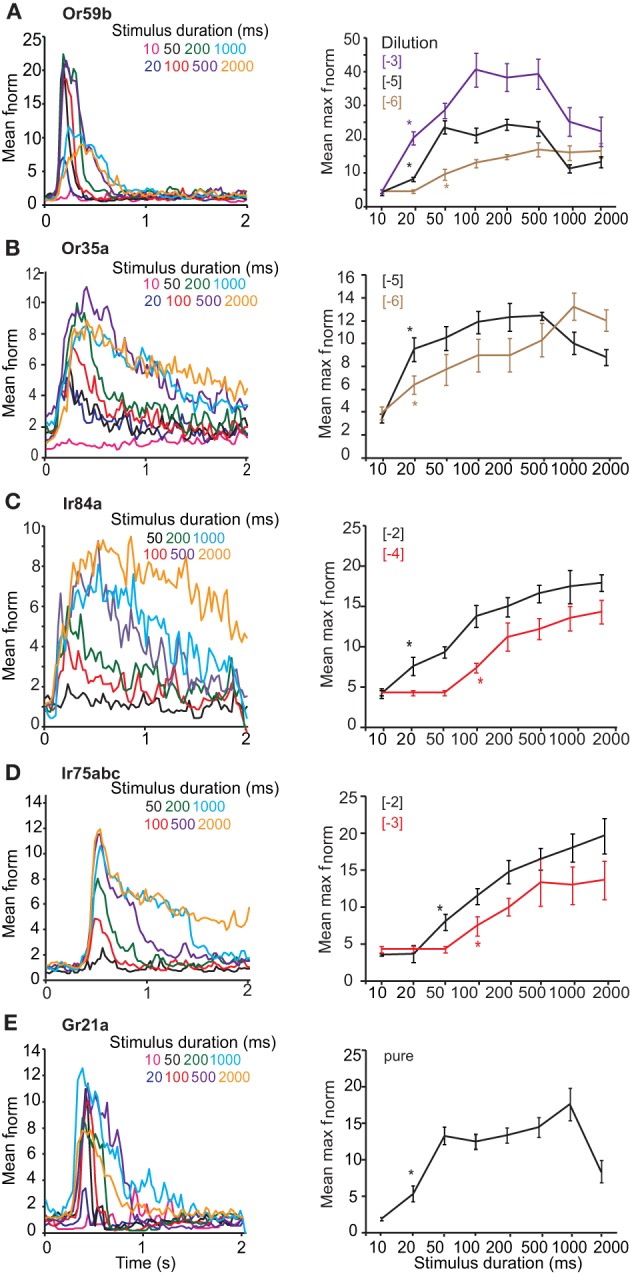
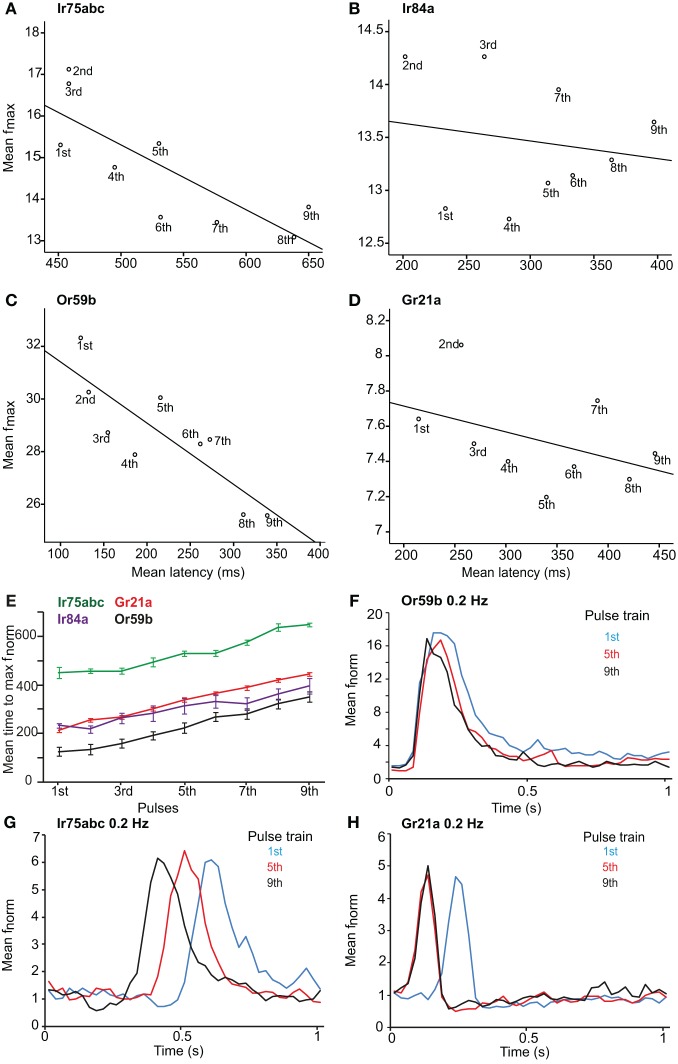
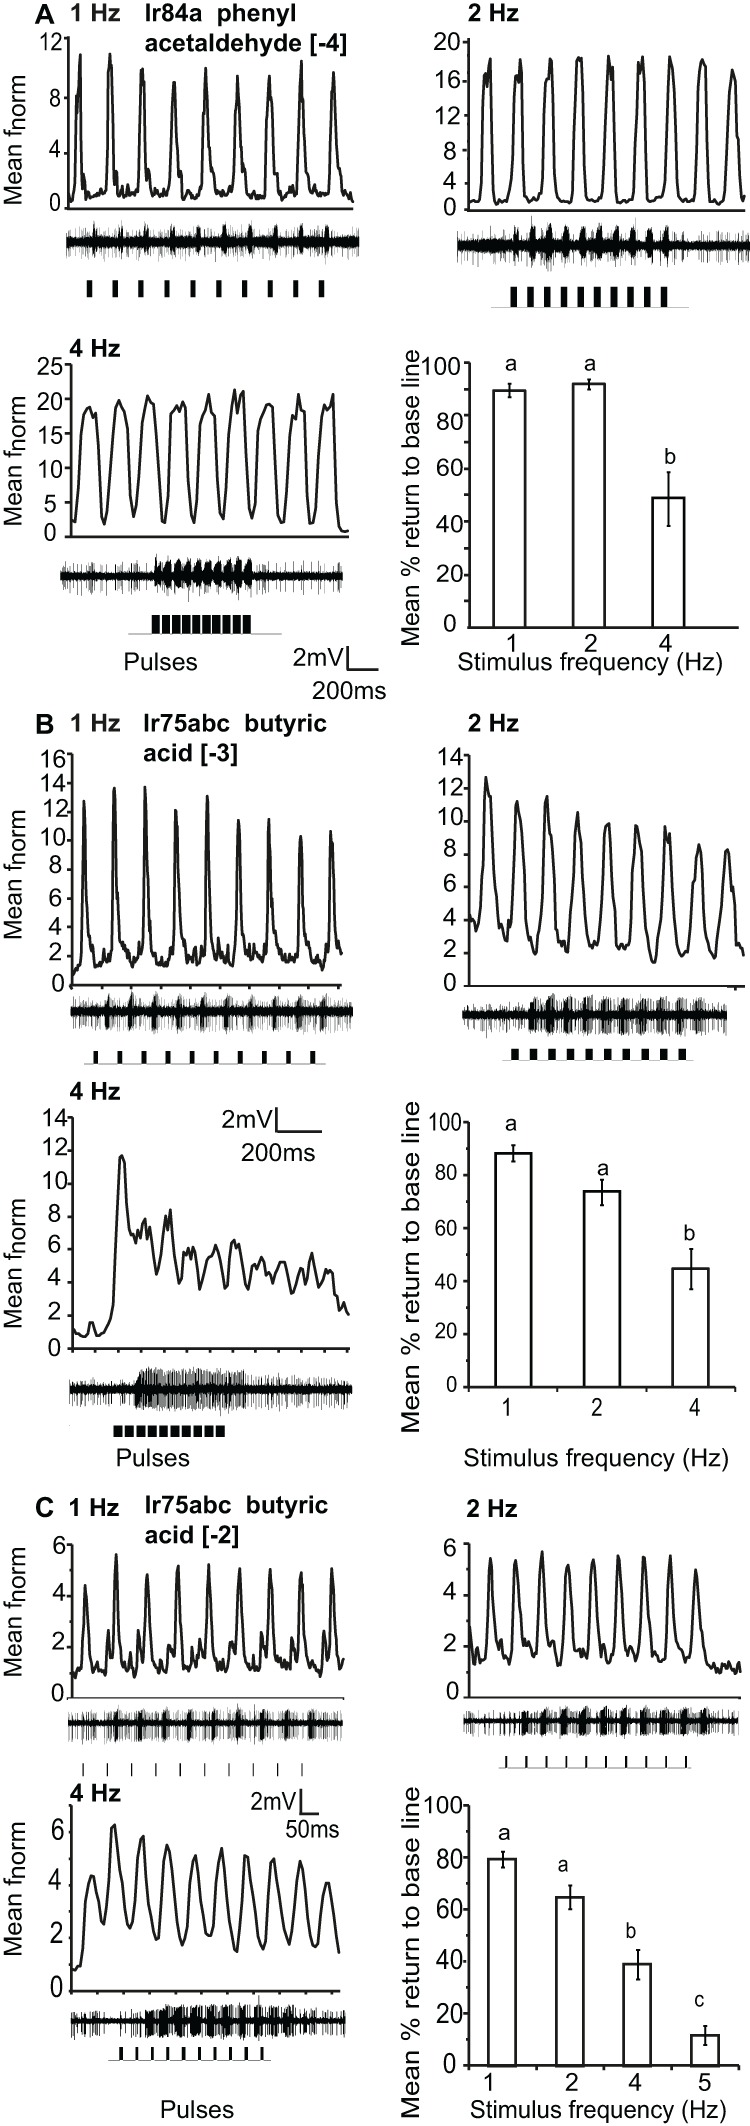
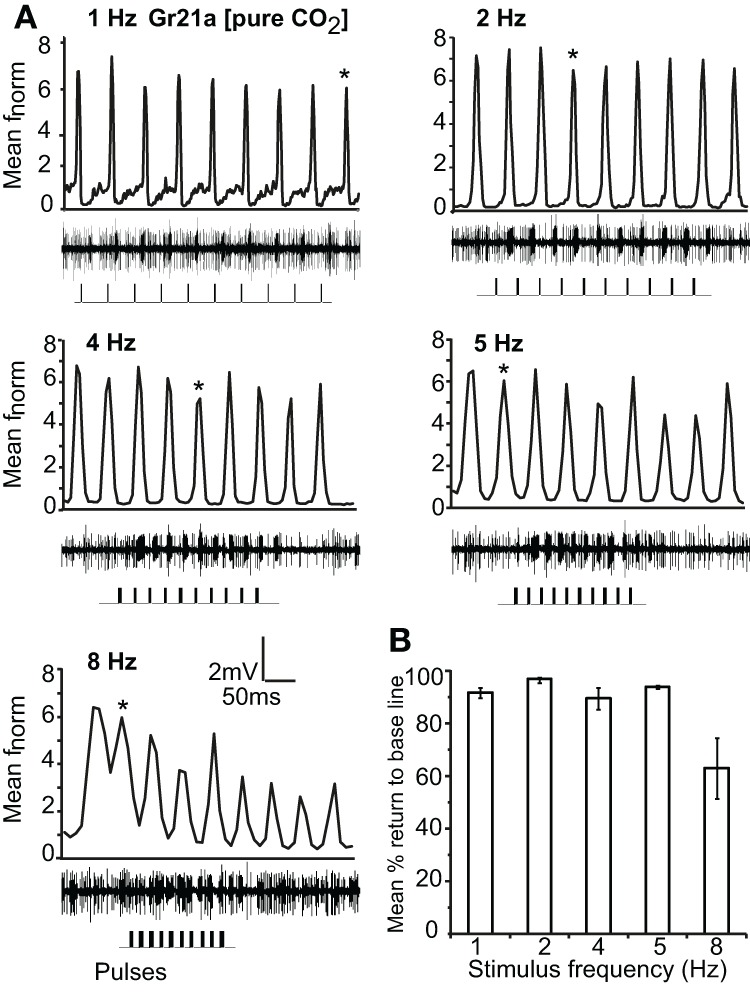
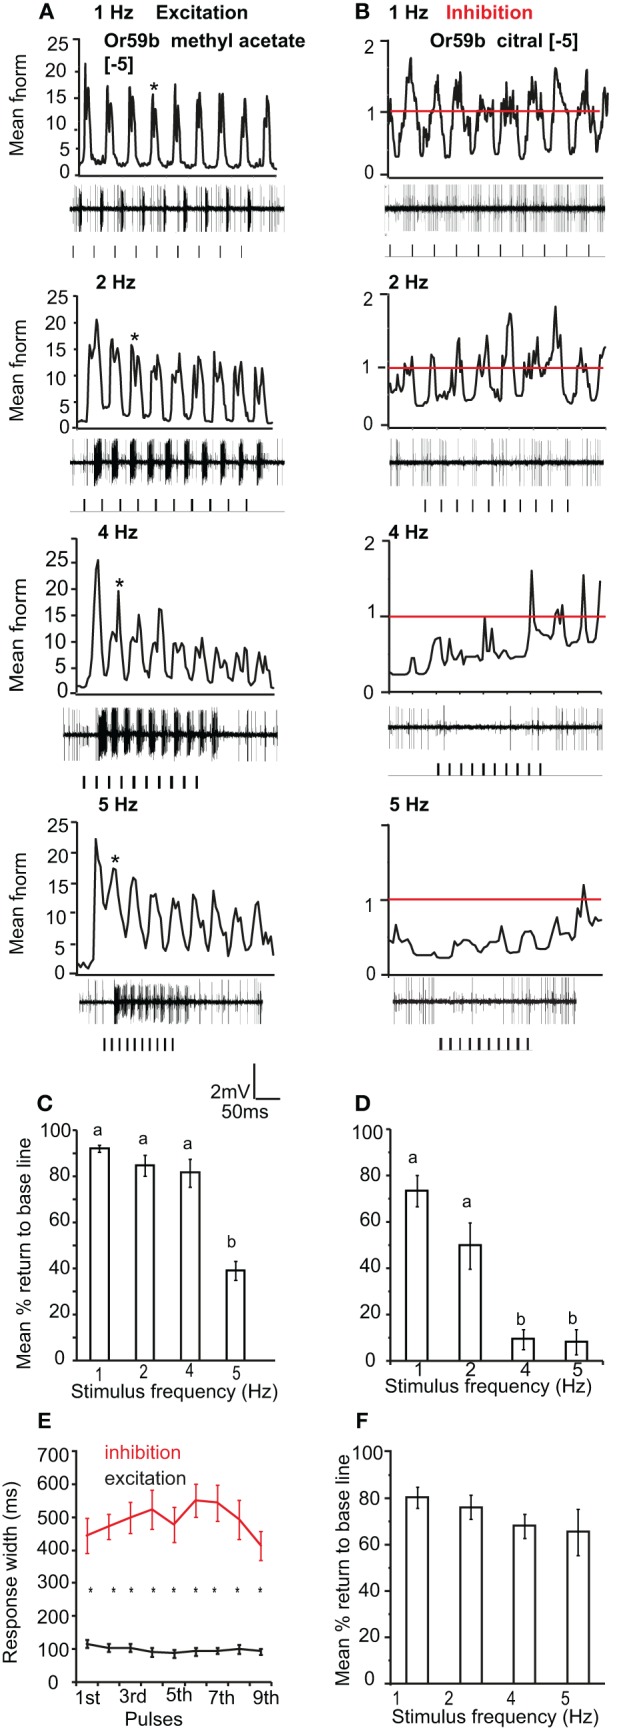
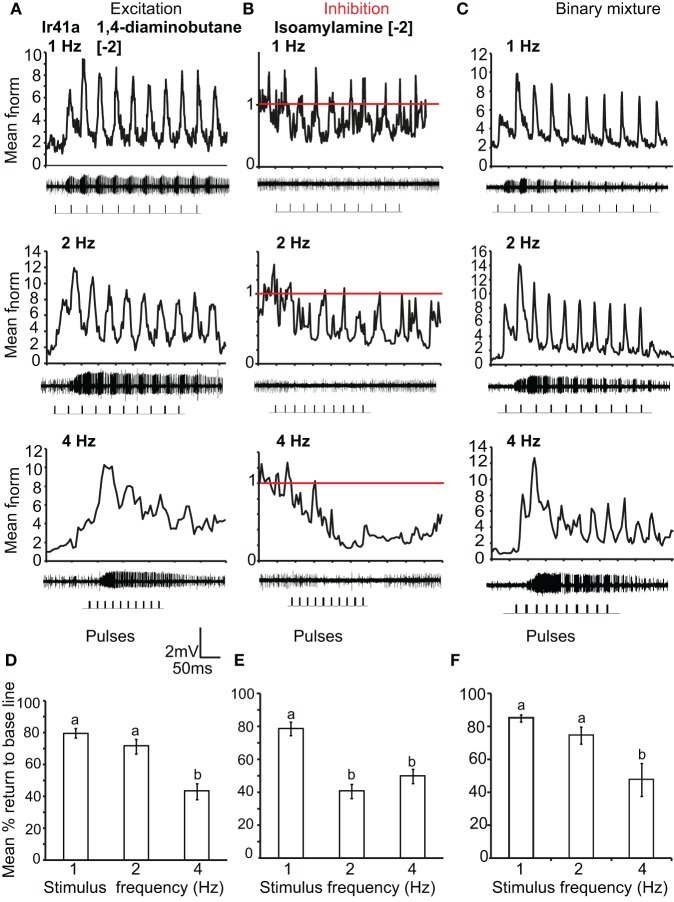
Insect olfactory sensory neurons (OSN) express a diverse array of receptors from different protein families, i.e. ionotropic receptors (IR), gustatory receptors (GR) and odorant receptors (OR). It is well known that insects are exposed to a plethora of odor molecules that vary widely in both space and time under turbulent natural conditions. In addition to divergent ligand specificities, these different receptors might also provide an increased range of temporal dynamics and sensitivities for the olfactory system. To test this, we challenged different Drosophila OSNs with both varying stimulus durations (10-2000 ms), and repeated stimulus pulses of key ligands at various frequencies (1-10 Hz). Our results show that OR-expressing OSNs responded faster and with higher sensitivity to short stimulations as compared to IR- and Gr21a-expressing OSNs. In addition, OR-expressing OSNs could respond to repeated stimulations of excitatory ligands up to 5 Hz, while IR-expressing OSNs required ~5x longer stimulations and/or higher concentrations to respond to similar stimulus durations and frequencies. Nevertheless, IR-expressing OSNs did not exhibit adaptation to longer stimulations, unlike OR- and Gr21a-OSNs. Both OR- and IR-expressing OSNs were also unable to resolve repeated pulses of inhibitory ligands as fast as excitatory ligands. These differences were independent of the peri-receptor environment in which the receptors were expressed and suggest that the receptor expressed by a given OSN affects both its sensitivity and its response to transient, intermittent chemical stimuli. OR-expressing OSNs are better at resolving low dose, intermittent stimuli, while IR-expressing OSNs respond more accurately to long-lasting odor pulses. This diversity increases the capacity of the insect olfactory system to respond to the diverse spatiotemporal signals in the natural environment.

Keywords: ionotropic receptors; odorant receptors; pulse resolution; single sensillum recording.


Figures

Figure 1
Figure 1
Responses to odors at different doses. Dose-response curves presented as normalized maximum frequency response for (A) Ir75abc-expressing neurons to butyric acid n = 8–13 (B) Ir84a-expressing neurons to phenylacetaldehyde, n = 9–12. (C), Or59b-expressing neurons to methyl acetate, n = 8–17 (D) Or59b-expressing neurons to citral presented as the minimum frequency, n = 6–10. (E) Ir41a-expressing neurons to 1, 4-diaminobutane n = 6–8 (F). Or35a-expressing OSNs to 1-hexanol, n = 6–8. (G) Representative traces showing the response of OSNs of ac2 sensilla to isoamylamine at two different concentrations (responses to lower concentrations were not observed). Please note that while only Ir41a-expressing neurons are excited by 1, 4-diaminobutane in this sensillum (ac2), all neurons are inhibited by isoamylamine, and we thus label the inhibitory responses with the entire sensillum label.
Figure 2
Figure 2
Response of OSNs to varying stimulus durations. (A, left) Mean peri-stimulus time histograms (PSTHs, 25 ms bins) showing the response of Or59b-expressing OSNs to various stimulus durations of log [−5] v/v methyl acetate. (A, right) Mean normalized maximum frequency for Or59b-expressing neurons plotted vs. stimulus duration (n = 8–15) for three different concentrations. Asterisks indicate the minimum stimulus duration that elicited a significant response, P < 0.05. (B, left) Mean peri-stimulus time histograms as in (A) showing the response of Or35a-expressing OSNs to various stimulus durations of log [−5] v/v 1-hexanol. (B, right) Mean normalized maximum frequency for Or35a-expressing neurons plotted versus stimulus duration for log [−5] and [−6] v/v of 1-hexanol (n = 6–14). (C, left) Response of Ir84a-expressing neurons to various durations of log [−4] v/v phenyl acetaldehyde as in (A), n = 8–10 (C, right) as in A for two different concentrations. (D, left) Response of Ir75abc-expressing neurons to various durations of log [−3] v/v butyric acid (n = 6–15) and (D, right) as in (C). (E) Response of Gr21a-expressing neurons to pure CO2 at different stimulus durations (n = 6–10).
Figure 3
Figure 3
Latency and maximum response of OSNs to repeated stimuli. Maximum response frequency vs. time to peak (latency), with best fit line, for OSNs carrying various receptors in response to repeated 1 Hz stimulations. (A) Ir75abc, (B) Ir84a, (C) Or59b and (D) Gr21a. Pulse number (1–9) indicated below each point. (E) Mean time to maximum response frequency for neurons in (A–D) at a 1 Hz repeated stimulation. (F) The response onset recovery of Or59b-expressing OSNs when stimulated at 0.2 Hz, n = 10 (G) as in (F) for Ir75abc-expressing OSNs, n = 7 and (H) as in (F) for Gr21a-expressing OSNs, n = 10.
Figure 4
Figure 4
Response of OSNs to repeated stimulus pulses at varying frequencies. (A) Average normalized PSTH responses for Ir84a-expressing neurons in response to repeated pulses of log [−4] v/v phenyl acetaldehyde at listed frequencies. Traces below each panel show sample 200 ms recordings. Square pulses indicate stimulus presentation. The final panel shows the mean percent return to base line across all pulses at listed frequencies; error bars indicate SEM (ANOVA, P < 0.05, followed by Tukey post-hoc, n = 7–9). (B) Response of Ir75abc-expressing neurons to repeated stimulations of log [−3] v/v butyric acid stimulation as in (A) (ANOVA, P < 0.05, followed by Tukey post-hoc (n = 8–10). (C) Response as in (B) to a 10× concentration of butyric acid (log [−2]); ANOVA, P < 0.05, followed by Tukey post-hoc, n = 14–15).
Figure 5
Figure 5
Response of Gr21a-expressing OSNs to repeated stimulus pulses at varying frequencies. (A) Average normalized PSTH responses of Gr21a-expressing neurons to repeated pulses of pure CO2 at listed frequencies. Traces below each panel show sample 50 ms recordings. Square pulses indicate stimulus presentation. (B) Mean percent return to base line across all pulses of listed frequencies, error bars indicate SEM (ANOVA, P < 0.05, followed by Tukey post-hoc test, n = 11–12).
Figure 6
Figure 6
OR-expressing OSN response polarity and pulse resolution. (A) Mean normalized PSTH response of Or59b-expressing OSNs to repeated pulses of log [−5] v/v methyl acetate at listed frequencies. Traces below each panel show sample 50 ms recordings. Square pulses indicate stimulus presentation. (B) Mean normalized PSTH response of Or59b-expressing OSNs to repeated pulses of log [−5] v/v citral (an inhibitory odor) at listed frequencies as in (A). Red line indicates baseline frequency. (C) Mean percent return to base line across all pulses for Or59b-OSN response to methyl acetate, error bars indicate SEM (ANOVA, P < 0.05, followed by Tukey post-hoc test, n = 9–13) and (D) as in (C) for citral (ANOVA, P < 0.05, followed by Tukey post-hoc test, n = 13–15). (E) Mean response width of Or59b-expressing OSNs for excitation and inhibition. (F) Mean percent return to base line in response to a pulsed binary mixture of methyl acetate and citral, error bars indicate SEM, (P > 0.05 ANOVA, n = 8–9).
Figure 7
Figure 7
IR-expressing OSN response polarity and pulse resolution. (A) Mean normalized PSTH response of Ir41a-expressing OSNs to repeated pulses of log [−2] v/v 1, 4-diaminobutane at listed frequencies. Traces below each panel show sample 50 ms recordings. Square pulses indicate stimulus presentation. (B) As in (A) for log [−2] v/v of the inhibitory odor isoamyl amine. Red line indicates baseline frequency. (C) Mean normalized PSTH response of Ir41a-expressing OSNs to a binary mixture of 1, 4-diaminobutane and isoamyl amine at [−2] v/v. (D) Mean percent return to base line to the excitatory ligand across all pulses at listed frequencies, error bars indicate SEM (ANOVA, P < 0.05, followed by Tukey post-hoc test, n = 7–8) (E), as in (D) for log [−2] v/v of the inhibitory odor isoamyl amine (ANOVA, P < 0.05, followed by Tukey post-hoc test; n = 7–9). (F) as in (D) for the binary mixture (ANOVA, P < 0.05, followed by Tukey post-hoc test, n = 7–9).

Similar articles

Cited by

References

    1. Ai M., Min S., Grosjean Y., Leblanc C., Bell R., Benton R., et al. (2010). Acid sensing by the Drosophila olfactory system. Nature 468, 691–695 10.1038/nature09537 - DOI - PMC - PubMed
    1. Baker T. C., Hansson B. S., Löfsted C., Löfqvist J. (1988). Adaptation of antennal neurons in moths is associated with cessation of pheromone-mediated upwind flight. Proc. Natl. Acad. Sci. U.S.A. 85, 9826–9830 - PMC - PubMed
    1. Baker T. C., Vickers N. J. (1997). Pheromone-mediated flight in moths, In Pheromone Research: New Directions. ed Cardé R. T. (Minks AK. New York: Chapman and Hall; ), 248–264
    1. Barrozo R. B., Kaissling K.-E. (2002). Repetitive stimulation of olfactory receptor cells in female silkmoths Bombyx mori L. J. Insect Physiol. 48, 825–834 10.1016/S0022-1910(02)00109-9 - DOI - PubMed
    1. Bau J., Justus K. A., Carde' R. T. (2002). Antennal resolution of pulsed pheromone plumes in three moth species. J. Insect Physiol. 48, 433–442 10.1016/S0022-1910(02)00062-8 - DOI - PubMed