. 2012 Nov 16:6:85.
doi: 10.3389/fncir.2012.00085. eCollection 2012.

Competition from newborn granule cells does not drive axonal retraction of silenced old granule cells in the adult hippocampus

Affiliations

Competition from newborn granule cells does not drive axonal retraction of silenced old granule cells in the adult hippocampus

Carla M Lopez et al. Front Neural Circuits. .

Abstract

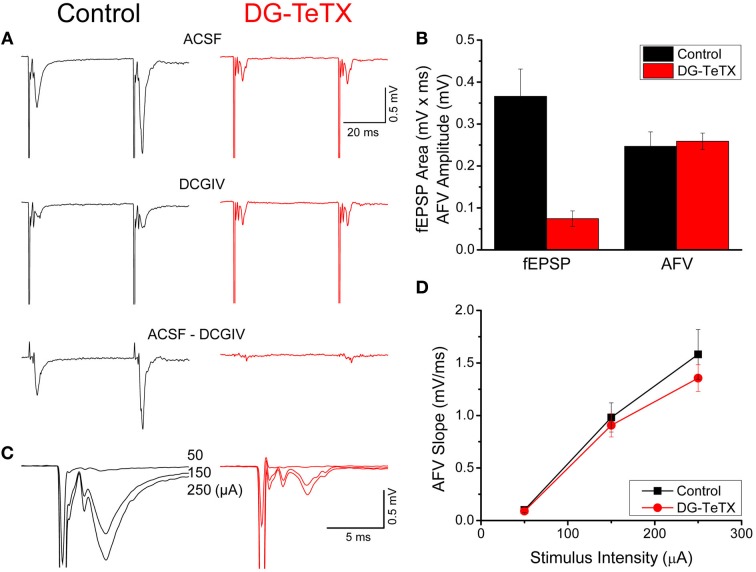
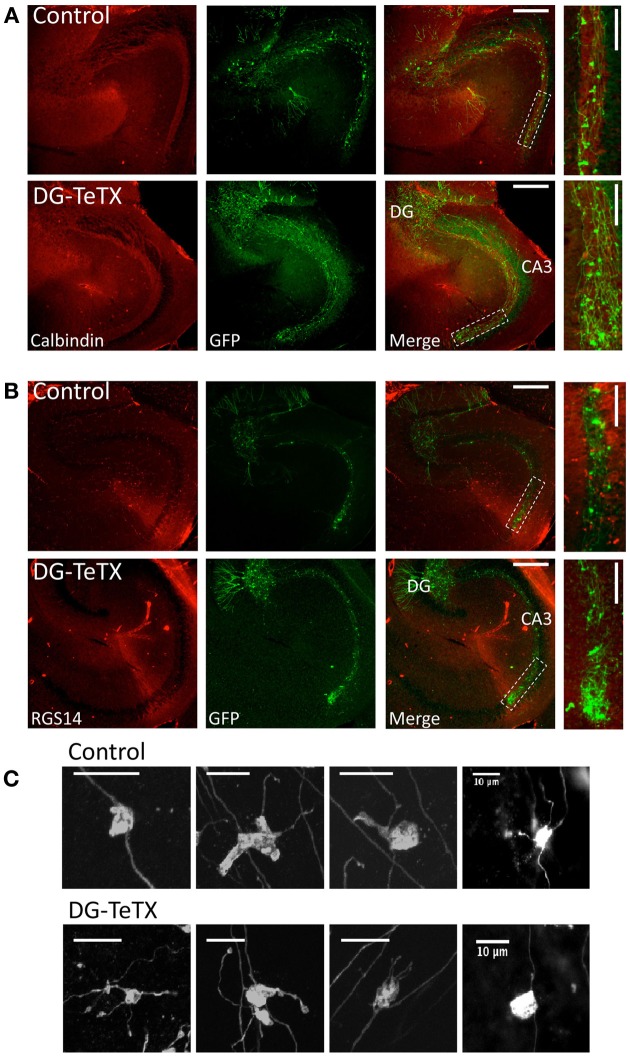
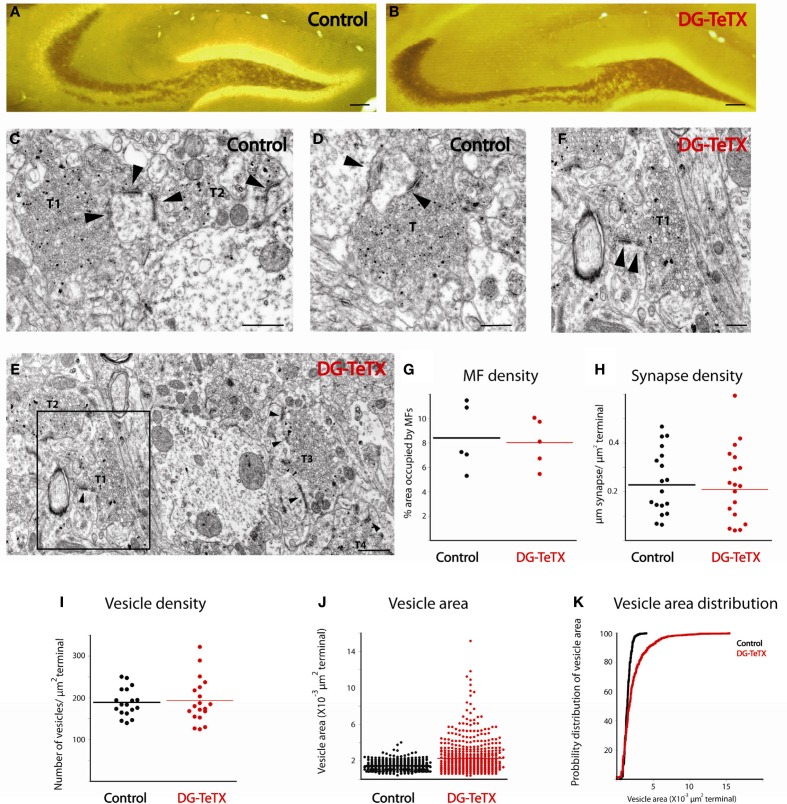
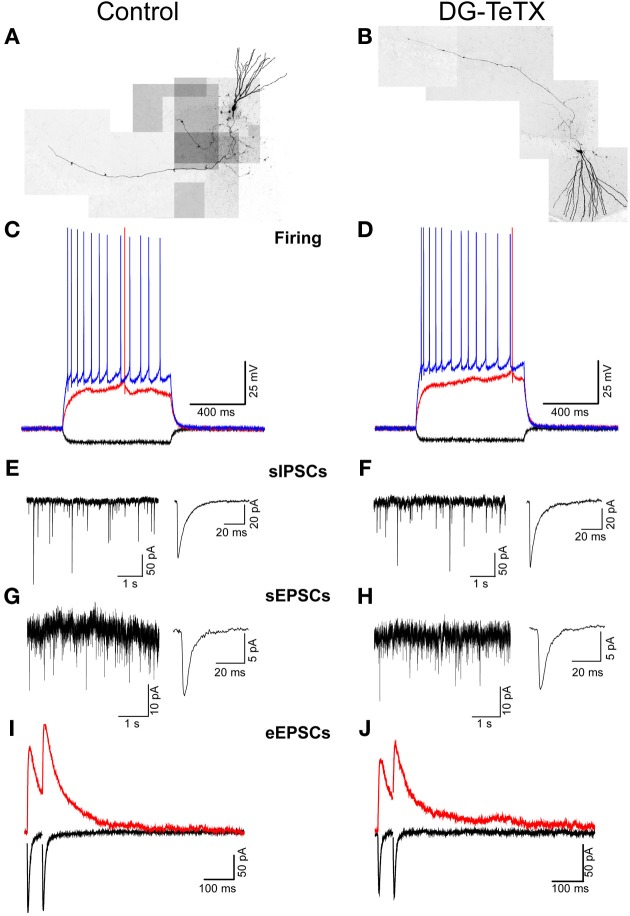
In the developing nervous system synaptic refinement, typified by the neuromuscular junction where supernumerary connections are eliminated by axon retraction leaving the postsynaptic target innervated by a single dominant input, critically regulates neuronal circuit formation. Whether such competition-based pruning continues in established circuits of mature animals remains unknown. This question is particularly relevant in the context of adult neurogenesis where newborn cells must integrate into preexisting circuits, and thus, potentially compete with functionally mature synapses to gain access to their postsynaptic targets. The hippocampus plays an important role in memory formation/retrieval and the dentate gyrus (DG) subfield exhibits continued neurogenesis into adulthood. Therefore, this region contains both mature granule cells (old GCs) and immature recently born GCs that are generated throughout adult life (young GCs), providing a neurogenic niche model to examine the role of competition in synaptic refinement. Recent work from an independent group in developing animals indicated that embryonically/early postnatal generated GCs placed at a competitive disadvantage by selective expression of tetanus toxin (TeTX) to prevent synaptic release rapidly retracted their axons, and that this retraction was driven by competition from newborn GCs lacking TeTX. In contrast, following 3-6 months of selective TeTX expression in old GCs of adult mice we did not observe any evidence of axon retraction. Indeed ultrastructural analyses indicated that the terminals of silenced GCs even maintained synaptic contact with their postsynaptic targets. Furthermore, we did not detect any significant differences in the electrophysiological properties between old GCs in control and TeTX conditions. Thus, our data demonstrate a remarkable stability in the face of a relatively prolonged period of altered synaptic competition between two populations of neurons within the adult brain.

Keywords: Moloney virus; activity-dependent circuit refinement; hippocampal; mossy fibers; neurogenesis; tetanus toxin.


Figures

Figure 1
Figure 1
Impaired MF-CA3 transmission but normal MF excitability in activated DG-TeTX mice. (A) Representative fEPSP waveforms recorded in CA3 stratum lucidum evoked by stimulation in the DG GC layer obtained in control and activated DG-TeTX (DG-TeTX) mice in control (ACSF, upper traces) and DCGIV (1 μM) containing ACSF (DCGIV, middle traces). Traces are the average of 6 consecutive individual sweeps obtained in each condition (scale bars 20 ms/0.5 mV). The pure MF-CA3-mediated fEPSP is obtained by digital subtraction of the DCGIV condition waveform from the control condition waveform (bottom traces). (B) Group data bar chart summary of the MF-CA3 fEPSP areas and AFV amplitudes observed in control (n = 10 slices from 7 animals) and DG-TeTX (n = 7 slices from 5 animals) mice. (C) Representative fEPSP waveforms from control and DG-TeTX mice obtained at the three different stimulus intensities indicated (traces are the average of 6 events obtained at each stimulus intensity, scale bars 5 ms/0.5 mV). (D) AFV input-output functions for control (n = 8 slices from 5 mice) and activated DG-TeTX mice (n = 10 slices, from 5 mice).
Figure 2
Figure 2
Normal MF projection throughout CA3 stratum lucidum in activated DG-TeTX mice. (A) Representative images of hippocampal sections obtained from control (upper panels) and activated DG-TeTX mice (lower panels) stained for calbindin (red) to label stratum lucidum and GFP (green) to label silenced old GCs (at least 3 months of age) that were infected with GFP encoding Moloney Virus at their time of genesis (scale bars 300 μm). Boxed region in the merged images indicate regions that were digitally magnified in images at the far right (scale bars 100 μm). (B) Similar to (A) except that the sections were stained for GFP (green) and RGS14 (red) to label CA2 pyramidal cells demarcating the distal boundary of CA3. (C) Images of representative GFP labeled MFBs from old GCs in sections from control (upper panels) and activated DG-TeTX mice (lower panels). Similar observations were obtained in a total of 5 mutant and 4 control mice examined 3–6 months after viral infection and maintained under Dox free conditions for this entire period (mutant mice were examined at 100, 127, 182, 182, and 178 days postinfection and control mice were examined in parallel at 100, 127, 189, and 162 days postinfection).
Figure 3
Figure 3
Ultrastructural comparison of active and silenced MF terminals. (A,B) Mossy fiber tracks in representative sections from control (A) and DG-TeTX (B) mice are labeled with neoTimm staining. (C–F) Representative electron micrographs demonstrate that mossy fiber terminals (T) form multiple synaptic contacts (arrowheads) with their postsynaptic targets in control (C,D) and in DG-TeTX (E,F) mice. Zinc-labeled terminals (T1–T3) are abundant in the stratum lucidum of DG-TeTX samples (E), T1 is shown in panel F at higher magnification where the high degree of variability in vesicle size is clearly evident. (G) The density of mossy fibers measured as a ratio of the percentage of surface area covered by zinc-positive large presynaptic specializations was similar in the stratum lucidum of control and DG-TeTX animals (n = 5 sections per animal, 1 mouse per genotype). (H,I) Synapse density (H, n = 20 terminals examined across the 5 sections for each genotype) and vesicle density (I, n = 20 terminals examined across the 5 sections for each genotype) was also comparable between the two groups. (J) Plots of vesicle area reveal a typical uniform vesicle size in control samples but a higher degree of variability in DG-TeTX mice. (K) Cumulative probability distribution of vesicle size measurements plotted in (J) revealing the skew toward larger vesicles in DG-TeTX mice (n = 620 vesicles in 20 terminals across 5 sections from 1 mouse per genotype). Scale bars: (A,B: 200 μm, C–E: 400 nm, F: 800 nm).
Figure 4
Figure 4
Prolonged blockade of the synaptic output from old GCs does not alter their electrophysiological characteristics. (A,B) Composite images of representative old GCs recorded in slices from control (A) and activated DG-TeTX (B) mice. (C,D) Traces from representative recordings obtained in old GCs of control (C) and activated DG-TeTX mice (D) showing membrane responses to hyperpolarizing (−50 pA; black traces), just threshold level depolarizing (red traces) and twice threshold level depolarizing (blue traces) current pulses. (E–H) Representative gap-free traces of pharmacologically isolated spontaneous GABAA receptor- and AMPA receptor-mediated IPSCs (E,F) and EPSCs (G,H) with ensemble averages (right traces) obtained in old GCs of control (E,G) and DG-TeTX (F,H) mice. (I,J) Paired pulse (50 ms inter-stimulus interval) perforant path-evoked EPSCs at a holding potential of −70 mV (black traces, to monitor the AMPAR-mediated component) and at a holding potential of +40 mV (red traces, to reveal the NMDAR-mediated component) in representative recordings from old GCs in control (I) and DG-TeTX (J) mice.
Figure 5
Figure 5
Normal LTP of perforant path inputs to old GCs in activated DG-TeTX mice. (A,B) The upper panels are pooled data time course plots showing LTP of perforant path-evoked AMPA receptor-mediated EPSCs in response to a theta burst induction protocol in old GCs of control (A, n = 5 cells from 3 animals) and activated DG-TeTX (B, n = 6 cells from 4 animals) mice. Inset traces show EPSCs taken at the times indicated on the x-axis. Lower panels show the corresponding pooled data time course plots of the paired pulse ratios for AMPA receptor-mediated EPSC peak amplitudes (PPRS) in control and activated DG-TeTX mice.

References

    1. Amaral D. G., Dent J. A. (1981). Development of the mossy fibers of the dentate gyrus: I. A light and electron microscopic study of the mossy fibers and their expansions. J. Comp. Neurol. 195, 51–86 10.1002/cne.901950106 - DOI - PubMed
    1. Antonini A., Stryker M. P. (1993). Rapid remodeling of axonal arbors in the visual cortex. Science 260, 1819–1821 - PubMed
    1. Bergami M., Berninger B. (2012). A fight for survival: the challenges faced by a newborn neuron integrating in the adult hippocampus. Dev. Neurobiol. 72, 1016–1031 10.1002/dneu.22025 - DOI - PubMed
    1. Buffelli M., Burgess R. W., Feng G., Lobe C. G., Lichtman J. W., Sanes J. R. (2003). Genetic evidence that relative synaptic efficacy biases the outcome of synaptic competition. Nature 424, 430–434 10.1038/nature01844 - DOI - PubMed
    1. Chierzi S., Stachniak T. J., Trudel E., Bourque C. W., Murai K. K. (2012). Activity maintains structural plasticity of mossy fiber terminals in the hippocampus. Mol. Cell. Neurosci. 50, 260–271 10.1016/j.mcn.2012.05.004 - DOI - PubMed