. 2012 Nov 8:6:89.
doi: 10.3389/fncom.2012.00089. eCollection 2012.

Seeing via Miniature Eye Movements: A Dynamic Hypothesis for Vision

Affiliations

Seeing via Miniature Eye Movements: A Dynamic Hypothesis for Vision

Ehud Ahissar et al. Front Comput Neurosci. .

Abstract

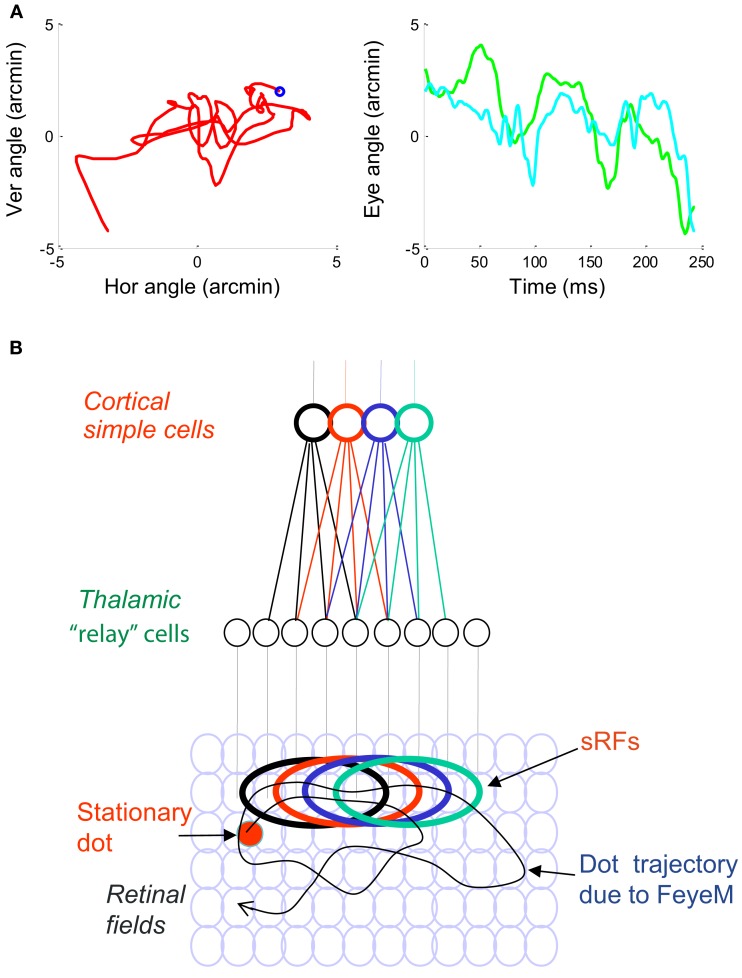
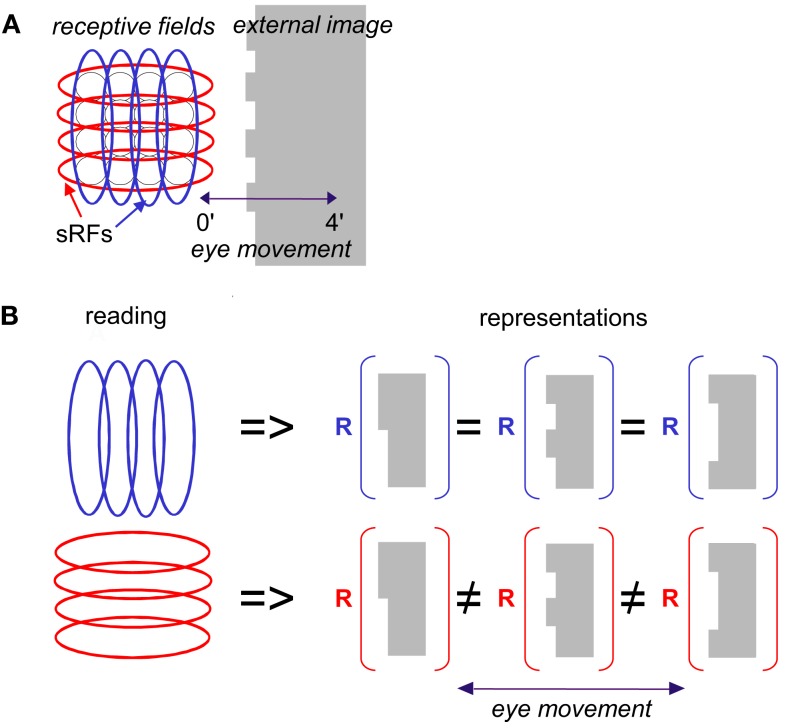
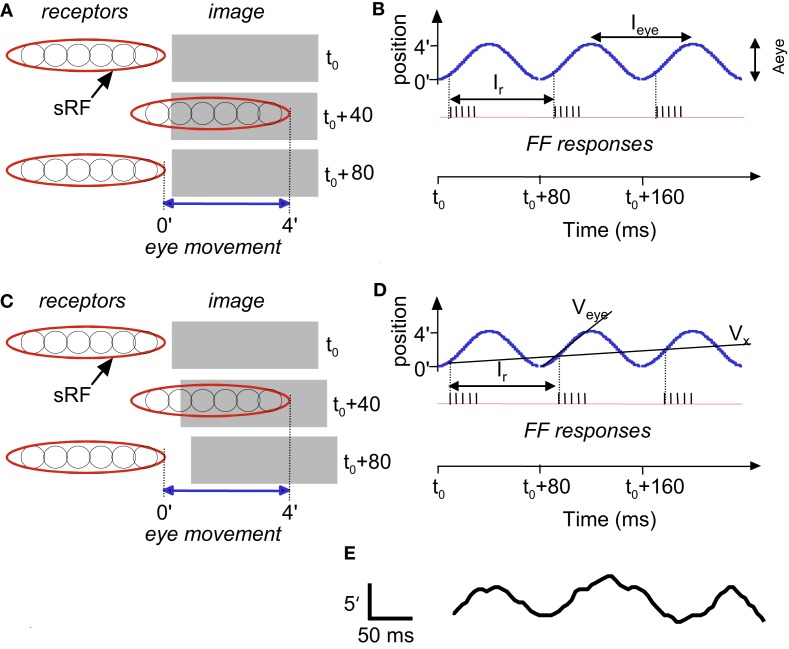
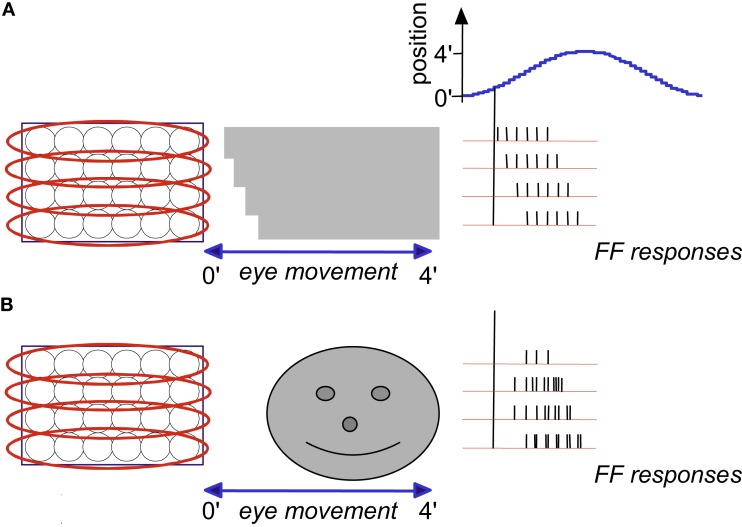
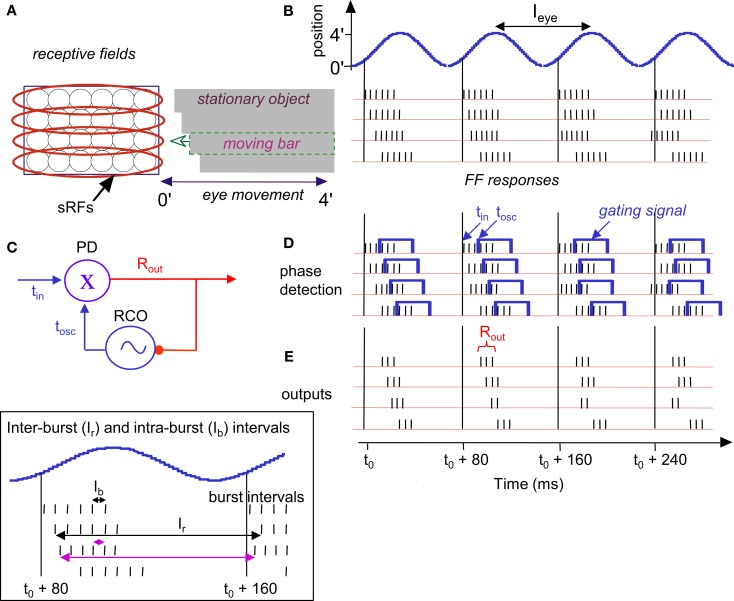
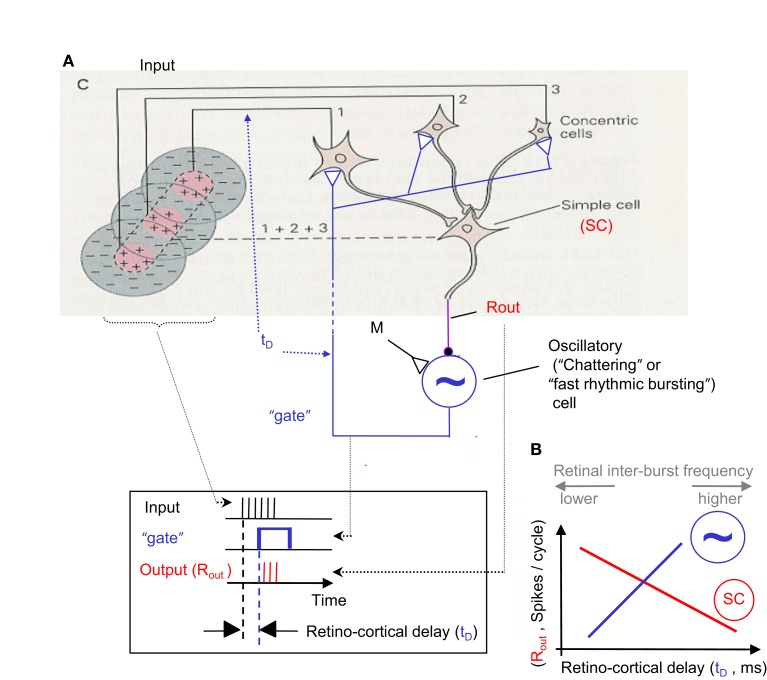
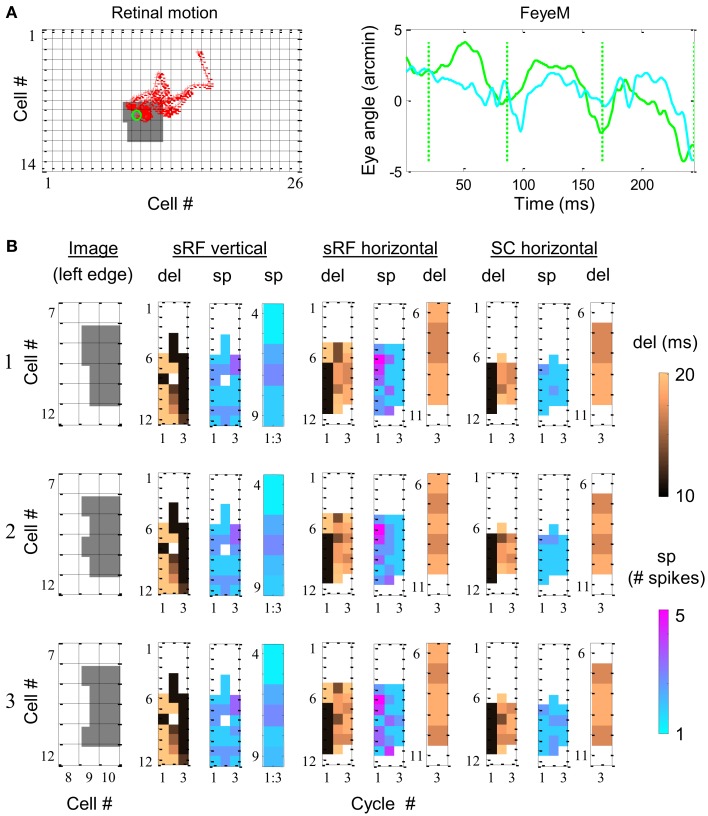
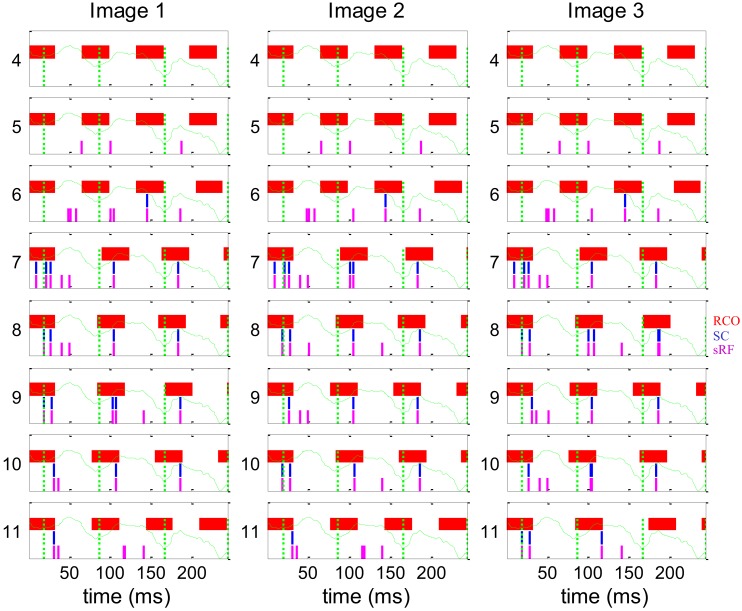
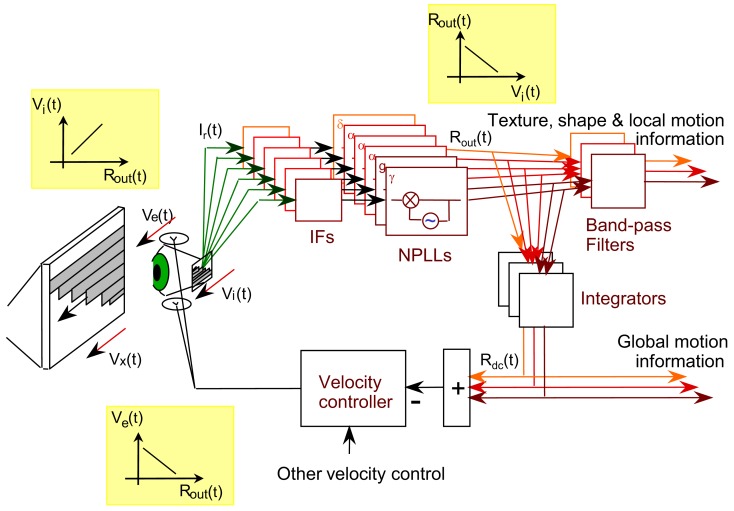
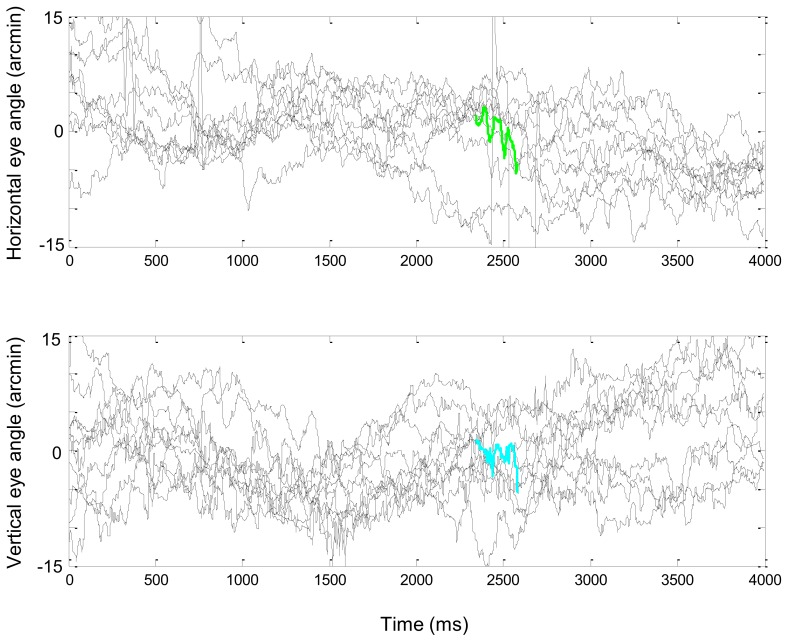
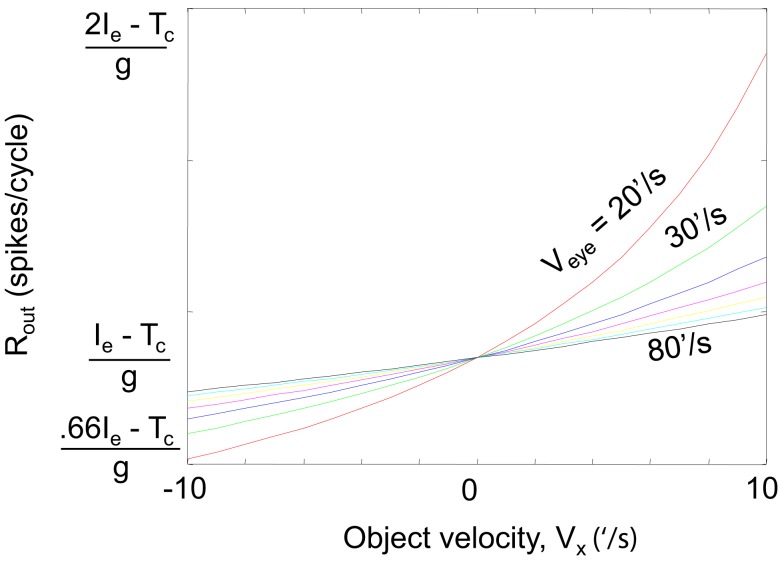
During natural viewing, the eyes are never still. Even during fixation, miniature movements of the eyes move the retinal image across tens of foveal photoreceptors. Most theories of vision implicitly assume that the visual system ignores these movements and somehow overcomes the resulting smearing. However, evidence has accumulated to indicate that fixational eye movements cannot be ignored by the visual system if fine spatial details are to be resolved. We argue that the only way the visual system can achieve its high resolution given its fixational movements is by seeing via these movements. Seeing via eye movements also eliminates the instability of the image, which would be induced by them otherwise. Here we present a hypothesis for vision, in which coarse details are spatially encoded in gaze-related coordinates, and fine spatial details are temporally encoded in relative retinal coordinates. The temporal encoding presented here achieves its highest resolution by encoding along the elongated axes of simple-cell receptive fields and not across these axes as suggested by spatial models of vision. According to our hypothesis, fine details of shape are encoded by inter-receptor temporal phases, texture by instantaneous intra-burst rates of individual receptors, and motion by inter-burst temporal frequencies. We further describe the ability of the visual system to readout the encoded information and recode it internally. We show how reading out of retinal signals can be facilitated by neuronal phase-locked loops (NPLLs), which lock to the retinal jitter; this locking enables recoding of motion information and temporal framing of shape and texture processing. A possible implementation of this locking-and-recoding process by specific thalamocortical loops is suggested. Overall it is suggested that high-acuity vision is based primarily on temporal mechanisms of the sort presented here and low-acuity vision is based primarily on spatial mechanisms.

Keywords: active vision; feedback; fixational eye movements; neural coding; neuronal phase-locked loop; simple cells; temporal coding; thalamocortical loop.


Figures

Figure 1
Figure 1
(A) A short epoch of FeyeM recorded from a human subject fixating on a cross (see Examples of Human FeyeM in Appendix 2 for methods and Figures A1 and A2 in Appendix 2 for more examples). Left, eye rotation trajectory on a 2D plane; coordinates (0, 0) denote cross center and the blue circle denotes eye angle at time = 0. Fight, horizontal (green) and vertical (cian) coordinates of eye angle as a function of time. FeyeM data courtesy of Dr. Moshe Fried. (B) A schematic description of a retinal trajectory of a stationary external dot (red) over a moving retinal mosaic of foveal ganglion RFs. Cortical simple cells receive their inputs, via thalamocortical neurons, from elongated retinal fields.
Figure 2
Figure 2
Scanning of a stationary edge by drift. (A) Retinal mosaic (as in Figure 1) scans a stationary object whose left edge is patterned during a horizontal drift. The peak-to-peak amplitude of the horizontal projection of FeyeM is 4′. Retinal ganglion RFs are indicated by black circles, and sRFs with horizontal (red) and vertical (blue) orientations are indicated by ellipses. (B) Scanning along the long axes of sRFs increases spatial resolution. In this example, reading sRFs oriented parallel to the global orientation of the patterned edge of an external image (blue) cannot generate different representations (R) for different edge patterns, whereas reading sRFs oriented perpendicular to the edge (red) can (using temporal coding).
Figure 3
Figure 3
Temporal encoding along the long axis of sRF during drift: a schematic description. Encoding of stationary (A,B) and moving (C,D) images are depicted. A single horizontal sRF, shown in three time frames (t0, t0 +40 ms and t0 +80 ms), traverses a dark rectangle, which is longer than the peak-to-peak amplitude of the horizontal FeyeM. The horizontal FeyeM amplitude (peak-to-peak) is 4′ and the frequency is 12.5 Hz. (A) Left-most and right-most positions of the sRF relative to the position of a stationary image, within each single cycle of FeyeM. (B) Eye trajectory along the horizontal direction (blue curve) and neuronal responses (vertical lines) composing the FF signal of the sRF in (A). Ieye and Aeye are the period (1/frequency) and amplitude of FeyeM, Ir – is the inter-burst period of the FF response, and t0 is an arbitrary time. One spike is emitted per crossing of the contrast edge by each of the ganglion RFs. (C) Left-most and right-most positions of the sRF relative to the positions of a moving dark rectangle. (D) Eye and image trajectories along the horizontal direction and FF responses of the sRF in (C). Veye is the average eye velocity in the protraction direction, and Vx is the image velocity. (E) An example of a human horizontal FeyeM oscillatory epoch, aligned with our schematic example for comparison (courtesy of Flemming Møller; see Figure 4 in Moller et al., 2002).
Figure 4
Figure 4
Temporal encoding of texture during drift: a schematic description. Retinal mosaic scans a stationary smooth (A) and patterned (B) surfaces during horizontal drift (movement parameters and other conventions as in Figures 2 and 3). Every crossing of a light-to-dark luminance border by a single ganglion RF generates a single spike. For clarity, spikes are drawn only during one direction of drift (the “protraction” direction).
Figure 5
Figure 5
Temporal encoding and decoding by the visual system. (A) A retinal mosaic (as in Figure 2) upon horizontal FeyeM scanning of a stationary object and a moving bar, both of which have the same color and luminance (the moving bar is indicated by a broken rectangle). The bar starts to move leftward around t0 + 20 ms, at a velocity of 3 ’/s. The horizontal arrows mark the horizontal movement of the eye. The horizontal FeyeM amplitude (peak-to-peak) is 4′ and the frequency is 12.5 Hz. (B) FF responses of the horizontally oriented sRFs [red ellipses in (A)]. The sRF that scans the moving bar produces a FF response with higher inter-burst and intra-burst frequencies than its neighbors. (C) NPLL Decoding algorithm. PD, phase detector; X, phase detection, RCO, rate-controlled oscillator; ∼, local oscillations tin, input time; tOSC, oscillator time; Rout, PD’s output representing the phase difference between tin, and tOSC. Blue, temporal signals; red, intensity (rate) signal. (D). Implementation of phase comparison by gating. At each cycle, only those retinal spikes that arrive after the onset of the cortical feedback (blue squares) will “pass the gate.” Phase comparison is obtained by longer (shorter) delays yielding fewer (more) spikes due to decreased (increased) overlap between the inputs. Note the cycle-to-cycle temporal dynamics of both the retinal input and the periodic gating while processing the moving bar. Onset of the retinal signal is represented by tin in (C) and onset of the gating signal by tOSC in (C). (E) Output code of the proposed thalamocortical decoder. The stationary shape is represented by the temporal phase relationships among the outputs of the simple cells (first cycle). The velocity of the bar is represented by a change in the spike count (two instead of three spikes/cycle) of the simple cells [represented by Rout in (C)]. (Inset) Expansion of the second cycle in (B) to show inter-burst (Ir) and intra-beurst (Ib) intervals for stationary (black) and moving (magenta) bars.
Figure 6
Figure 6
NPLL implemented by a visual thalamocortical loop. (A) A schematic description of the proposed thalamocortical closed loop decoder. The scheme is based on the schematic description of the FF connectivity suggested by Hubel and Wiesel (1962); the feedback connectivity added in blue closes the loop in a way that permits a PLL-like operation. Excitatory and inhibitory connections are represented by open triangles and solid circles, respectively. Dashed line indicates possible poly synaptic link. Input, retinothalamic input; SC, simple cells; M, modulatory excitatory input; ∼, oscillatory (“chattering”) neurons. Inset: implementation of the phase detection function by corticothalamic gating: the output is active only when both the Input and the “gate” are active. (B) Schematic phase plane of the two basic transfer functions of the loop. SC’s transfer function (red): output spike count (Rout) decreases as the retino-cortical delay (tD) increases. Oscillatory cells transfer function (blue, dashed): tD increases as Rout increases (note reversal of axes here). The crossing point of the transfer functions is the set point for a specific retinal temporal frequency. The inter-burst frequency of the retinal input is directly related to tD and inversely related to Rout.
Figure 7
Figure 7
Simulation of phase encoding and recoding of a stationary image with human FeyeM. (A) FeyeM recorded from a human subject fixating on a cross (same example as in Figure 1A) were used to shift a stationary image over a retinal array of 14 × 26 OFF photoreceptors (left panel, retinal movement trajectory plotted in red; starting point circled in green). FeyeM cycle onsets were defined as the minima of a low-pass (cutoff frequency: 40 Hz) version of the horizontal trace (right panel, dotted vertical green lines). Size of all retinal RFs was set arbitrarily to 2′. (B) Dynamics of delay (del) and spike count (sp) across the three cycles of the FeyeM epoch in three columns of cells (vertical sRF, horizontal sRF and horizontal SC) and for three external images [rows 1–3, left edges of the images are depicted in the left panel of each row, the rest of the image was identical to the one in (A)]. Sp responses in vertical sRFs (mean over the three cycles) and del responses at the third cycle of sRFs and SCs are enlarged for the relevant cells. FeyeM data courtesy of Dr. Moshe Fried.
Figure 8
Figure 8
Dynamics of the encoding-decoding process. The spike trains of RCO (red vertical lines), SC (blue vertical lines), and sRF (magenta vertical lines) units are shown for the simulations presented in Figure 7. The horizontal trace of FeyeM is depicted in green. Vertical dotted green lines mark cycle onset. Eight units (y = 4–11) are depicted along one column (x = 10). Conduction delays were simulated as zero. Initial RCO frequency was 0.8 of the mean horizontal FeyeM frequency (12.3 Hz) and the open-loop gain was −5.
Figure 9
Figure 9
Schematic diagram of a motor-sensory visual loop containing a bank of NPLLs of different intrinsic frequencies. Vx, Ve, Vi, velocities of an external object, the eye, and the retinal image, respectively; IF, intermediate filter that is centered around the working frequency of its corresponding NPLL; δ, α, γ, the frequency range containing the intrinsic frequency of an NPLL. The major transfer functions dominating the loop are described in the three insets: Rout is the output firing rate of an NPLL.
Figure A1
Figure A1
FeyeM recorded from one human subject while fixating on a single point distanced 1 m from the subject. Ten repetitions of a 4-s fixation period are shown. The three-cycle epoch used in the simulations of Figures 7 and 8 are colored in green and cyan. Courtesy of Dr. Moshe Fried.
Figure A2
Figure A2
FeyeM recorded from five human subjects while wearing masks with artificial eyes (A), fixating on a single spot surrounded by horizontal or vertical gratings (B), freely viewing a colorful image (C,D). Traces are depicted for arbitrary windows of 300 ms (A,B) or for fixational pauses – period starting 30 ms after a saccade and ending 10 ms before the next saccade. Raw traces are depicted in blue and smoothed traces (Butterworth, four poles LPF at 40 Hz) in red. Calibration bar (C) 6 arcmin. (D) Power spectra of the traces in (C). Data are courtesy of Dr. Moshe Fried.
Figure A3
Figure A3
Dependency of Rout on image velocity (Vx). Equation A10 in Appendix 1 is plotted for Veye = 20–80’/s, Ieye (Ie) = 100 ms, and Tc = 66 ms.

Similar articles

Cited by

References

    1. Ahissar E. (1998). Temporal-code to rate-code conversion by neuronal phase-locked loops. Neural. Comput. 10, 597–65010.1162/089976698300017683 - DOI - PubMed
    1. Ahissar E., Abeles M., Ahissar M., Haidarliu S., Vaadia E. (1998). Hebbian-like functional plasticity in the auditory cortex of the behaving monkey. Neuropharmacology 37, 633–65510.1016/S0028-3908(98)00068-9 - DOI - PubMed
    1. Ahissar E., Arieli A. (2001). Figuring space by time. Neuron 32, 185–20110.1016/S0896-6273(01)00466-4 - DOI - PubMed
    1. Ahissar E., Haidarliu S., Zacksenhouse M. (1997). Decoding temporally encoded sensory input by cortical oscillations and thalamic phase comparators. Proc. Natl. Acad. Sci. U.S.A. 94, 11633–1163810.1073/pnas.94.21.11633 - DOI - PMC - PubMed
    1. Ahissar E., Sosnik R., Haidarliu S. (2000). Transformation from temporal to rate coding in a somatosensory thalamocortical pathway. Nature 406, 302–30610.1038/35018568 - DOI - PubMed

LinkOut - more resources