. 2012 Nov 12:3:96.
doi: 10.3389/fpsyt.2012.00096. eCollection 2012.

Hippocampal shape and volume changes with antipsychotics in early stage psychotic illness

Affiliations

Hippocampal shape and volume changes with antipsychotics in early stage psychotic illness

Daniel Mamah et al. Front Psychiatry. .

Abstract

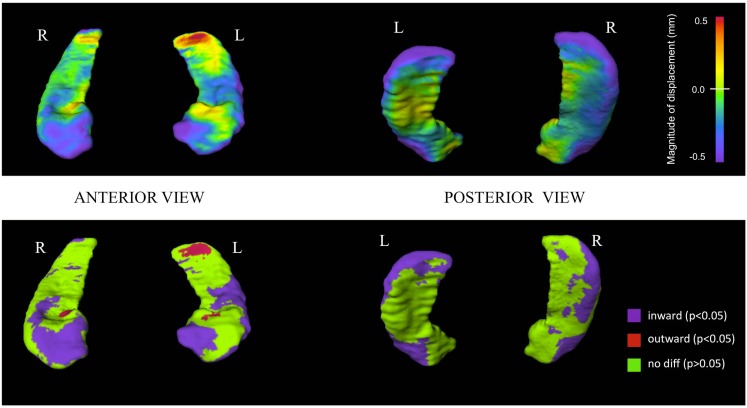
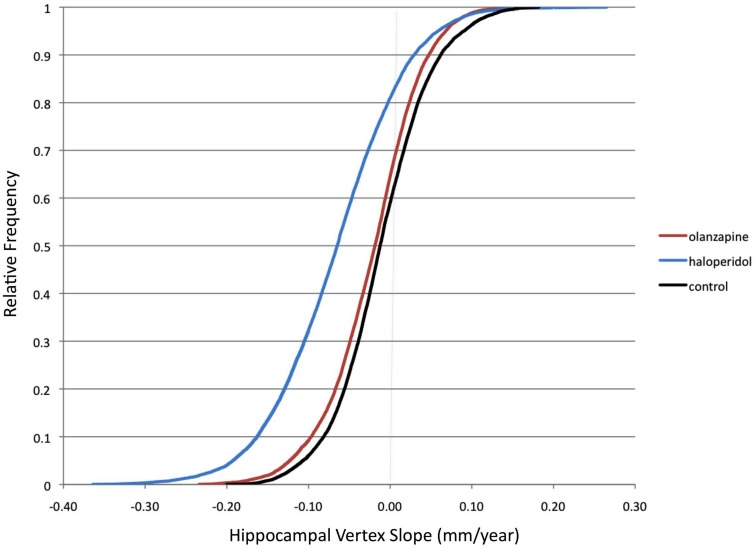
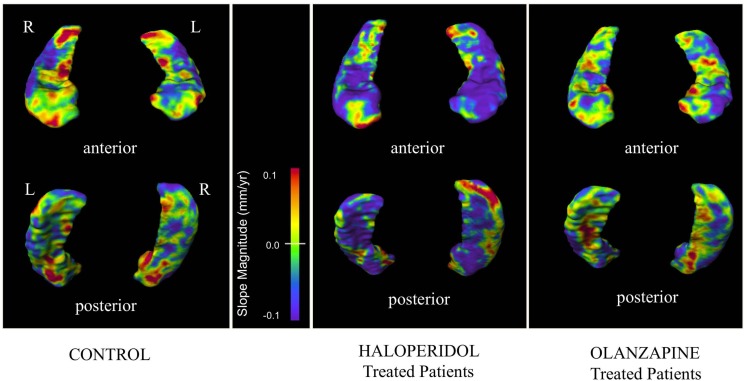
Progression of hippocampal shape and volume abnormalities has been described in psychotic disorders such as schizophrenia. However it is unclear how specific antipsychotic medications influence the development of hippocampal structure. We conducted a longitudinal, randomized, controlled, multisite, double-blind study involving 14 academic medical centers (United States 11, Canada 1, Netherlands 1, and England 1). One hundred thirty-four first-episode psychosis patients (receiving either haloperidol [HAL] or olanzapine [OLZ]) and 51 healthy controls were followed for up to 104 weeks using magnetic resonance imaging and large-deformation high-dimensional brain mapping of the hippocampus. Changes in hippocampal volume and shape metrics (i.e., percentage of negative surface vertex slopes, and surface deformation) were evaluated. Mixed-models analysis did not show a significant group-by-time interaction for hippocampal volume. However, the cumulative distribution function of hippocampal surface vertex slopes showed a notable left shift with HAL treatment compared to OLZ treatment and to controls. OLZ treatment was associated with a significantly lower percentage of "large magnitude" negative surface vertex slopes compared to HAL treatment (p = 0.004). Surface deformation maps however did not localize any hippocampal regions that differentially contracted over time with OLZ treatment, after FDR correction. These results indicate that surface analysis provides supplementary information to volumetry in detecting differential treatment effects of the hippocampus. Our results suggest that OLZ is associated with less longitudinal hippocampal surface deformation than HAL, however the hippocampal regions affected appear to be variable across patients.

Keywords: MRI; haloperidol; hippocampus; olanzapine; psychosis; schizophrenia.


Figures

Figure 1
Figure 1
Hippocampal surface maps showing baseline structural differences between first-episode psychosis patients and controls. Hippocampal surface generation of baseline scans was done by high-dimensional brain mapping (HDBM-LD) from a neuroanatomical template (see Materials and Methods). Groups were compared at each of 13,222 corresponding vertices on the hippocampal surface. Top row: structural differences are shown using a continuous color-coded scale. Purple/blue shading denotes regions of inward surface displacement (i.e., surface contraction) in first-episode psychosis patients compared to controls. Red/orange shading denotes regions of outward displacement (i.e., surface expansion). Bottom row: structural differences shown using a color-coded scale thresholded at statistical significance. Purple regions show statistically significant (p < 0.05) inward displacement in psychotic patients compared to controls. Red regions show statistically significant (p < 0.05) outward displacement in psychotic patients compared to controls. Green regions indicate statistically similar group values. Surface vertex differences are thresholded at a false discovery rate (FDR) of 5% (i.e., q = 0.05) applied to Mann–Whitney U test based p-values.
Figure 2
Figure 2
Cumulative distribution functions of hippocampal surface vertices. Group distributions of mean slope (mm/year) across the 13,222 hippocampal surface vertices (left and right combined) are shown. Slopes were calculated using all available visits (up to a maximum follow-up of 104 weeks). Black = Healthy controls. Red = Olanzapine-treated patients. Blue = Haloperidol-treated patients.
Figure 3
Figure 3
Hippocampal surface maps showing progression of surface displacement. Mean slope values (depicting longitudinal structural change over a maximum period of 104 weeks) at each hippocampal surface vertex were calculated in each group. Slope values are color-coded, with purple/blue regions denoting regions of longitudinal surface contraction and red/orange regions denoting regions of longitudinal surface expansion. Surface maps are thresholded between slope values of ±0.1 mm/year.

Similar articles

Cited by

References

    1. Abdul-Monim Z., Reynolds G. P., Neill J. C. (2003). The atypical antipsychotic ziprasidone, but not haloperidol, improves phencyclidine-induced cognitive deficits in a reversal learning task in the rat. J. Psychopharmacol. (Oxford) 17, 57–6510.1177/0269881103017001700 - DOI - PubMed
    1. Ashburner J., Csernansky J. G., Davatzikos C., Fox N. C., Frisoni G. B., Thompson P. M. (2003). Computer-assisted imaging to assess brain structure in healthy and diseased brains. Lancet Neurol. 2, 79–8810.1016/S1474-4422(03)00304-1 - DOI - PubMed
    1. Bai O., Chlan-Fourney J., Bowen R., Keegan D., Li X. M. (2003). Expression of brain-derived neurotrophic factor mRNA in rat hippocampus after treatment with antipsychotic drugs. J. Neurosci. Res. 71, 127–13110.1002/jnr.10440 - DOI - PubMed
    1. Boyer P., Phillips J. L., Rousseau F. L., Ilivitsky S. (2007). Hippocampal abnormalities and memory deficits: new evidence of a strong pathophysiological link in schizophrenia. Brain Res. Rev. 54, 92–11210.1016/j.brainresrev.2006.12.008 - DOI - PubMed
    1. Carlsson A. (1978). Antipsychotic drugs, neurotransmitters, and schizophrenia. Am. J. Psychiatry 135, 165–173 - PubMed

LinkOut - more resources